In the evolving energy sector, Duke Energy Corporation (DUK) and Alliant Energy Corporation (LNT) stand out as key players in regulated electric utilities. Both companies provide essential electricity and natural gas services across overlapping U.S. regions, while pursuing innovation through renewable projects and infrastructure upgrades. This comparison explores their market positions and strategies to help you identify which company aligns best with your investment goals. Let’s discover which is the more compelling choice for your portfolio.
Table of contents
Companies Overview
I will begin the comparison between Duke Energy Corporation and Alliant Energy Corporation by providing an overview of these two companies and their main differences.
Duke Energy Corporation Overview
Duke Energy Corporation operates as a leading energy company in the US, focusing on electric utilities, gas utilities, and commercial renewables. Serving about 8.2M customers across six states, Duke manages a vast service territory of 91,000 sq miles with 50,259 MW of generation capacity. Its energy mix includes coal, hydro, natural gas, oil, renewables, and nuclear power, positioning it as a diversified utility with a strong presence in the Southeast and Midwest.
Alliant Energy Corporation Overview
Alliant Energy Corporation is a utility holding company providing regulated electricity and natural gas services primarily in Iowa and Wisconsin. It serves roughly 1.4M retail customers through subsidiaries IPL and WPL, supplying electric, gas, and steam services. Beyond utilities, Alliant operates freight and logistics services and holds interests in gas-fired and wind energy generation, targeting diverse industrial and agricultural markets in the Midwest.
Key similarities and differences
Both companies operate in the regulated electric utility sector, offering electricity and natural gas services to retail and wholesale customers. Duke Energy has a larger scale, with a broader geographic footprint and diversified generation assets, including nuclear and extensive renewables. Alliant Energy focuses on Midwest regional markets with a smaller customer base and integrates freight logistics into its business, differentiating it from Duke’s pure utility and renewable energy focus.
Income Statement Comparison
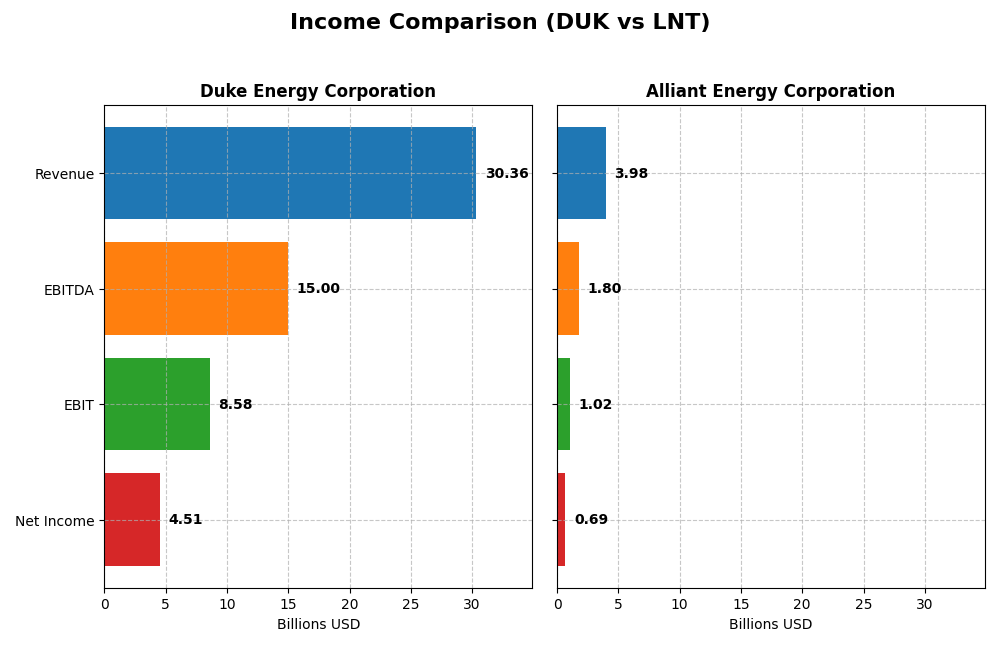
The table below presents a side-by-side comparison of key income statement metrics for Duke Energy Corporation and Alliant Energy Corporation for the fiscal year 2024.
| Metric | Duke Energy Corporation | Alliant Energy Corporation |
|---|---|---|
| Market Cap | 90.8B | 16.7B |
| Revenue | 30.4B | 3.98B |
| EBITDA | 15.0B | 1.80B |
| EBIT | 8.58B | 1.03B |
| Net Income | 4.51B | 690M |
| EPS | 5.71 | 2.69 |
| Fiscal Year | 2024 | 2024 |
Income Statement Interpretations
Duke Energy Corporation
Duke Energy’s revenue increased steadily from $23.4B in 2020 to $30.4B in 2024, with net income rising significantly from $1.28B to $4.51B over the same period. Gross and EBIT margins remained strong, around 50% and 28% respectively, with net margin near 15%. In 2024, growth was moderate with a 4.46% revenue rise and improved profitability metrics, signaling solid operational performance.
Alliant Energy Corporation
Alliant Energy’s revenue grew from $3.42B in 2020 to $3.98B in 2024, though it dipped slightly in the latest year. Net income increased modestly from $614M to $690M over five years. Margins were favorable, with a gross margin near 45% and net margin above 17%, but the most recent year showed declines in revenue (-1.14%) and EBIT (-6.9%), indicating some pressure on earnings and margin contraction.
Which one has the stronger fundamentals?
Duke Energy exhibits stronger fundamentals with pronounced revenue and net income growth over the period, supported by favorable margin expansions and positive earnings per share trends. Conversely, Alliant Energy’s recent revenue and profitability declines, along with unfavorable margin trends, suggest comparatively weaker income statement dynamics despite stable longer-term growth.
Financial Ratios Comparison
The table below presents a side-by-side comparison of key financial ratios for Duke Energy Corporation (DUK) and Alliant Energy Corporation (LNT) for the fiscal year 2024, providing insights into their profitability, liquidity, leverage, and market valuation.
| Ratios | Duke Energy Corporation (DUK) | Alliant Energy Corporation (LNT) |
|---|---|---|
| ROE | 8.997% | 9.852% |
| ROIC | 4.017% | 4.885% |
| P/E | 18.44 | 21.98 |
| P/B | 1.66 | 2.17 |
| Current Ratio | 0.67 | 0.44 |
| Quick Ratio | 0.44 | 0.33 |
| D/E (Debt-to-Equity) | 1.70 | 1.49 |
| Debt-to-Assets | 45.7% | 45.8% |
| Interest Coverage | 2.34 | 1.97 |
| Asset Turnover | 0.16 | 0.18 |
| Fixed Asset Turnover | 0.24 | 0.21 |
| Payout Ratio | 71.2% | 71.3% |
| Dividend Yield | 3.86% | 3.24% |
Interpretation of the Ratios
Duke Energy Corporation
Duke Energy shows a mixed ratio profile with favorable net margin (14.86%) and dividend yield (3.86%), but weak returns on equity (9.0%) and invested capital (4.02%). Its liquidity ratios are below 1, indicating potential short-term solvency concerns. The company pays a steady dividend supported by moderate payout ratios, though free cash flow coverage appears limited, suggesting caution on sustainability.
Alliant Energy Corporation
Alliant Energy has a stronger net margin (17.33%) and a slightly higher return on equity (9.85%) than Duke, but like Duke, it struggles with weak returns on invested capital (4.88%) and low liquidity ratios under 0.5. The dividend yield of 3.24% is supported by consistent payouts, yet free cash flow coverage is also constrained, which may pose risks for future distributions.
Which one has the best ratios?
Both companies share a similar pattern of financial strengths and weaknesses, with favorable profitability margins and dividend yields but unfavorable liquidity and leverage metrics. Their overall ratio evaluations are equally “slightly unfavorable,” reflecting balanced risks and opportunities without a clear leader based solely on these ratios.
Strategic Positioning
This section compares the strategic positioning of Duke Energy Corporation and Alliant Energy Corporation, including market position, key segments, and exposure to technological disruption:
Duke Energy Corporation
- Leading utility with large market cap ($90.8B), serving 8.2M customers across 6 states; faces regulated electric competitive pressure.
- Revenue driven by Electric Utilities ($26.8B) and Gas Utilities ($2.3B), plus growing Commercial Renewables segment with 3,554 MW capacity across 22 states.
- Exposure to technological disruption through Commercial Renewables, owning wind, solar, battery storage, and fuel cell facilities; diversified energy sources including nuclear and coal.
Alliant Energy Corporation
- Smaller market cap ($16.7B), serving under 1M retail electric customers mainly in Iowa and Wisconsin; operates in regulated electric sector.
- Electric segment ($3.37B) dominates revenue, with smaller Gas ($465M) and Other Utility segments; also operates freight services and holds wind and gas-fired generation assets.
- Moderate technological exposure with wind farm (225 MW) and natural gas-fired unit (347 MW); focus remains on regulated electric and gas utilities with limited renewables.
Duke Energy Corporation vs Alliant Energy Corporation Positioning
Duke has a diversified business model combining electric, gas, and renewable energy with a broad geographic footprint, offering scale advantages. Alliant concentrates on regulated electric and gas in fewer states with additional freight operations, implying less diversification but focused regional presence.
Which has the best competitive advantage?
Both companies currently shed value with ROIC below WACC; Duke shows improving profitability (slightly unfavorable moat), while Alliant’s profitability remains stable but unfavorable, indicating limited sustainable competitive advantage for either.
Stock Comparison
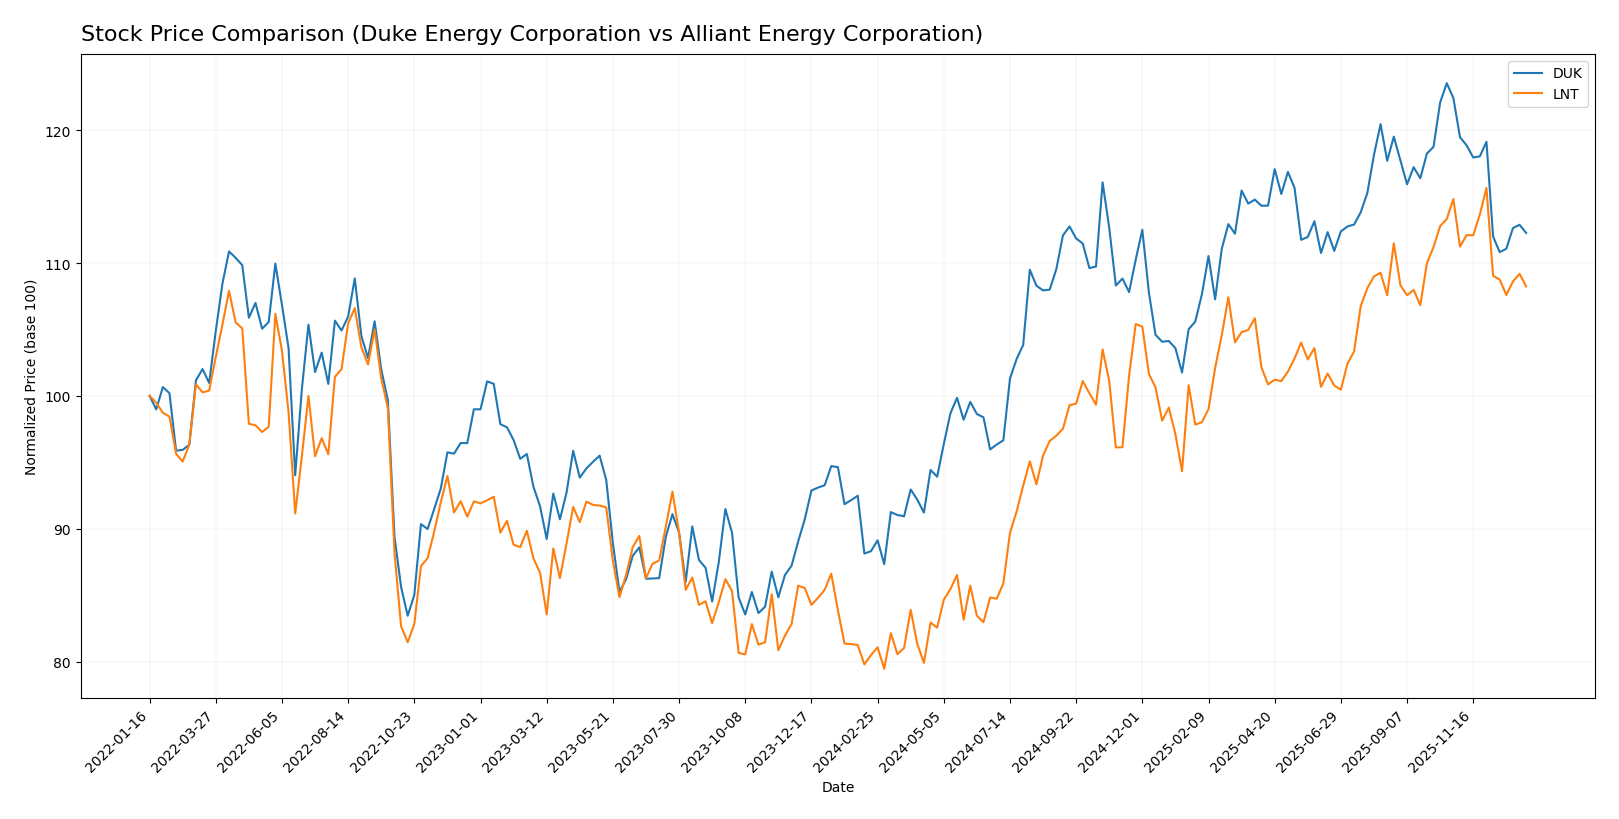
The stock prices of Duke Energy Corporation and Alliant Energy Corporation have exhibited notable bullish trends over the past year, with both showing a deceleration in momentum and recent short-term declines reflecting seller dominance.
Trend Analysis
Duke Energy Corporation’s stock rose by 27.12% over the past 12 months, indicating a bullish trend with decelerating price acceleration. The price ranged from 90.86 to a high of 128.53, with increased volatility shown by a 9.13 standard deviation.
Alliant Energy Corporation’s stock increased by 34.48% over the same period, also showing a bullish trend but with decelerating momentum. The price fluctuated between 47.73 and a peak of 69.47, with lower volatility at a 5.9 standard deviation.
Comparing both, Alliant Energy Corporation delivered the highest market performance with a 34.48% gain versus Duke Energy’s 27.12% rise over the past year.
Target Prices
The consensus target prices for Duke Energy Corporation and Alliant Energy Corporation reflect moderate upside potential from current levels.
| Company | Target High | Target Low | Consensus |
|---|---|---|---|
| Duke Energy Corporation | 150 | 126 | 135.91 |
| Alliant Energy Corporation | 78 | 65 | 73 |
Analysts expect Duke Energy’s stock to rise from $116.8 toward a consensus of $135.91, indicating upside potential. Alliant Energy’s consensus target of $73 also suggests a positive outlook compared to its current price of $65.02.
Analyst Opinions Comparison
This section compares analysts’ ratings and grades for Duke Energy Corporation and Alliant Energy Corporation:
Rating Comparison
DUK Rating
- Rating: C+, considered Very Favorable by analysts.
- Discounted Cash Flow Score: 1, rated Very Unfavorable, indicating weak DCF.
- ROE Score: 3, Moderate status, reflecting average efficiency in equity use.
- ROA Score: 3, Moderate, suggesting average asset utilization.
- Debt To Equity Score: 2, Moderate, implying moderate financial risk.
- Overall Score: 2, Moderate overall financial standing.
LNT Rating
- Rating: C+, considered Very Favorable by analysts.
- Discounted Cash Flow Score: 3, rated Moderate, showing better cash flow value.
- ROE Score: 1, Very Unfavorable, indicating poor profit generation on equity.
- ROA Score: 4, Favorable, indicating strong asset efficiency.
- Debt To Equity Score: 1, Very Unfavorable, indicating higher financial risk.
- Overall Score: 2, Moderate overall financial standing.
Which one is the best rated?
Both Duke Energy and Alliant Energy share an identical overall rating of C+ and a moderate overall score of 2. Duke shows strength in ROE and debt management, while Alliant scores higher in discounted cash flow and ROA but has weaker equity returns and higher financial risk.
Scores Comparison
Here is a comparison of the Altman Z-Score and Piotroski Score for Duke Energy Corporation and Alliant Energy Corporation:
Duke Energy Corporation Scores
- Altman Z-Score: 0.71, in distress zone indicating high bankruptcy risk
- Piotroski Score: 6, average financial strength
Alliant Energy Corporation Scores
- Altman Z-Score: unavailable, no data provided
- Piotroski Score: 5, average financial strength
Which company has the best scores?
Based on the provided data, Duke Energy has a known Altman Z-Score indicating financial distress, while Alliant Energy’s Altman Z-Score is unavailable. Both have average Piotroski Scores, with Duke slightly higher at 6 versus 5.
Grades Comparison
Here is a comparison of recent grades assigned to Duke Energy Corporation and Alliant Energy Corporation by reputable grading firms:
Duke Energy Corporation Grades
The following table summarizes recent grades from established financial institutions for Duke Energy Corporation:
| Grading Company | Action | New Grade | Date |
|---|---|---|---|
| UBS | Maintain | Neutral | 2025-12-17 |
| JP Morgan | Maintain | Neutral | 2025-12-11 |
| Mizuho | Maintain | Outperform | 2025-10-27 |
| Morgan Stanley | Maintain | Equal Weight | 2025-10-22 |
| Barclays | Maintain | Overweight | 2025-10-14 |
| UBS | Maintain | Neutral | 2025-10-10 |
| BMO Capital | Maintain | Outperform | 2025-10-10 |
| Scotiabank | Upgrade | Sector Outperform | 2025-10-03 |
| Jefferies | Downgrade | Hold | 2025-09-26 |
| Morgan Stanley | Maintain | Equal Weight | 2025-09-25 |
Overall, Duke Energy’s grades show a mix of neutral to moderately positive ratings, with some upgrades and downgrades but a consensus hold stance.
Alliant Energy Corporation Grades
The following table summarizes recent grades from established financial institutions for Alliant Energy Corporation:
| Grading Company | Action | New Grade | Date |
|---|---|---|---|
| UBS | Maintain | Buy | 2025-12-17 |
| UBS | Upgrade | Buy | 2025-10-24 |
| B of A Securities | Maintain | Buy | 2025-10-17 |
| BMO Capital | Maintain | Market Perform | 2025-10-17 |
| Barclays | Maintain | Underweight | 2025-10-14 |
| UBS | Maintain | Neutral | 2025-10-10 |
| B of A Securities | Maintain | Buy | 2025-08-14 |
| BMO Capital | Maintain | Market Perform | 2025-08-11 |
| UBS | Maintain | Neutral | 2025-07-11 |
| Jefferies | Maintain | Buy | 2025-07-11 |
Alliant Energy’s ratings lean more toward buy recommendations, with some market perform and a single underweight, reflecting a generally optimistic view.
Which company has the best grades?
Alliant Energy Corporation has received comparatively stronger grades than Duke Energy Corporation, with more buy ratings and fewer hold recommendations. This difference may influence investors by indicating a more favorable analyst outlook on Alliant Energy’s growth or valuation prospects relative to Duke Energy.
Strengths and Weaknesses
Below is a comparison of key strengths and weaknesses for Duke Energy Corporation (DUK) and Alliant Energy Corporation (LNT) based on their latest financial and operational data.
| Criterion | Duke Energy Corporation (DUK) | Alliant Energy Corporation (LNT) |
|---|---|---|
| Diversification | Strong diversification with Electric Utilities & Infrastructure ($26.8B) and Gas Utilities ($2.3B) | Less diversified, mainly Electric ($3.4B) and Gas ($465M) segments |
| Profitability | Favorable net margin (14.9%), but ROIC (4.0%) below WACC (4.8%), indicating value destruction | Higher net margin (17.3%), ROIC (4.9%) below WACC (5.9%), also destroying value |
| Innovation | Moderate focus with Commercial Renewables around $500M, showing some commitment to clean energy | Limited innovation exposure; no significant renewables segment reported |
| Global presence | Primarily US-based with minor international exposure in past years | Mainly regional US utility with no notable international presence |
| Market Share | Large market share in electric utilities with $26.8B revenue; dominant in infrastructure | Smaller market share focused regionally with $3.4B electric revenue |
Key takeaways: Duke Energy shows stronger diversification and scale but struggles with profitability efficiency. Alliant Energy has better net margins but limited scale and innovation, both face challenges in generating returns above capital costs. Investors should weigh scale against profitability trends carefully.
Risk Analysis
Below is a comparative risk analysis table for Duke Energy Corporation (DUK) and Alliant Energy Corporation (LNT) based on the most recent 2024 data.
| Metric | Duke Energy Corporation (DUK) | Alliant Energy Corporation (LNT) |
|---|---|---|
| Market Risk | Beta 0.49 (low volatility) | Beta 0.67 (moderate volatility) |
| Debt level | D/E 1.7 (unfavorable), Debt/Assets 45.74% (neutral) | D/E 1.49 (unfavorable), Debt/Assets 45.81% (neutral) |
| Regulatory Risk | Moderate, due to regulated electric utilities sector | Moderate, similar regulated utility exposure |
| Operational Risk | High, due to diverse generation assets and infrastructure | Moderate, smaller scale with fewer employees |
| Environmental Risk | Elevated from coal, gas, nuclear, and renewables mix | Moderate, includes natural gas and wind generation |
| Geopolitical Risk | Low, primarily US domestic operations | Low, primarily US domestic operations |
Duke Energy’s key risks are elevated debt levels and operational complexity given its large asset base and generation mix. Both companies face regulatory and environmental risks typical of utilities, but Duke’s scale adds operational challenges. Market volatility risk is relatively low for both. Duke’s Altman Z-score indicates financial distress, signaling heightened bankruptcy risk, while Alliant’s score is unavailable but financial ratios suggest caution.
Which Stock to Choose?
Duke Energy Corporation (DUK) shows a favorable income statement with strong revenue and net income growth over 2020-2024, though its profitability ratios like ROE and ROIC are slightly unfavorable. The company carries moderate debt, a low current ratio, and a slightly unfavorable overall financial ratios evaluation but holds a very favorable rating of C+.
Alliant Energy Corporation (LNT) presents a mixed income evolution with some recent declines but overall positive net income growth. Its financial ratios mirror Duke’s with slightly unfavorable ROE and ROIC, moderate debt, and a low liquidity ratio. It shares the same very favorable C+ rating but exhibits an unfavorable overall income statement evaluation.
For investors, Duke’s growing profitability and favorable income statement might appeal to those prioritizing earnings growth, while Alliant’s steadier financial ratios and moderate valuation could suit investors seeking relative stability despite less robust income growth. Both companies face some financial constraints, so the choice may depend on whether growth or stability aligns better with the investor’s risk tolerance and strategy.
Disclaimer: Investment carries a risk of loss of initial capital. The past performance is not a reliable indicator of future results. Be sure to understand risks before making an investment decision.
Go Further
I encourage you to read the complete analyses of Duke Energy Corporation and Alliant Energy Corporation to enhance your investment decisions: