In the evolving landscape of regulated electric utilities, DTE Energy Company and Alliant Energy Corporation stand out as key players. Both firms offer electricity and natural gas services across the Midwest, competing in overlapping markets with a focus on integrating renewable energy and modern infrastructure. This article will analyze their strategies and financial strengths to help you identify which company might be the most compelling addition to your investment portfolio.
Table of contents
Companies Overview
I will begin the comparison between DTE Energy Company and Alliant Energy Corporation by providing an overview of these two companies and their main differences.
DTE Energy Company Overview
DTE Energy Company is a utility firm focused on regulated electric and gas operations in Michigan. Its Electric segment serves around 2.3M customers through a diverse energy mix including fossil fuels, nuclear, hydroelectric, and renewables. The Gas segment delivers natural gas to 1.3M customers and manages extensive pipeline infrastructure. Founded in 1903 and based in Detroit, DTE is a significant regional player with integrated energy services and trading capabilities.
Alliant Energy Corporation Overview
Alliant Energy Corporation operates as a utility holding company providing regulated electricity and natural gas services primarily in Iowa and Wisconsin. It serves retail and wholesale customers through subsidiaries IPL and WPL, with a customer base exceeding 1.4M combined. The company also operates freight and logistics services and holds interests in natural gas and wind power generation. Headquartered in Madison and founded in 1981, Alliant targets diversified energy delivery and regional infrastructure.
Key similarities and differences
Both companies operate in the regulated electric utility sector in the US Midwest and provide natural gas services alongside electricity. DTE is more concentrated in Michigan with a broader energy generation portfolio including nuclear and hydroelectric assets, while Alliant covers multiple states with additional freight logistics operations. Each serves over a million customers but differs in scale, infrastructure, and the extent of industrial services offered, reflecting distinct regional focuses and business models.
Income Statement Comparison
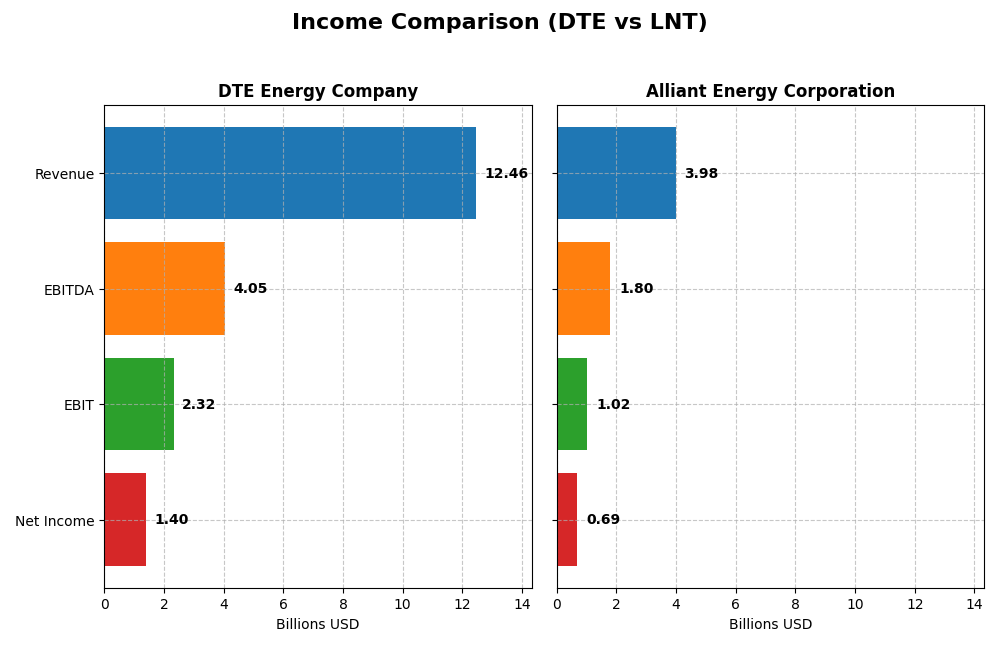
The table below compares the key income statement metrics of DTE Energy Company and Alliant Energy Corporation for the fiscal year 2024, providing a snapshot of their recent financial performance.
| Metric | DTE Energy Company | Alliant Energy Corporation |
|---|---|---|
| Market Cap | 27B | 17B |
| Revenue | 12.46B | 3.98B |
| EBITDA | 4.05B | 1.80B |
| EBIT | 2.32B | 1.03B |
| Net Income | 1.40B | 690M |
| EPS | 6.78 | 2.69 |
| Fiscal Year | 2024 | 2024 |
Income Statement Interpretations
DTE Energy Company
DTE’s revenue showed a mild overall increase of 9.05% from 2020 to 2024 but declined by 2.26% in the last year. Net income growth was modest at 2.41% over the period, with slight margin deterioration of 6.09%. In 2024, gross and EBIT margins remained favorable at 34.82% and 18.63%, respectively, though revenue and EBIT declined, indicating some pressure on operational efficiency.
Alliant Energy Corporation
Alliant Energy achieved a stronger revenue growth of 16.54% over five years but experienced a minor 1.14% decline in 2024. Net income grew 10.58% overall, supported by a robust 17.33% net margin. However, recent margins slightly weakened, with EBIT margin at 25.75% and net margin declining 0.72% last year, reflecting some margin pressure despite solid top-line expansion.
Which one has the stronger fundamentals?
Alliant Energy shows stronger revenue and net income growth over the period with higher margins, especially gross and EBIT margins, than DTE. However, both companies faced revenue declines and margin pressures in the latest year. DTE’s margins are lower but more stable, while Alliant’s interest expenses are less favorable. Overall, each exhibits mixed signals with recent challenges despite long-term growth.
Financial Ratios Comparison
Below is a comparison of key financial ratios for DTE Energy Company and Alliant Energy Corporation based on their most recent fiscal year data (2024).
| Ratios | DTE Energy Company | Alliant Energy Corporation |
|---|---|---|
| ROE | 12.0% | 9.9% |
| ROIC | 4.6% | 4.9% |
| P/E | 17.8 | 22.0 |
| P/B | 2.14 | 2.17 |
| Current Ratio | 0.71 | 0.44 |
| Quick Ratio | 0.46 | 0.33 |
| D/E (Debt-to-Equity) | 1.99 | 1.49 |
| Debt-to-Assets | 47.6% | 45.8% |
| Interest Coverage | 2.20 | 1.97 |
| Asset Turnover | 0.26 | 0.18 |
| Fixed Asset Turnover | 0.40 | 0.21 |
| Payout Ratio | 57.7% | 71.3% |
| Dividend Yield | 3.24% | 3.24% |
Interpretation of the Ratios
DTE Energy Company
DTE shows a mixed ratio profile with a favorable net margin of 11.27% and dividend yield at 3.24%, indicating stable profitability and shareholder returns. However, the company faces concerns with a low current ratio of 0.71 and high debt-to-equity of 1.99, reflecting potential liquidity and leverage risks. Dividend payments appear supported but free cash flow is negative, warranting caution.
Alliant Energy Corporation
Alliant Energy exhibits a strong net margin of 17.33% and a dividend yield matching DTE’s at 3.24%, though its return on equity at 9.85% is less favorable. Liquidity ratios are weaker with a current ratio of 0.44, and leverage remains substantial with debt-to-equity at 1.49. Despite paying dividends, the company’s free cash flow is also negative, highlighting financial pressure.
Which one has the best ratios?
Both companies share a slightly unfavorable overall ratio evaluation, with DTE showing a better return on equity and more balanced leverage, while Alliant Energy has a higher net margin but weaker liquidity and returns. Dividend yields are identical, yet both face challenges with cash flow and liquidity, making neither decisively superior based solely on these ratios.
Strategic Positioning
This section compares the strategic positioning of DTE and LNT, including Market position, Key segments, and Exposure to technological disruption:
DTE
- Market position and competitive pressure: Larger market cap, lower beta, operates in Michigan with strong utility presence.
- Key segments and business drivers: Diversified across Electric, Gas, Energy Trading, and Industrial projects.
- Exposure to technological disruption: Uses renewable assets and nuclear but no explicit mention of disruptive tech focus.
LNT
- Smaller market cap, higher beta, operates mainly in Iowa and Wisconsin with regional utility focus.
- Concentrated mainly in Electric and Gas utility operations with some freight and wholesale services.
- Engagement in wind energy and natural gas generation with steady utility services, limited tech disruption noted.
DTE vs LNT Positioning
DTE shows a diversified portfolio across multiple energy and industrial segments, providing varied revenue streams. LNT has a more concentrated utility focus with regional electric and gas operations, complemented by logistics services. Diversification offers broader exposure but may bring complexity.
Which has the best competitive advantage?
Both companies are currently shedding value as ROIC is below WACC; however, DTE shows a growing ROIC trend, indicating improving profitability, while LNT’s ROIC trend is neutral, reflecting stable but unfavorable value creation.
Stock Comparison
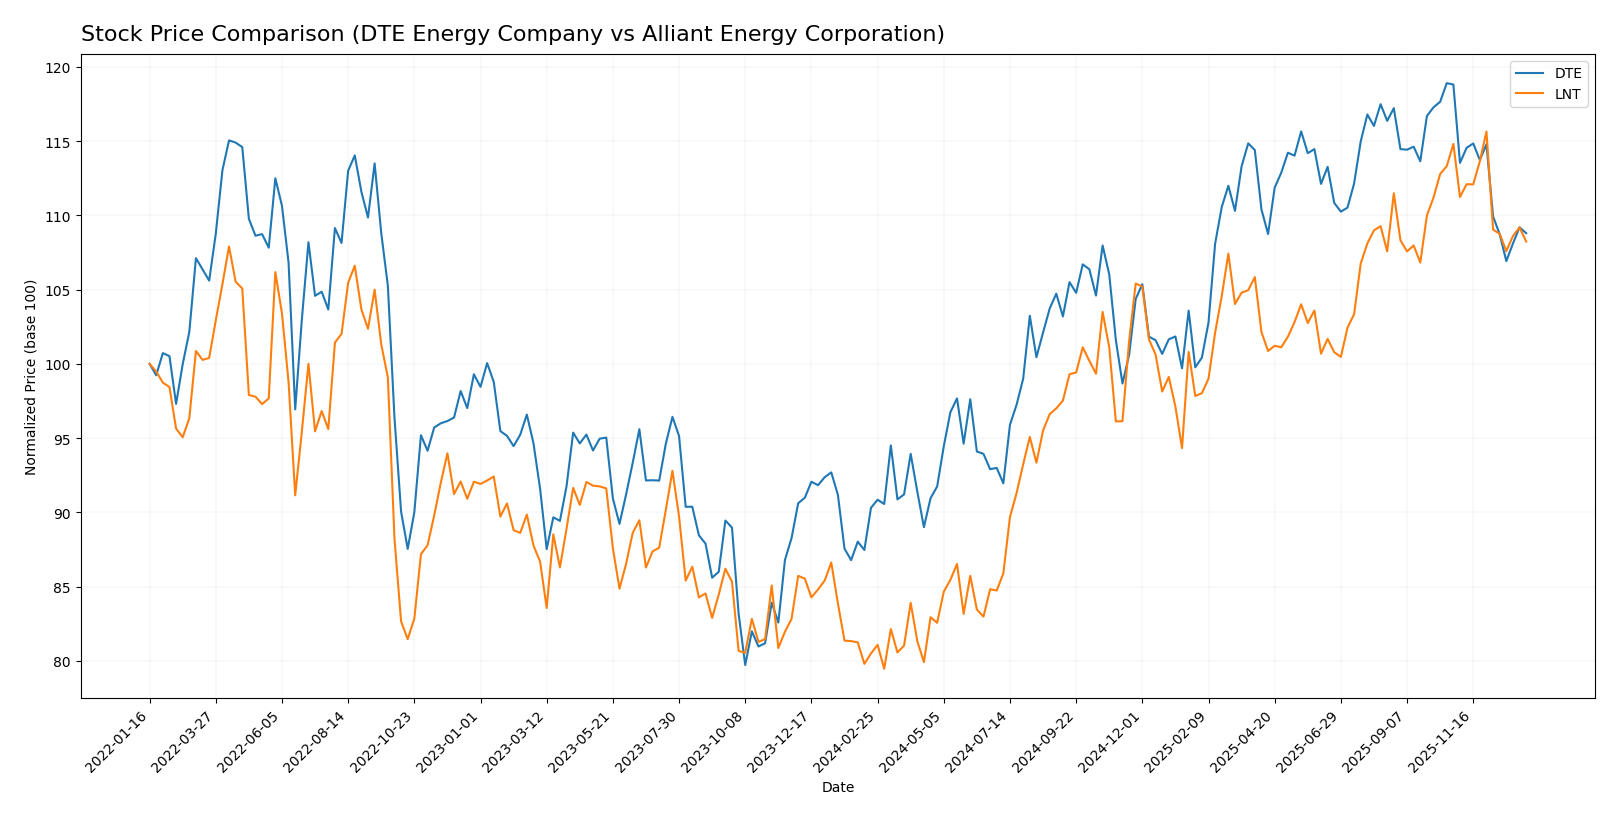
The stock price chart of DTE Energy Company and Alliant Energy Corporation over the past 12 months highlights significant bullish gains with decelerating momentum, followed by recent downward trends reflecting seller dominance in trading dynamics.
Trend Analysis
DTE Energy Company’s stock rose 20.49% over the past year, showing a bullish trend with deceleration. The price ranged between 106.25 and 141.95, with recent weeks marked by an 8.42% decline and increased selling pressure.
Alliant Energy Corporation’s stock increased 34.48% over the same period, also bullish with deceleration. Its price fluctuated between 47.73 and 69.47, though recent trading saw a 5.73% drop amid slightly seller-dominant behavior.
Comparing trends, Alliant Energy outperformed DTE with a stronger overall gain and less recent decline, delivering the highest market performance over the past year per the provided data.
Target Prices
Here is the current analyst target price consensus for two regulated electric utilities.
| Company | Target High | Target Low | Consensus |
|---|---|---|---|
| DTE Energy Company | 157 | 138 | 148.29 |
| Alliant Energy Corporation | 78 | 65 | 73 |
Analysts expect DTE Energy’s stock to trade significantly above its current price of 129.89 USD, indicating upside potential. Alliant Energy’s consensus target is also notably higher than its current price of 65.02 USD, suggesting positive growth expectations.
Analyst Opinions Comparison
This section compares analysts’ ratings and grades for DTE Energy Company and Alliant Energy Corporation:
Rating Comparison
DTE Rating
- Rating: C, considered Very Favorable by analysts.
- Discounted Cash Flow Score: 1, rated Very Unfavorable.
- ROE Score: 3, rated Moderate.
- ROA Score: 2, rated Moderate.
- Debt To Equity Score: 1, rated Very Unfavorable.
- Overall Score: 2, rated Moderate.
LNT Rating
- Rating: C+, considered Very Favorable by analysts.
- Discounted Cash Flow Score: 3, rated Moderate.
- ROE Score: 1, rated Very Unfavorable.
- ROA Score: 4, rated Favorable.
- Debt To Equity Score: 1, rated Very Unfavorable.
- Overall Score: 2, rated Moderate.
Which one is the best rated?
Based strictly on the provided data, LNT holds a slightly higher rating (C+) compared to DTE’s C. LNT outperforms in discounted cash flow and ROA scores, while DTE scores better in ROE. Both share similar overall and debt-to-equity scores.
Scores Comparison
Here is a comparison of the financial health scores for DTE Energy Company and Alliant Energy Corporation:
DTE Scores
- Altman Z-Score: 1.03, in the distress zone indicating high bankruptcy risk.
- Piotroski Score: 7, indicating strong financial health.
LNT Scores
- Altman Z-Score: unavailable, no data provided.
- Piotroski Score: 5, indicating average financial strength.
Which company has the best scores?
Based on the available data, DTE has a lower Altman Z-Score indicating distress but a stronger Piotroski Score of 7 compared to LNT’s average score of 5. LNT’s Altman Z-Score is unavailable for comparison.
Grades Comparison
Here is a comparison of the latest grades assigned to DTE Energy Company and Alliant Energy Corporation by recognized grading firms:
DTE Energy Company Grades
The following table summarizes recent grade updates from established financial institutions for DTE Energy Company:
| Grading Company | Action | New Grade | Date |
|---|---|---|---|
| BMO Capital | Maintain | Market Perform | 2025-12-24 |
| UBS | Maintain | Buy | 2025-12-17 |
| JP Morgan | Maintain | Neutral | 2025-12-11 |
| Jefferies | Upgrade | Buy | 2025-12-11 |
| B of A Securities | Maintain | Buy | 2025-11-05 |
| Scotiabank | Maintain | Sector Perform | 2025-10-31 |
| Morgan Stanley | Maintain | Overweight | 2025-10-22 |
| Barclays | Maintain | Equal Weight | 2025-10-14 |
| UBS | Maintain | Buy | 2025-10-10 |
| Scotiabank | Downgrade | Sector Perform | 2025-10-03 |
The overall trend for DTE Energy Company shows a stable to slightly positive outlook with multiple buy ratings and few downgrades.
Alliant Energy Corporation Grades
The following table provides recent grade changes for Alliant Energy Corporation from credible grading companies:
| Grading Company | Action | New Grade | Date |
|---|---|---|---|
| Argus Research | Downgrade | Hold | 2026-01-09 |
| UBS | Maintain | Buy | 2025-12-17 |
| UBS | Upgrade | Buy | 2025-10-24 |
| B of A Securities | Maintain | Buy | 2025-10-17 |
| BMO Capital | Maintain | Market Perform | 2025-10-17 |
| Barclays | Maintain | Underweight | 2025-10-14 |
| UBS | Maintain | Neutral | 2025-10-10 |
| B of A Securities | Maintain | Buy | 2025-08-14 |
| BMO Capital | Maintain | Market Perform | 2025-08-11 |
| UBS | Maintain | Neutral | 2025-07-11 |
Alliant Energy Corporation presents a mixed picture with some buy ratings but also a recent downgrade and underweight rating, indicating cautious sentiment.
Which company has the best grades?
DTE Energy Company generally holds more consistent buy and overweight ratings compared to Alliant Energy Corporation, which shows a more mixed and slightly cautious grade profile. This may suggest relatively stronger analyst confidence in DTE’s prospects, potentially affecting investor sentiment and risk perception.
Strengths and Weaknesses
Below is a comparative table highlighting key strengths and weaknesses of DTE Energy Company and Alliant Energy Corporation based on their recent financial and operational data:
| Criterion | DTE Energy Company | Alliant Energy Corporation |
|---|---|---|
| Diversification | High: diversified across Electric (5.8B), Gas (1.75B), Energy Trading (4.6B), and DTE Vantage (0.8B) segments | Moderate: mainly Electric (3.37B) and Gas (465M) with smaller other utilities |
| Profitability | Moderate: Net margin 11.27%, ROE 12%, but ROIC below WACC indicating value destruction | Higher net margin 17.33% but lower ROE 9.85% and ROIC also below WACC |
| Innovation | Growing ROIC trend (+34%) suggests improving operational efficiency and innovation | ROIC trend neutral, indicating limited recent innovation impact |
| Global presence | Primarily US-focused with strong regional presence, no significant global footprint | Similar regional focus, limited global expansion |
| Market Share | Large market share in energy trading and electric utilities in core regions | Smaller market share, focused on regional utility markets |
Key takeaways: DTE shows stronger diversification and improving profitability trends despite currently destroying value, while Alliant Energy has better net margins but struggles with value creation and innovation. Both face challenges with ROIC below cost of capital, which warrants cautious investment consideration.
Risk Analysis
Below is a comparative table outlining key risks for DTE Energy Company and Alliant Energy Corporation based on the most recent 2024 data:
| Metric | DTE Energy Company | Alliant Energy Corporation |
|---|---|---|
| Market Risk | Moderate (Beta 0.48, stable utility sector) | Moderate (Beta 0.67, slightly higher volatility) |
| Debt Level | High (Debt-to-Equity 1.99, interest coverage moderate at 2.44) | High (Debt-to-Equity 1.49, interest coverage moderate at 2.28) |
| Regulatory Risk | Elevated (Utility sector heavily regulated, environmental compliance required) | Elevated (Regulated electric utility, subject to evolving regulations) |
| Operational Risk | Moderate (Aging infrastructure, asset turnover low) | Moderate (Low asset turnover, operational complexity with multiple subsidiaries) |
| Environmental Risk | Significant (Fossil fuels & nuclear generation exposure, transition risks) | Moderate (Increasing renewable investments but still natural gas reliance) |
| Geopolitical Risk | Low (Primarily domestic US operations) | Low (Primarily domestic US operations) |
In synthesis, both companies face significant regulatory and debt-related risks typical of regulated utilities. DTE’s exposure to fossil fuels and nuclear power presents notable environmental transition risks, while Alliant is moderately exposed but advancing renewables. Debt levels and low liquidity ratios suggest financial caution. Market risk remains moderate given the defensive nature of utilities. I advise closely monitoring regulatory changes and environmental policies, as these are the most likely and impactful risks for these investments in 2026.
Which Stock to Choose?
DTE Energy Company shows a mixed income evolution with a slight revenue decline recently but an overall favorable gross and EBIT margin. Its financial ratios reveal a slightly unfavorable profile due to weak liquidity and efficiency, despite a decent net margin and stable dividend yield. The company carries significant debt and is rated very favorably overall.
Alliant Energy Corporation displays stronger income margins but faces unfavorable trends in net margin and earnings per share growth. Its financial ratios are also slightly unfavorable, with concerns on debt and liquidity, though it maintains a favorable dividend yield. The company’s rating is very favorable but with notable weaknesses in return on equity and price-to-book metrics.
For investors, the choice might depend on risk tolerance and investment goals: those seeking stable dividend income with moderate profitability may find DTE’s profile more suitable, while investors focused on growth and higher margins might see Alliant Energy as a potential option, despite its value-destroying moat status. Both companies exhibit slightly unfavorable financial and income evaluations, suggesting cautious consideration.
Disclaimer: Investment carries a risk of loss of initial capital. The past performance is not a reliable indicator of future results. Be sure to understand risks before making an investment decision.
Go Further
I encourage you to read the complete analyses of DTE Energy Company and Alliant Energy Corporation to enhance your investment decisions: