Dominion Energy, Inc. and Alliant Energy Corporation are two prominent players in the regulated electric utility sector, each serving millions of customers across multiple states. Both companies focus on delivering reliable energy while advancing innovation in renewable sources and infrastructure. Given their market overlap and strategic approaches, comparing these utilities offers valuable insights. In this article, I will help you determine which company stands out as the more compelling investment opportunity.
Table of contents
Companies Overview
I will begin the comparison between Dominion Energy, Inc. and Alliant Energy Corporation by providing an overview of these two companies and their main differences.
Dominion Energy Overview
Dominion Energy, Inc. is a leading energy producer and distributor in the US, focused on regulated electric and natural gas services. It operates through four segments serving millions of customers in Virginia, North Carolina, South Carolina, and other states. Dominion’s portfolio includes 30.2GW of electric capacity and extensive transmission and distribution infrastructure, emphasizing regulated electricity and gas sales alongside renewable energy development.
Alliant Energy Overview
Alliant Energy Corporation operates as a utility holding company providing regulated electricity and natural gas services primarily in Iowa and Wisconsin. It serves over 1.4 million retail customers across its subsidiaries and supports diverse industries such as agriculture and manufacturing. Alliant also holds interests in natural gas-fired and wind power generation assets and operates freight and logistics services alongside its core utility operations.
Key similarities and differences
Both companies operate in the regulated electric utility sector, focusing on electricity and natural gas distribution with a strong regional presence in the US. Dominion Energy has a broader geographic footprint and larger asset base, while Alliant Energy combines utility services with freight and logistics operations. Both emphasize regulated services but differ in scale, with Dominion serving more customers and managing more extensive infrastructure.
Income Statement Comparison
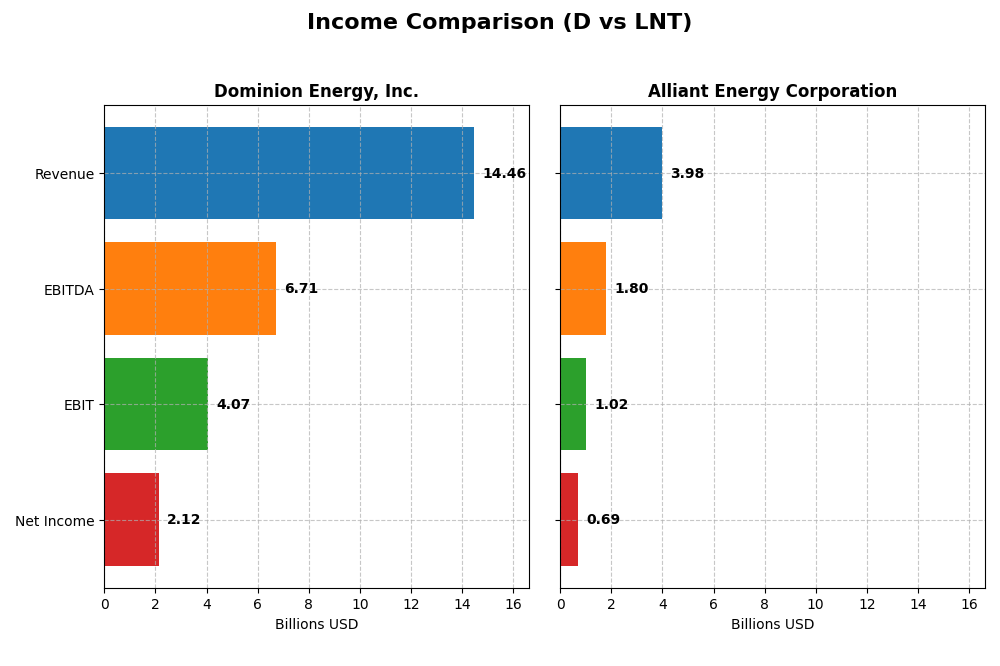
The following table presents a side-by-side comparison of key income statement metrics for Dominion Energy, Inc. and Alliant Energy Corporation for the fiscal year 2024.
| Metric | Dominion Energy, Inc. | Alliant Energy Corporation |
|---|---|---|
| Market Cap | 49.5B | 16.7B |
| Revenue | 14.46B | 3.98B |
| EBITDA | 6.71B | 1.80B |
| EBIT | 4.07B | 1.03B |
| Net Income | 2.12B | 690M |
| EPS | 2.44 | 2.69 |
| Fiscal Year | 2024 | 2024 |
Income Statement Interpretations
Dominion Energy, Inc.
Dominion Energy’s revenue showed modest growth of 2.03% over 2020-2024, with net income rising significantly by 630%. Gross margin remained strong at 47.87%, and net margin improved to 14.69%. In 2024, revenue growth slowed to 0.46%, but EBIT increased 10.15%, reflecting better operational efficiency despite slightly higher interest expenses.
Alliant Energy Corporation
Alliant Energy’s revenue grew 16.54% from 2020 to 2024, while net income increased by 10.58%. Gross margin stood at 44.71%, with a net margin of 17.33%. However, in 2024, revenue declined by 1.14%, EBIT dropped 6.9%, and net margin slightly contracted, indicating some recent operational challenges affecting profitability.
Which one has the stronger fundamentals?
Dominion Energy exhibits stronger fundamentals with favorable trends in net income growth, margin improvements, and EBIT expansion despite slower revenue growth and higher interest costs. Conversely, Alliant Energy’s solid revenue growth is offset by recent declines in EBIT and net margin, leading to a less favorable overall income statement evaluation.
Financial Ratios Comparison
The table below presents a side-by-side comparison of key financial ratios for Dominion Energy, Inc. (D) and Alliant Energy Corporation (LNT) based on their 2024 fiscal year-end data.
| Ratios | Dominion Energy, Inc. (D) | Alliant Energy Corporation (LNT) |
|---|---|---|
| ROE | 7.79% | 9.85% |
| ROIC | 2.86% | 4.88% |
| P/E | 21.28 | 21.98 |
| P/B | 1.66 | 2.17 |
| Current Ratio | 0.71 | 0.44 |
| Quick Ratio | 0.52 | 0.33 |
| D/E | 1.53 | 1.49 |
| Debt-to-Assets | 40.77% | 45.81% |
| Interest Coverage | 1.72 | 1.97 |
| Asset Turnover | 0.14 | 0.18 |
| Fixed Asset Turnover | 0.21 | 0.21 |
| Payout Ratio | 105.41% | 71.30% |
| Dividend Yield | 4.95% | 3.24% |
Interpretation of the Ratios
Dominion Energy, Inc.
Dominion Energy shows a mixed ratio profile with a strong net margin of 14.69% and favorable dividend yield at 4.95%. However, its return on equity (7.79%) and return on invested capital (2.86%) are weak, alongside liquidity concerns with a current ratio of 0.71. Dividend payments appear sustainable but free cash flow is negative, signaling potential distribution risks.
Alliant Energy Corporation
Alliant Energy reports a healthier net margin of 17.33% and a solid dividend yield of 3.24%. Despite this, its return on equity (9.85%) and return on invested capital (4.88%) remain below ideal levels. Liquidity ratios are low, with a current ratio of 0.44. Dividend coverage is likely supported but negative free cash flow may pose challenges over time.
Which one has the best ratios?
Both companies share a similar ratio distribution: 21.43% favorable, 50% unfavorable, and 28.57% neutral, resulting in a slightly unfavorable global outlook. Dominion Energy benefits from a higher dividend yield but shows weaker returns and liquidity. Alliant Energy has better profitability ratios but faces more pronounced liquidity issues. Neither stands out decisively.
Strategic Positioning
This section compares the strategic positioning of Dominion Energy, Inc. and Alliant Energy Corporation, including market position, key segments, and exposure to technological disruption:
Dominion Energy, Inc.
- Large market cap of 49.5B with diversified regulated electric and gas operations across multiple states facing moderate competitive pressure.
- Key segments include Dominion Energy Virginia, Gas Distribution, South Carolina operations, and Contracted Energy driving diversified revenue streams.
- Exposure to technological disruption includes nonregulated renewable natural gas and solar generation, plus LNG and gas infrastructure development.
Alliant Energy Corporation
- Smaller market cap of 16.7B focused on regulated electric and gas utilities mainly in Iowa and Wisconsin with moderate competitive pressure.
- Key segments are Utility Electric, Gas Operations, and Other Utility services with focus on retail and wholesale electricity and gas.
- Limited explicit exposure; owns wind farm and natural gas generation but no detailed renewable energy diversification stated.
Dominion Energy, Inc. vs Alliant Energy Corporation Positioning
Dominion Energy’s strategy is more diversified geographically and across energy types, leveraging large-scale regulated electric and gas assets. Alliant Energy is more concentrated regionally with focused electric and gas utility services. Dominion’s broader asset base may present complexity, while Alliant’s narrower focus could limit growth avenues.
Which has the best competitive advantage?
Both companies are currently shedding value as ROIC is below WACC. Dominion shows a growing ROIC trend but remains slightly unfavorable, while Alliant’s ROIC is stable but unfavorable, indicating neither holds a strong competitive moat at this time.
Stock Comparison
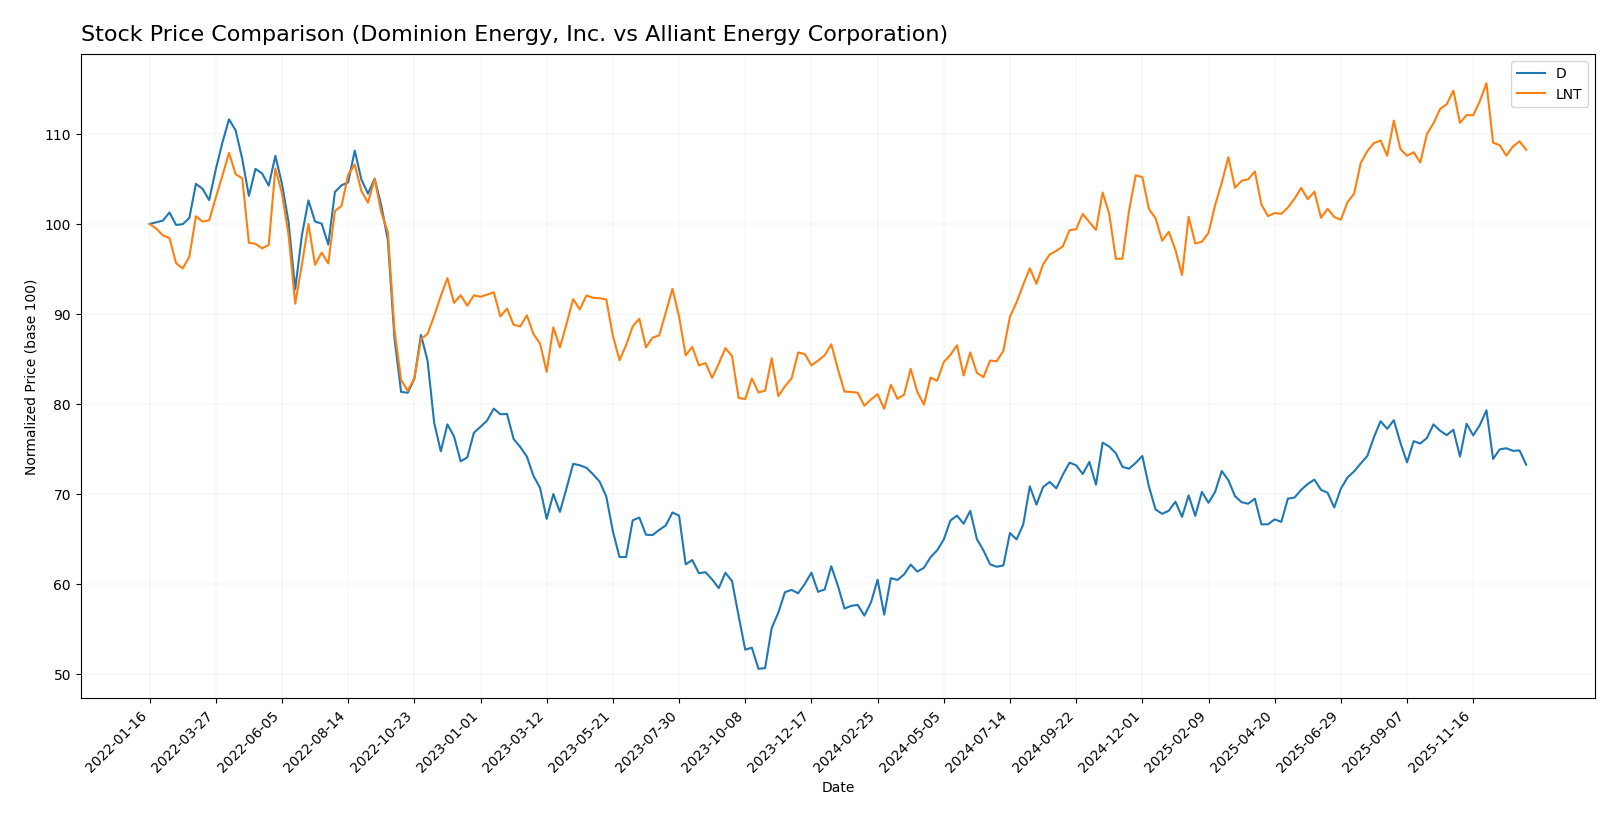
The stock prices of Dominion Energy, Inc. and Alliant Energy Corporation exhibited significant bullish trends over the past year, with both showing deceleration in upward momentum and recent downward adjustments in trading dynamics.
Trend Analysis
Dominion Energy, Inc. recorded a 26.43% price increase over the past 12 months, indicating a bullish trend with decelerating momentum. The stock reached a high of 62.77 and a low of 44.79, with moderate volatility at 4.03 standard deviation.
Alliant Energy Corporation showed a stronger bullish trend with a 34.48% gain over the same period, also experiencing deceleration. Its price fluctuated between 47.73 and 69.47, with higher volatility at 5.9 standard deviation.
Comparing both, Alliant Energy delivered the highest market performance with a 34.48% increase, outperforming Dominion Energy’s 26.43% gain over the past year.
Target Prices
Analysts present a positive consensus on target prices for Dominion Energy, Inc. and Alliant Energy Corporation, indicating potential upside from current levels.
| Company | Target High | Target Low | Consensus |
|---|---|---|---|
| Dominion Energy, Inc. | 70 | 63 | 66 |
| Alliant Energy Corporation | 78 | 65 | 73 |
The target consensus for Dominion Energy at 66 suggests a moderate upside from the current price of 57.98 USD. Alliant Energy’s consensus target at 73 indicates a stronger potential gain compared to its current 65.02 USD price, reflecting generally optimistic analyst expectations.
Analyst Opinions Comparison
This section compares analysts’ ratings and grades for Dominion Energy, Inc. (D) and Alliant Energy Corporation (LNT):
Rating Comparison
D Rating
- Rating: C+, classified as Very Favorable by analysts.
- Discounted Cash Flow Score: 4, considered Favorable.
- ROE Score: 3, interpreted as Moderate efficiency generating profits.
- ROA Score: 1, rated Very Unfavorable for asset utilization.
- Debt To Equity Score: 3, Moderate financial risk.
- Overall Score: 2, reflecting a Moderate overall rating.
LNT Rating
- Rating: C+, also classified as Very Favorable by analysts.
- Discounted Cash Flow Score: 3, considered Moderate.
- ROE Score: 1, seen as Very Unfavorable in profit generation.
- ROA Score: 4, rated Favorable for effective asset use.
- Debt To Equity Score: 1, Very Unfavorable due to higher risk.
- Overall Score: 2, also reflecting a Moderate overall rating.
Which one is the best rated?
Both D and LNT share the same overall rating of C+ and an overall score of 2, indicating moderate financial standing. D shows stronger discounted cash flow and ROE scores, while LNT excels in ROA but has higher financial risk, making them equivalently rated based on the provided data.
Scores Comparison
Here is the comparison of the financial scores for Dominion Energy, Inc. and Alliant Energy Corporation:
Dominion Energy, Inc. Scores
- Altman Z-Score: Unavailable, no data provided.
- Piotroski Score: 7, indicating strong financial health.
Alliant Energy Corporation Scores
- Altman Z-Score: Unavailable, no data provided.
- Piotroski Score: 5, indicating average financial health.
Which company has the best scores?
Based on the available data, Dominion Energy, Inc. has a stronger Piotroski Score of 7 compared to Alliant Energy Corporation’s 5. Both companies lack Altman Z-Score data for further comparison.
Grades Comparison
Here is a detailed comparison of the grades assigned to Dominion Energy, Inc. and Alliant Energy Corporation by reputable grading companies:
Dominion Energy, Inc. Grades
The following table summarizes recent grades and ratings for Dominion Energy from established financial institutions:
| Grading Company | Action | New Grade | Date |
|---|---|---|---|
| Barclays | Maintain | Overweight | 2025-12-17 |
| JP Morgan | Maintain | Underweight | 2025-12-11 |
| BMO Capital | Maintain | Market Perform | 2025-11-03 |
| Morgan Stanley | Maintain | Equal Weight | 2025-10-22 |
| Barclays | Maintain | Overweight | 2025-10-07 |
| Morgan Stanley | Maintain | Equal Weight | 2025-09-25 |
| JP Morgan | Maintain | Underweight | 2025-08-21 |
| JP Morgan | Maintain | Underweight | 2025-07-15 |
| Morgan Stanley | Maintain | Equal Weight | 2025-06-18 |
| Morgan Stanley | Maintain | Equal Weight | 2025-05-22 |
Dominion Energy’s grades predominantly range between Hold (Market Perform/Equal Weight) and Underweight, with occasional Overweight ratings, indicating a mixed but generally cautious outlook.
Alliant Energy Corporation Grades
Below is the table summarizing recent ratings for Alliant Energy by recognized grading companies:
| Grading Company | Action | New Grade | Date |
|---|---|---|---|
| Argus Research | Downgrade | Hold | 2026-01-09 |
| UBS | Maintain | Buy | 2025-12-17 |
| UBS | Upgrade | Buy | 2025-10-24 |
| B of A Securities | Maintain | Buy | 2025-10-17 |
| BMO Capital | Maintain | Market Perform | 2025-10-17 |
| Barclays | Maintain | Underweight | 2025-10-14 |
| UBS | Maintain | Neutral | 2025-10-10 |
| B of A Securities | Maintain | Buy | 2025-08-14 |
| BMO Capital | Maintain | Market Perform | 2025-08-11 |
| UBS | Maintain | Neutral | 2025-07-11 |
Alliant Energy shows a tendency toward Buy ratings, with some Hold and Neutral grades, reflecting a relatively more positive consensus than Dominion Energy.
Which company has the best grades?
Alliant Energy Corporation generally receives better grades, with a stronger consensus toward Buy compared to Dominion Energy’s Hold consensus. This may suggest more favorable analyst sentiment for Alliant Energy, potentially affecting investor perceptions and portfolio positioning accordingly.
Strengths and Weaknesses
Below is a comparative table summarizing key strengths and weaknesses of Dominion Energy, Inc. (D) and Alliant Energy Corporation (LNT) based on their recent performance and financial metrics.
| Criterion | Dominion Energy, Inc. (D) | Alliant Energy Corporation (LNT) |
|---|---|---|
| Diversification | Moderate, with revenues from Virginia, South Carolina, and contracted energy segments | Moderate, mainly electric and gas utilities with smaller other segments |
| Profitability | Net margin favorable at 14.69%, but ROIC (2.86%) below WACC (5.34%), indicating value destruction | Net margin favorable at 17.33%, ROIC (4.88%) below WACC (5.91%), also shedding value |
| Innovation | Growing ROIC trend (+30.5%) suggests improving operational efficiency | ROIC trend neutral (+0.8%), indicating stable but limited innovation impact |
| Global presence | Regional U.S. focus, mainly Virginia and South Carolina markets | Regional U.S. focus, primarily Midwest utilities |
| Market Share | Strong presence in Virginia with $10.2B revenue segment | Solid regional footprint with $3.37B electric revenue |
Key takeaways: Both companies show favorable net margins but are currently destroying value as ROIC remains below WACC. Dominion Energy’s improving ROIC trend indicates potential for future value creation, while Alliant Energy’s stable ROIC suggests steady but unspectacular performance. Investors should weigh growth prospects against current inefficiencies.
Risk Analysis
Below is a summary table of key risks for Dominion Energy, Inc. (D) and Alliant Energy Corporation (LNT) based on the most recent 2024 data:
| Metric | Dominion Energy, Inc. (D) | Alliant Energy Corporation (LNT) |
|---|---|---|
| Market Risk | Moderate (Beta 0.70) | Moderate (Beta 0.67) |
| Debt level | High (D/E 1.53, Neutral debt-to-assets 40.8%) | High (D/E 1.49, Neutral debt-to-assets 45.8%) |
| Regulatory Risk | Elevated (Utilities sector heavily regulated) | Elevated (Utilities sector heavily regulated) |
| Operational Risk | Moderate (Aging infrastructure, extensive grid) | Moderate (Smaller scale, but diverse operations) |
| Environmental Risk | Significant (Transition to renewables ongoing) | Significant (Renewables and fossil fuel mix) |
| Geopolitical Risk | Low (Primarily US-focused) | Low (Primarily US-focused) |
Dominion and Alliant face the most impactful risks from regulatory changes and high leverage, common in regulated utilities. Both have moderately unfavorable liquidity ratios and rely on heavy capital investments, increasing operational and debt-servicing risks. Environmental transition pressures remain significant but manageable given their renewable initiatives. Market volatility is moderate due to stable demand but sensitive to policy shifts.
Which Stock to Choose?
Dominion Energy, Inc. shows a slightly unfavorable global ratios evaluation with 50% unfavorable metrics, despite favorable net margin and dividend yield. Its income statement is favorable, reflecting strong net income growth, though debt and liquidity ratios remain concerns. The company exhibits a slightly unfavorable moat, indicating value destruction but improving profitability, and holds a very favorable rating with moderate overall scores.
Alliant Energy Corporation shares a slightly unfavorable ratios profile similar in unfavorable metrics proportion, with better net margin and return on assets but weaker return on equity and debt metrics. Its income statement is globally unfavorable due to recent declines despite overall revenue growth. The company’s moat is unfavorable, reflecting stable profitability but value destruction, and it carries a very favorable rating with mixed score evaluations.
For investors prioritizing growth and income stability, Dominion Energy’s improving profitability and favorable income trends might appear more attractive. Conversely, those valuing asset efficiency and moderate returns could find Alliant Energy’s stable profitability and slightly higher return on assets more aligned with their profile. The choice could depend on the investor’s risk tolerance and investment strategy.
Disclaimer: Investment carries a risk of loss of initial capital. The past performance is not a reliable indicator of future results. Be sure to understand risks before making an investment decision.
Go Further
I encourage you to read the complete analyses of Dominion Energy, Inc. and Alliant Energy Corporation to enhance your investment decisions: