In the evolving utilities landscape, Consolidated Edison, Inc. (ED) and Alliant Energy Corporation (LNT) stand out as established players in regulated electric services. Both companies serve significant customer bases in the U.S. and pursue innovation through renewable energy projects and infrastructure investments. This comparison highlights their market positions and growth strategies to help you identify which company is the more compelling addition to your investment portfolio. Let’s explore their potential together.
Table of contents
Companies Overview
I will begin the comparison between Consolidated Edison, Inc. and Alliant Energy Corporation by providing an overview of these two companies and their main differences.
Consolidated Edison, Inc. Overview
Consolidated Edison, Inc. operates in the regulated electric, gas, and steam delivery sectors primarily in New York and parts of New Jersey. It serves approximately 3.5M electric, 1.1M gas, and 1,555 steam customers. The company also develops renewable energy projects and invests in transmission infrastructure, positioning itself as a comprehensive energy provider with a long history dating back to 1823.
Alliant Energy Corporation Overview
Alliant Energy Corporation is a utility holding company providing regulated electric and natural gas services mainly in Iowa and Wisconsin. It serves around 985K electric and 425K gas retail customers through subsidiaries IPL and WPL, focusing on generation, distribution, and wholesale sales. The company also operates freight services and holds interests in natural gas and wind power generation assets, highlighting a diversified utility portfolio.
Key similarities and differences
Both companies operate regulated electric utilities with natural gas services and have diversified energy portfolios incorporating renewable assets. However, Con Edison has a larger customer base concentrated in New York City and a notable steam delivery segment, while Alliant Energy’s operations span multiple states with additional freight logistics businesses. Consolidated Edison also has a significantly higher market capitalization and employee count compared to Alliant Energy.
Income Statement Comparison
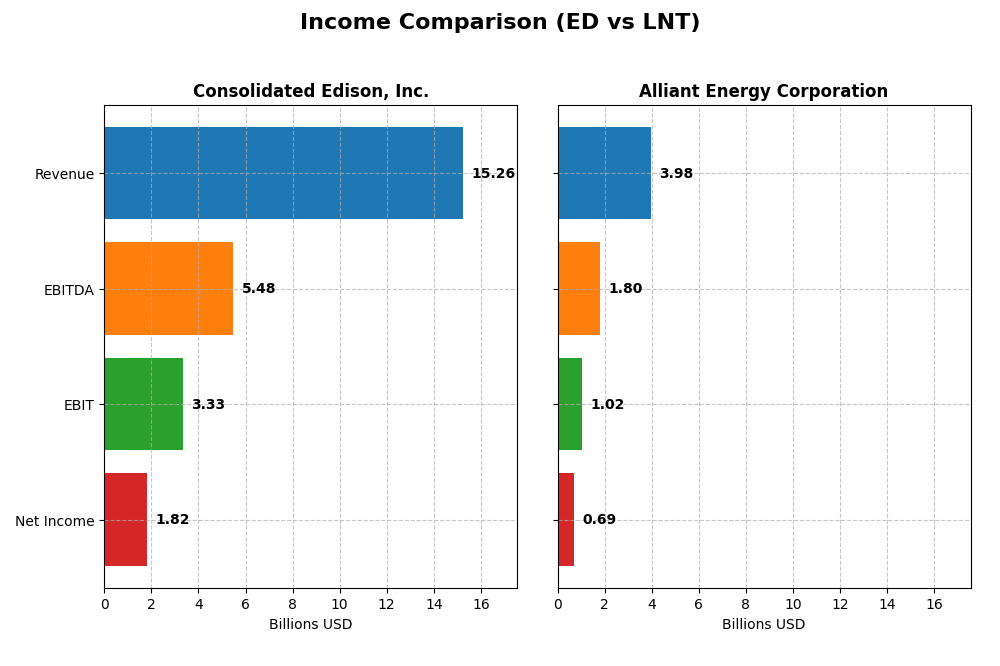
The following table presents a side-by-side comparison of key income statement figures for Consolidated Edison, Inc. (ED) and Alliant Energy Corporation (LNT) for the fiscal year 2024.
| Metric | Consolidated Edison, Inc. (ED) | Alliant Energy Corporation (LNT) |
|---|---|---|
| Market Cap | 35.8B | 16.7B |
| Revenue | 15.3B | 4.0B |
| EBITDA | 5.5B | 1.8B |
| EBIT | 3.3B | 1.0B |
| Net Income | 1.8B | 690M |
| EPS | 5.26 | 2.69 |
| Fiscal Year | 2024 | 2024 |
Income Statement Interpretations
Consolidated Edison, Inc.
Consolidated Edison displayed revenue growth of 24.65% and net income growth of 65.3% over 2020-2024, with favorable gross and net margins near 64% and 12%, respectively. However, in 2024, growth slowed with a 4.16% revenue rise but net income fell 27.32%, alongside a 17.51% drop in EBIT and a 30.64% net margin contraction, indicating margin pressure despite stable interest expenses.
Alliant Energy Corporation
Alliant Energy’s revenue increased 16.54% and net income 10.58% over the five-year span, supported by a solid 17.33% net margin and 25.75% EBIT margin. The 2024 fiscal year showed a slight revenue decline of 1.14%, EBIT decreased 6.9%, and net margin dipped 0.72%, reflecting modest margin erosion and unfavorable interest expense ratios, though gross profit held steady with marginal growth.
Which one has the stronger fundamentals?
Consolidated Edison exhibits stronger fundamentals with higher overall revenue and net income growth, accompanied by favorable margin improvements over the period, despite recent earnings softness. In contrast, Alliant Energy faces margin and revenue declines recently and a less favorable interest expense profile. The global income statement evaluation favors Consolidated Edison, suggesting more robust earnings quality and growth potential.
Financial Ratios Comparison
The table below presents a side-by-side comparison of key financial ratios for Consolidated Edison, Inc. (ED) and Alliant Energy Corporation (LNT) based on their most recent fiscal year 2024 data.
| Ratios | Consolidated Edison, Inc. (ED) | Alliant Energy Corporation (LNT) |
|---|---|---|
| ROE | 8.29% | 9.85% |
| ROIC | 3.48% | 4.88% |
| P/E | 16.96 | 21.98 |
| P/B | 1.41 | 2.17 |
| Current Ratio | 1.04 | 0.44 |
| Quick Ratio | 0.96 | 0.33 |
| D/E (Debt-to-Equity) | 1.27 | 1.49 |
| Debt-to-Assets | 39.4% | 45.8% |
| Interest Coverage | 2.30 | 1.97 |
| Asset Turnover | 0.22 | 0.18 |
| Fixed Asset Turnover | 0.29 | 0.21 |
| Payout Ratio | 60.4% | 71.3% |
| Dividend Yield | 3.56% | 3.24% |
Interpretation of the Ratios
Consolidated Edison, Inc.
Consolidated Edison shows a mixed ratio profile with favorable net margin (11.93%) and dividend yield (3.56%), but weaker returns on equity (8.29%) and invested capital (3.48%). The debt-to-equity ratio is somewhat high at 1.27, and asset turnover ratios are low, indicating operational efficiency challenges. The company maintains a steady dividend supported by a moderate payout ratio, but free cash flow coverage is negative, suggesting caution around sustainability.
Alliant Energy Corporation
Alliant Energy’s ratios also display a mixed picture with a stronger net margin (17.33%) but similarly unfavorable returns on equity (9.85%) and invested capital (4.88%). Liquidity ratios are weak, with current and quick ratios below 0.5, raising concerns about short-term financial flexibility. The dividend yield is solid at 3.24%, yet free cash flow trends are negative, indicating potential risks in maintaining shareholder returns without stretching financial resources.
Which one has the best ratios?
Both companies have slightly unfavorable overall ratio evaluations due to high leverage and modest returns on capital. Consolidated Edison exhibits better liquidity and dividend yield, while Alliant Energy shows a higher net margin but weaker liquidity. Each presents trade-offs between operational efficiency, financial stability, and shareholder returns, with neither clearly outperforming the other across all key metrics.
Strategic Positioning
This section compares the strategic positioning of Consolidated Edison, Inc. (ED) and Alliant Energy Corporation (LNT), focusing on market position, key segments, and exposure to technological disruption:
Consolidated Edison, Inc. (ED)
- Leading regulated electric utility with a large customer base in New York City; faces typical regulated market competition.
- Key segments include electricity, oil and gas purchased, steam, and non-utility products and services.
- Exposure to technological disruption is limited, focusing on traditional utility infrastructure and renewable projects.
Alliant Energy Corporation (LNT)
- Regional utility holding company serving Iowa and Wisconsin with retail and wholesale customers; operates freight services.
- Operates through electric, gas, and other utility segments, with interests in wind and gas-fired generation assets.
- Moderate exposure through renewable assets like wind farms and natural gas generation; diversified utility operations.
Consolidated Edison, Inc. (ED) vs Alliant Energy Corporation (LNT) Positioning
ED has a diversified portfolio including electricity, gas, steam, and energy services, while LNT concentrates on regulated electric and gas with additional freight operations. ED’s broader operations contrast with LNT’s regional and segment-focused business model.
Which has the best competitive advantage?
Both companies are currently shedding value with ROIC below WACC; however, LNT shows stable profitability with a neutral ROIC trend, whereas ED’s profitability is declining, indicating LNT may have a relatively stronger but still unfavorable competitive position.
Stock Comparison
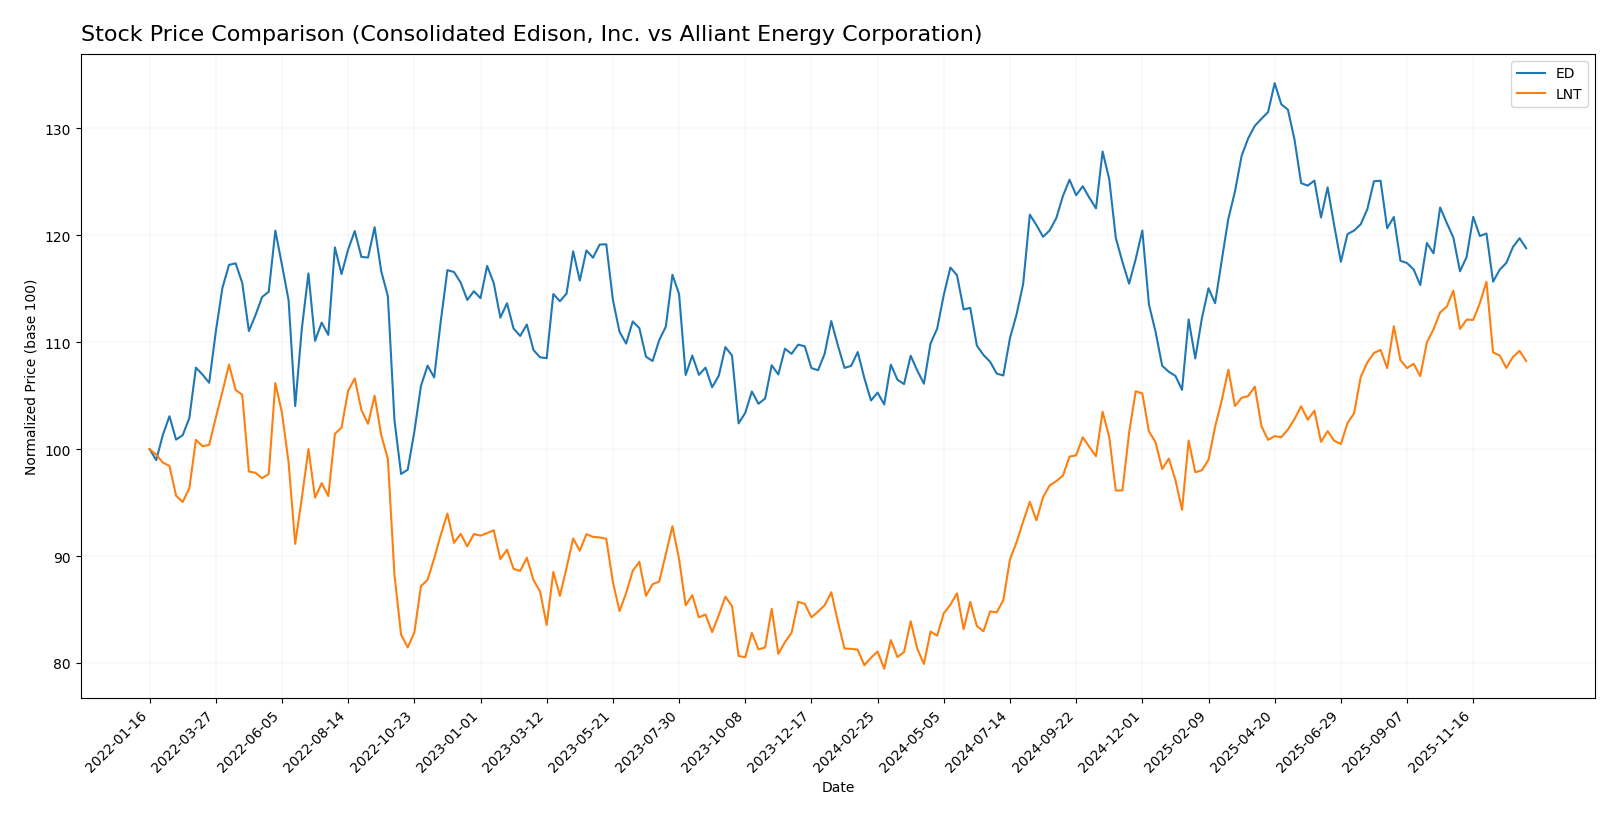
The stock price movements over the past year reveal distinct bullish trends for both Consolidated Edison, Inc. and Alliant Energy Corporation, with notable deceleration in price momentum and varied recent trading dynamics.
Trend Analysis
Consolidated Edison, Inc. (ED) experienced a 13.62% price increase over the past 12 months, indicating a bullish trend with deceleration in acceleration and a standard deviation of 6.0. The stock ranged between 87.01 and 112.1.
Alliant Energy Corporation (LNT) showed a stronger bullish trend with a 34.48% rise over the same period, also with deceleration and a 5.9 standard deviation. Its price fluctuated from 47.73 to 69.47.
Comparing recent trends, ED showed a slight negative change of -0.83% while LNT declined by -5.73%. Overall, LNT delivered the highest market performance over the past year.
Target Prices
The current target price consensus for Consolidated Edison, Inc. and Alliant Energy Corporation shows moderate upside potential.
| Company | Target High | Target Low | Consensus |
|---|---|---|---|
| Consolidated Edison, Inc. | 106 | 86 | 99.86 |
| Alliant Energy Corporation | 78 | 65 | 73 |
Analysts expect Consolidated Edison’s stock to trade slightly above its current price of 99.21 USD, while Alliant Energy’s consensus target of 73 USD suggests a notable upside from its current 65.02 USD.
Analyst Opinions Comparison
This section compares analysts’ ratings and grades for Consolidated Edison, Inc. (ED) and Alliant Energy Corporation (LNT):
Rating Comparison
ED Rating
- Rating: B-, classified as Very Favorable by analysts.
- Discounted Cash Flow Score: 1, considered Very Unfavorable, indicating concerns on valuation.
- ROE Score: 3, Moderate efficiency in generating profits from shareholders’ equity.
- ROA Score: 3, Moderate asset utilization effectiveness.
- Debt To Equity Score: 2, Moderate financial risk due to debt levels.
- Overall Score: 2, Moderate overall financial standing.
LNT Rating
- Rating: C+, also classified as Very Favorable.
- Discounted Cash Flow Score: 3, Moderate status, suggesting better valuation outlook.
- ROE Score: 1, Very Unfavorable, indicating low efficiency in profit generation.
- ROA Score: 4, Favorable, showing strong asset utilization.
- Debt To Equity Score: 1, Very Unfavorable, higher financial risk from debt reliance.
- Overall Score: 2, Moderate overall financial standing.
Which one is the best rated?
Both ED and LNT share the same overall score of 2, indicating moderate financial standing. ED holds a higher rating grade (B- vs. C+) and stronger ROE and debt-to-equity scores, while LNT excels in discounted cash flow and ROA scores.
Scores Comparison
Here is the comparison of the Altman Z-Score and Piotroski Score for the two companies:
Consolidated Edison, Inc. Scores
- Altman Z-Score: 1.19, in distress zone, high bankruptcy risk
- Piotroski Score: 7, strong financial strength
Alliant Energy Corporation Scores
- Altman Z-Score: unavailable, no data provided
- Piotroski Score: 5, average financial strength
Which company has the best scores?
Based on the available data, Consolidated Edison shows a strong Piotroski score but is in financial distress per Altman Z-Score. Alliant Energy has only an average Piotroski score and no Altman data. Thus, Consolidated Edison presents stronger financial health by Piotroski but higher bankruptcy risk by Altman.
Grades Comparison
The following tables summarize the latest available grades from reputable grading companies for the two utilities:
Consolidated Edison, Inc. Grades
This table shows recent grades issued by well-known financial firms for Consolidated Edison, Inc.:
| Grading Company | Action | New Grade | Date |
|---|---|---|---|
| UBS | Maintain | Neutral | 2026-01-07 |
| UBS | Maintain | Neutral | 2025-12-17 |
| Keybanc | Maintain | Underweight | 2025-12-12 |
| JP Morgan | Maintain | Underweight | 2025-12-12 |
| Barclays | Maintain | Underweight | 2025-11-10 |
| Barclays | Maintain | Underweight | 2025-10-22 |
| Morgan Stanley | Maintain | Underweight | 2025-10-22 |
| Barclays | Maintain | Underweight | 2025-10-21 |
| Keybanc | Maintain | Underweight | 2025-10-15 |
| Morgan Stanley | Maintain | Underweight | 2025-09-25 |
Grades for Consolidated Edison primarily range from Neutral to Underweight, with no upgrades or positive rating changes recently.
Alliant Energy Corporation Grades
This table presents recent grades from recognized grading firms for Alliant Energy Corporation:
| Grading Company | Action | New Grade | Date |
|---|---|---|---|
| Argus Research | Downgrade | Hold | 2026-01-09 |
| UBS | Maintain | Buy | 2025-12-17 |
| UBS | Upgrade | Buy | 2025-10-24 |
| B of A Securities | Maintain | Buy | 2025-10-17 |
| BMO Capital | Maintain | Market Perform | 2025-10-17 |
| Barclays | Maintain | Underweight | 2025-10-14 |
| UBS | Maintain | Neutral | 2025-10-10 |
| B of A Securities | Maintain | Buy | 2025-08-14 |
| BMO Capital | Maintain | Market Perform | 2025-08-11 |
| UBS | Maintain | Neutral | 2025-07-11 |
Grades for Alliant Energy show a majority of Buy and Market Perform ratings, with some recent downgrades and holds.
Overall, Consolidated Edison’s ratings tend toward caution with mostly Underweight and Neutral grades, while Alliant Energy’s grades lean more positively with multiple Buy ratings, despite a recent downgrade.
Which company has the best grades?
Alliant Energy Corporation has received generally better grades, with a larger number of Buy ratings compared to Consolidated Edison’s Hold consensus and Underweight grades. This suggests investors might perceive Alliant Energy as having more favorable prospects, potentially impacting portfolio positioning.
Strengths and Weaknesses
Below is a comparative overview of the strengths and weaknesses of Consolidated Edison, Inc. (ED) and Alliant Energy Corporation (LNT) based on recent financial and operational data.
| Criterion | Consolidated Edison, Inc. (ED) | Alliant Energy Corporation (LNT) |
|---|---|---|
| Diversification | Moderate: Revenue from Electricity (10.8B), Oil & Gas (3.1B), Steam (569M) | Limited: Primarily Electric (3.37B) with smaller Gas (465M) and Other Utility segments |
| Profitability | Net margin 11.93% (favorable), ROIC 3.48% (unfavorable), declining ROIC trend, value destroying | Net margin 17.33% (favorable), ROIC 4.88% (unfavorable), stable ROIC, value destroying |
| Innovation | Neutral: Limited data on innovation, traditional utility focus | Neutral: Similar utility focus, no major innovation indicators |
| Global presence | Primarily US-based utility operations | Primarily US-based utility operations |
| Market Share | Large regional utility with established customer base | Mid-sized regional utility with steady market presence |
Key takeaways: Both ED and LNT operate mainly in US utility markets with traditional business models. ED shows more diversification in energy sources but suffers from declining returns on invested capital, indicating value destruction. LNT displays higher profitability margins and stable returns but also destroys value over time. Investors should weigh the risk of value erosion against stable utility revenues in these companies.
Risk Analysis
Below is a comparison table highlighting key risk factors for Consolidated Edison, Inc. (ED) and Alliant Energy Corporation (LNT) based on the most recent data from 2024.
| Metric | Consolidated Edison, Inc. (ED) | Alliant Energy Corporation (LNT) |
|---|---|---|
| Market Risk | Low beta (0.38) indicates lower volatility versus market | Moderate beta (0.67) suggests moderate market sensitivity |
| Debt level | Debt/Equity 1.27 (unfavorable), Interest Coverage 2.8 (neutral) | Debt/Equity 1.49 (unfavorable), Interest Coverage 2.28 (neutral) |
| Regulatory Risk | High – operates in heavily regulated NY market | High – regulated utility with multi-state operations |
| Operational Risk | Large infrastructure network with aging assets | Diverse operations including rail freight increase complexity |
| Environmental Risk | Moderate – investments in renewables but legacy fossil assets | Moderate – owns gas-fired and wind generation assets |
| Geopolitical Risk | Low – primarily US operations in stable jurisdiction | Low – US Midwest focus with limited exposure |
The most impactful risks for both utilities are regulatory pressures and debt levels, with ED showing slightly better interest coverage but still carrying significant leverage. Market risk is relatively moderate due to low betas, but operational and environmental risks are noteworthy given infrastructure demands and energy transition pressures. Investors should weigh these risks carefully alongside dividend yields and financial strength.
Which Stock to Choose?
Consolidated Edison, Inc. (ED) shows a favorable income statement with 57% positive indicators including strong gross and net margins, despite recent declines in EPS and EBIT. Its financial ratios are slightly unfavorable, with moderate profitability and some debt concerns, but it holds a very favorable B- rating. The company’s MOAT is very unfavorable, revealing value destruction and declining ROIC.
Alliant Energy Corporation (LNT) presents an unfavorable income statement evaluation, with half of the growth metrics declining recently, although net margin remains favorable at 17.33%. Its financial ratios are more unfavorable than ED’s, showing weaker liquidity and higher debt ratios, yet it maintains a very favorable C+ rating. LNT’s MOAT is unfavorable, indicating stable but value-destroying profitability.
For risk-averse investors prioritizing stable income and overall rating, ED might appear more favorable given its stronger income statement and rating status despite value erosion. Conversely, growth-oriented investors seeking higher recent price appreciation could find LNT’s profile more aligned with their strategy, though they should consider its weaker financial ratios and value destruction.
Disclaimer: Investment carries a risk of loss of initial capital. The past performance is not a reliable indicator of future results. Be sure to understand risks before making an investment decision.
Go Further
I encourage you to read the complete analyses of Consolidated Edison, Inc. and Alliant Energy Corporation to enhance your investment decisions: