Home > Comparison > Utilities > CMS vs LNT
The strategic rivalry between CMS Energy Corporation and Alliant Energy Corporation shapes the Utilities sector’s future. CMS operates as a capital-intensive, vertically integrated utility serving Michigan with extensive electric and gas infrastructure. In contrast, Alliant Energy focuses on diversified regional utility services, blending regulated electric and gas operations with freight logistics. This analysis pits CMS’s scale against Alliant’s operational diversity to identify which offers superior risk-adjusted returns for a balanced portfolio.

Table of contents
Companies Overview
CMS Energy Corporation and Alliant Energy Corporation stand as key players in the U.S. regulated electric utilities sector.
CMS Energy Corporation: Regional Utility Powerhouse
CMS Energy Corporation dominates Michigan’s regulated electric and gas markets. Its core revenue arises from electricity generation, transmission, and distribution across coal, wind, gas, renewable, oil, and nuclear sources. In 2026, CMS focuses sharply on integrating renewable energy within its diverse fuel mix to enhance sustainability and reliability for its 1.9M electric and 1.8M gas customers.
Alliant Energy Corporation: Midwestern Utility Integrator
Alliant Energy Corporation serves a broad customer base in Iowa, Wisconsin, and neighboring states, generating revenue through regulated electricity and natural gas services. It operates via subsidiaries IPL and WPL, combining retail and wholesale electric sales with natural gas distribution. Alliant’s strategic emphasis in 2026 is expanding clean energy assets, including wind farms and efficient natural gas plants, to support regional industrial and agricultural clients.
Strategic Collision: Similarities & Divergences
Both companies prioritize regulated utility services with a strong foothold in electricity and gas distribution. CMS relies on a broad fuel mix and larger customer scale, whereas Alliant leans into focused regional integration and freight logistics. The primary battleground is sustainable energy transition within regulated markets. CMS offers scale and diversity; Alliant provides regional specialization and operational efficiency, shaping distinct investment profiles anchored in their market approaches.
Income Statement Comparison
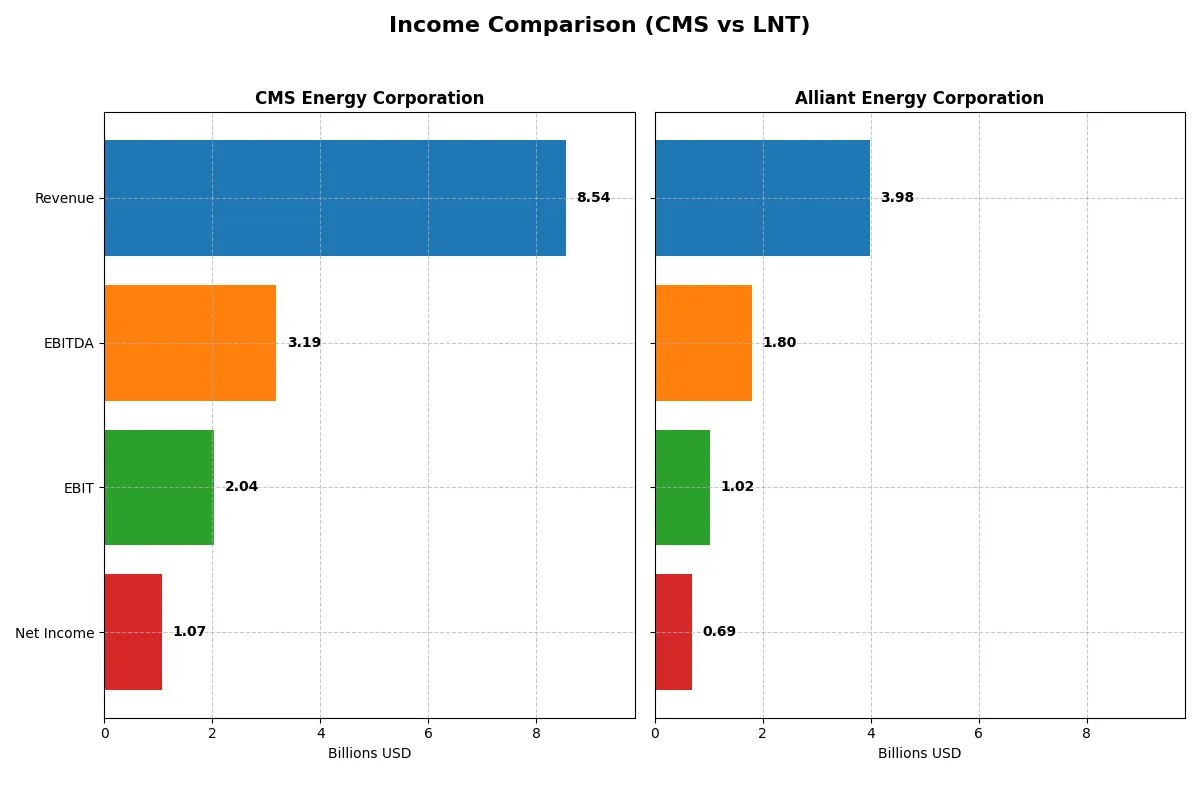
This data dissects the core profitability and scalability of both corporate engines to reveal who dominates the bottom line:
| Metric | CMS Energy Corporation (CMS) | Alliant Energy Corporation (LNT) |
|---|---|---|
| Revenue | 8.54B | 3.98B |
| Cost of Revenue | 3.34B | 2.20B |
| Operating Expenses | 3.47B | 894M |
| Gross Profit | 5.20B | 1.78B |
| EBITDA | 3.19B | 1.80B |
| EBIT | 2.04B | 1.03B |
| Interest Expense | 789M | 449M |
| Net Income | 1.07B | 690M |
| EPS | 3.53 | 2.69 |
| Fiscal Year | 2025 | 2024 |
Income Statement Analysis: The Bottom-Line Duel
This income statement comparison reveals which company efficiently converts revenue into profit, exposing the strength of their corporate engines.
CMS Energy Corporation Analysis
CMS shows a robust revenue increase from $7.3B in 2021 to $8.5B in 2025, reflecting solid top-line growth. Net income, however, dipped overall during this period, ending at $1.07B in 2025. Its gross margin soared to a favorable 60.9%, and EBIT margin held strong at 23.9%. Despite a 13.6% revenue jump in 2025, net margin contracted slightly, signaling margin pressure amid rising operating expenses.
Alliant Energy Corporation Analysis
Alliant Energy’s revenue hovered around $3.4B to $4.0B between 2020 and 2024, with a slight decline in 2024 to $3.98B. Net income increased steadily, reaching $690M in 2024. Its gross margin stands at 44.7%, lower than CMS but stable. EBIT margin is a healthy 25.8%, and net margin is solid at 17.3%. Recent years show a slight revenue dip and contracting EBIT, indicating challenges maintaining momentum.
Margin Power vs. Revenue Scale
CMS outpaces Alliant with larger scale and superior gross margin, reflecting operational efficiency and pricing power. Yet, CMS’s net income and margin show volatility, hinting at cost pressures. Alliant offers steadier net margin growth despite smaller revenue. Investors seeking scale and margin muscle may favor CMS, while those prioritizing steady profitability might prefer Alliant’s profile.
Financial Ratios Comparison
These vital ratios act as a diagnostic tool to expose the underlying fiscal health, valuation premiums, and capital efficiency of the companies compared below:
| Ratios | CMS Energy Corporation (CMS) | Alliant Energy Corporation (LNT) |
|---|---|---|
| ROE | 12.01% | 9.85% |
| ROIC | 3.71% | 4.08% |
| P/E | 19.49 | 21.98 |
| P/B | 2.34 | 2.17 |
| Current Ratio | 1.34 | 0.44 |
| Quick Ratio | 1.34 | 0.33 |
| D/E | 2.12 | 1.49 |
| Debt-to-Assets | 47.3% | 45.8% |
| Interest Coverage | 2.19 | 1.97 |
| Asset Turnover | 0.21 | 0.18 |
| Fixed Asset Turnover | 0.28 | 0.21 |
| Payout Ratio | 60.5% | 71.3% |
| Dividend Yield | 3.10% | 3.24% |
| Fiscal Year | 2025 | 2024 |
Efficiency & Valuation Duel: The Vital Signs
Financial ratios act as a company’s DNA, exposing hidden risks and operational strengths that shape investor decisions.
CMS Energy Corporation
CMS shows a solid net margin of 12.54% and a neutral ROE at 12.01%, indicating moderate profitability. Its P/E of 19.49 and P/B of 2.34 suggest fair valuation without major premium. CMS returns value through a 3.1% dividend yield, appealing to income-focused shareholders while balancing reinvestment prudently.
Alliant Energy Corporation
Alliant posts a higher net margin at 17.33%, but a weaker ROE of 9.85%, signaling less efficient equity use. Its P/E of 21.98 strikes a neutral valuation but leans toward being stretched. The company offers a 3.24% dividend yield, supporting shareholder returns despite some financial leverage concerns.
Balanced Profitability vs. Dividend Stability
CMS balances profitability and valuation with a stable dividend and moderate risk, while Alliant excels in margin but faces more financial pressure. Investors seeking steady income and moderate risk may favor CMS. Those prioritizing margin strength might consider Alliant’s profile despite higher risks.
Which one offers the Superior Shareholder Reward?
I see CMS Energy offers a steady 3.1% dividend yield with a payout ratio around 60%, well covered by free cash flow (FCF). CMS pairs dividends with modest buybacks, supporting shareholder returns sustainably. Alliant Energy yields slightly higher at 3.2%, but its payout ratio exceeds 70%, with negative free cash flow signaling risk. LNT’s buybacks are less consistent and cash coverage weaker, raising sustainability concerns. I conclude CMS delivers a more balanced, sustainable total return profile for 2026 investors.
Comparative Score Analysis: The Strategic Profile
The radar chart reveals the fundamental DNA and trade-offs of CMS Energy Corporation and Alliant Energy Corporation:
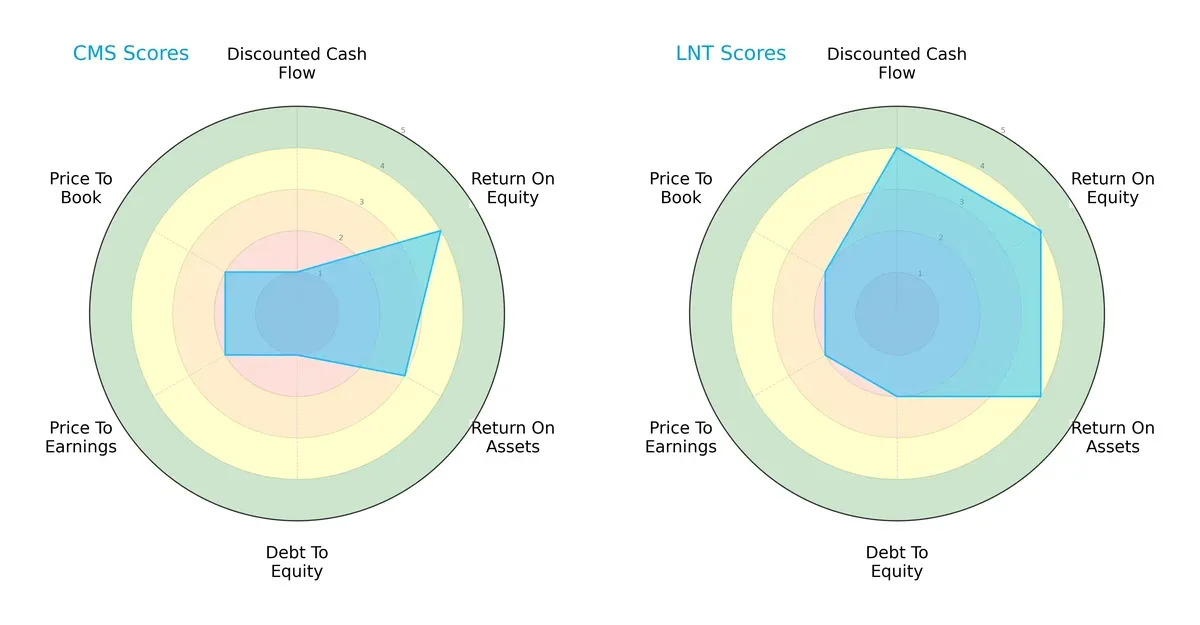
CMS shows clear weaknesses in discounted cash flow and debt management, scoring 1 in both, signaling financial risk. Alliant Energy boasts a more balanced profile, with favorable scores in DCF (4), ROE (4), and ROA (4). Both firms share similar valuation challenges with P/E and P/B scores at 2, but CMS’s very unfavorable debt-to-equity score (1) contrasts with Alliant’s moderate risk (2). I see Alliant as the stronger, better-rounded operator while CMS depends heavily on equity returns amid leverage concerns.
Bankruptcy Risk: Solvency Showdown
The Altman Z-Scores place both companies in the distress zone, but CMS (0.85) trails Alliant Energy (1.15), indicating higher bankruptcy risk in the current cycle:
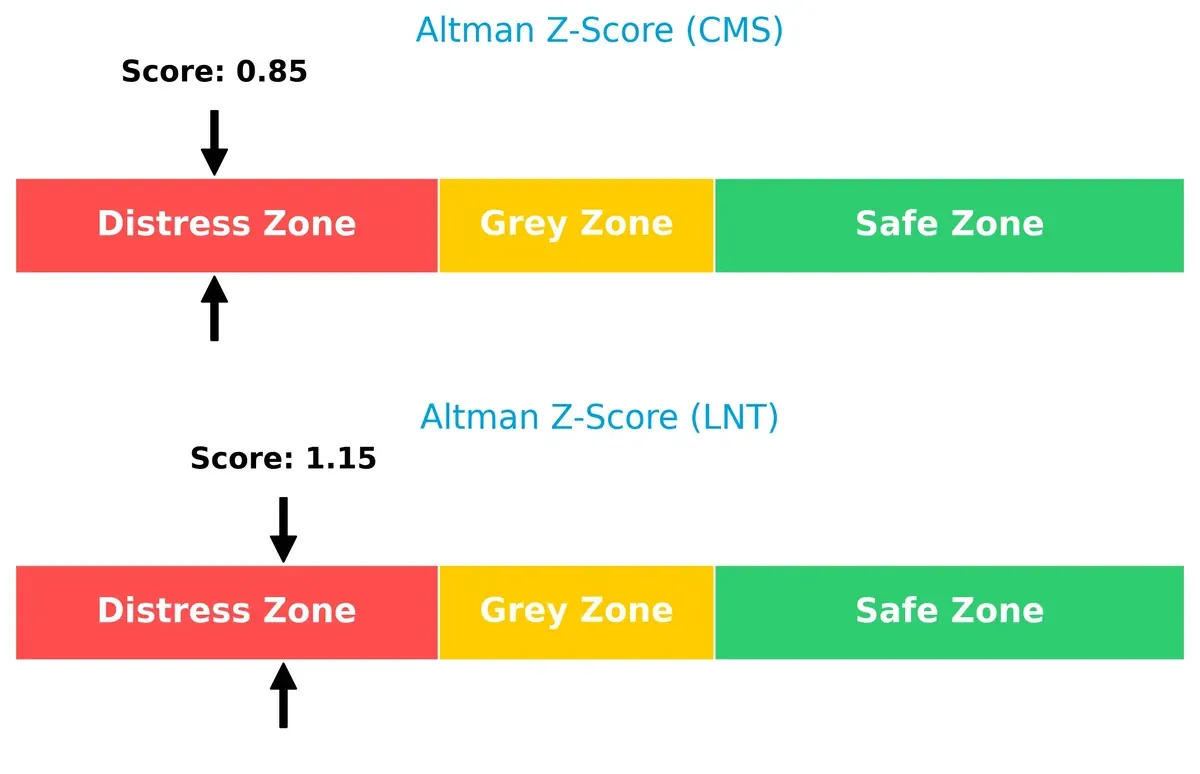
CMS’s score well below 1.8 signals acute financial distress. Although Alliant Energy also faces risk, its higher score suggests a marginally better survival outlook. Investors should treat CMS as a high-risk credit wager.
Financial Health: Quality of Operations
CMS’s Piotroski F-Score of 7 indicates strong internal financial health, while Alliant Energy’s 4 points to average operational quality and potential red flags:
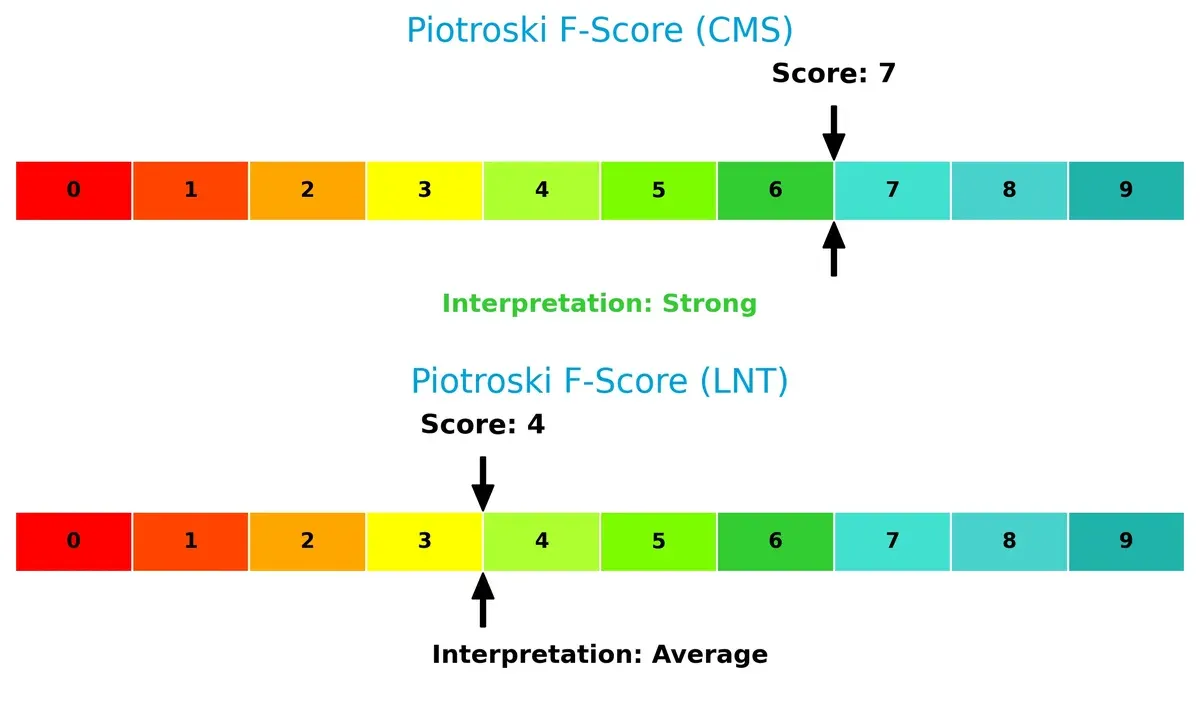
CMS demonstrates solid profitability and efficiency, offsetting some solvency concerns. Alliant’s middling score warns of weaker internal fundamentals, despite a sturdier balance sheet. This divergence underlines a classic trade-off between financial strength and operational execution.
How are the two companies positioned?
This section dissects the operational DNA of CMS and LNT by comparing their revenue distribution and internal dynamics. The goal is to confront their economic moats and identify which model offers the most resilient competitive advantage today.
Revenue Segmentation: The Strategic Mix
This visual comparison dissects how CMS Energy Corporation and Alliant Energy Corporation diversify their income streams and where their primary sector bets lie:
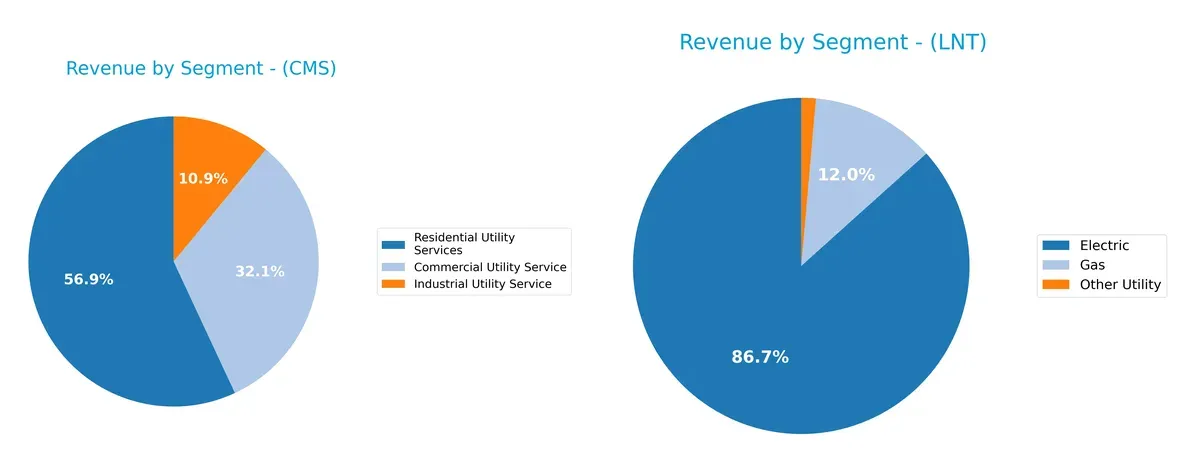
CMS Energy Corporation anchors its revenue in Residential Utility Services with $3.75B, complemented by Commercial ($2.11B) and Industrial ($720M) segments, showing a moderately diversified utility mix. Alliant Energy Corporation pivots heavily on its Electric segment with $3.37B, while Gas ($465M) and Other Utility ($54M) trail far behind, signaling a concentration risk but also infrastructure dominance in electric utilities. CMS’s balanced approach reduces dependency risk compared to Alliant’s electric-heavy focus.
Strengths and Weaknesses Comparison
This table compares the Strengths and Weaknesses of CMS Energy Corporation and Alliant Energy Corporation:
CMS Strengths
- Higher net margin at 12.54%
- Favorable quick ratio of 1.34
- Dividend yield of 3.1%
- Neutral ROE at 12.01%
- Balanced debt-to-assets ratio at 47.31%
- Diverse utility segments including commercial, industrial, residential
LNT Strengths
- Stronger net margin at 17.33%
- Favorable WACC at 5.92%
- Dividend yield of 3.24%
- Neutral debt-to-assets ratio at 45.81%
- Focused segments in electric and gas utilities
- Consistent revenue growth in electric segment
CMS Weaknesses
- Unfavorable ROIC at 3.71% below WACC
- High debt-to-equity at 2.12
- Unfavorable asset and fixed asset turnover ratios
- Neutral interest coverage at 2.58
- Neutral P/E and P/B ratios
- Neutral current ratio at 1.34
LNT Weaknesses
- Unfavorable ROE at 9.85% and ROIC at 4.08%
- Low current ratio of 0.44 and quick ratio 0.33
- Unfavorable debt-to-equity at 1.49
- Unfavorable asset and fixed asset turnover ratios
- Neutral interest coverage at 2.28
- Higher P/E at 21.98
CMS shows strengths in profitability and liquidity with moderate leverage, while LNT delivers higher net margins but faces liquidity and returns challenges. Both companies exhibit weaknesses in asset efficiency, indicating room for operational improvement. These factors will influence their capital allocation and growth strategies.
The Moat Duel: Analyzing Competitive Defensibility
A structural moat is the only safeguard for long-term profits against relentless competition erosion:
CMS Energy Corporation: Asset-Heavy Regulated Utility Moat
CMS relies on its regulated electric and gas utility assets, which generate stable cash flows. Despite a declining ROIC below WACC, its broad infrastructure and renewable projects support margin resilience in 2026.
Alliant Energy Corporation: Regional Utility with Operational Efficiency
Alliant’s moat stems from its regional scale and diverse utility operations. Its ROIC also trails WACC and declines, yet operational focus and market expansion efforts may offer limited moat reinforcement this year.
Infrastructure Scale vs. Regional Efficiency: The Moat Clash
Both firms face shrinking economic moats with ROIC undercutting WACC and downward trends. CMS’s extensive asset base offers a deeper moat, better positioned to defend market share amid evolving energy demands.
Which stock offers better returns?
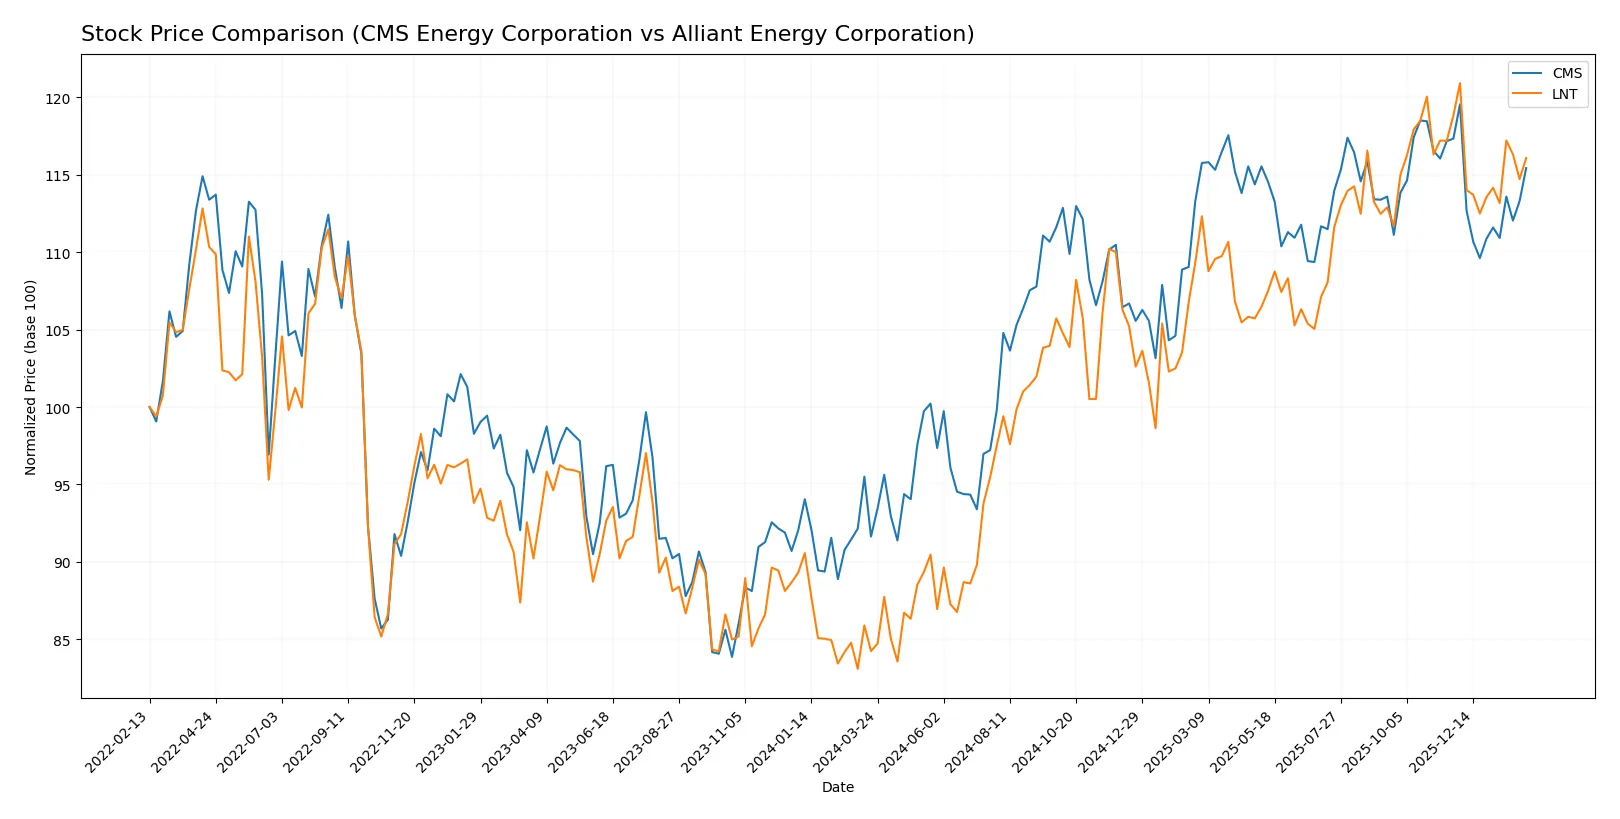
CMS Energy Corporation and Alliant Energy Corporation both showed robust price appreciation over the past year, with notable highs and a recent deceleration in upward momentum. Trading volumes increased, reflecting active investor interest.
Trend Comparison
CMS Energy’s stock rose 26.0% over the past 12 months, marking a bullish trend with decelerating gains. The price ranged from 57.66 to 75.44, with slight recent weakness of -1.62%.
Alliant Energy’s stock gained 37.8% over the past 12 months, also bullish with deceleration. It traded between 48.0 and 69.47, but recently declined by 2.31%, entering a mild bearish short-term phase.
Alliant Energy outperformed CMS in overall price gains, delivering the highest market return despite recent short-term softness in both stocks.
Target Prices
Analysts set clear target price ranges signaling moderate upside potential for these utilities.
| Company | Target Low | Target High | Consensus |
|---|---|---|---|
| CMS Energy Corporation | 74 | 82 | 78.14 |
| Alliant Energy Corporation | 67 | 78 | 73 |
CMS trades near 72.84, just below its 78.14 consensus, implying modest appreciation. Alliant Energy’s 66.69 stock price sits slightly under the 73 consensus, indicating room to grow.

Don’t Let Luck Decide Your Entry Point
Optimize your entry points with our advanced ProRealTime indicators. You’ll get efficient buy signals with precise price targets for maximum performance. Start outperforming now!
How do institutions grade them?
The following tables summarize recent institutional grades for CMS Energy Corporation and Alliant Energy Corporation:
CMS Energy Corporation Grades
This table shows recent grades and recommendations from major financial institutions for CMS Energy Corporation.
| Grading Company | Action | New Grade | Date |
|---|---|---|---|
| Mizuho | Maintain | Neutral | 2026-02-06 |
| Morgan Stanley | Maintain | Equal Weight | 2026-02-02 |
| Jefferies | Maintain | Buy | 2026-01-28 |
| Wells Fargo | Maintain | Equal Weight | 2026-01-20 |
| JP Morgan | Maintain | Overweight | 2026-01-15 |
| Jefferies | Maintain | Buy | 2026-01-15 |
| Barclays | Maintain | Overweight | 2026-01-15 |
| UBS | Maintain | Neutral | 2025-12-17 |
| JP Morgan | Maintain | Overweight | 2025-12-11 |
| Morgan Stanley | Maintain | Equal Weight | 2025-10-22 |
Alliant Energy Corporation Grades
This table presents recent institutional grades and changes for Alliant Energy Corporation.
| Grading Company | Action | New Grade | Date |
|---|---|---|---|
| Barclays | Upgrade | Equal Weight | 2026-01-21 |
| BMO Capital | Upgrade | Outperform | 2026-01-13 |
| Argus Research | Downgrade | Hold | 2026-01-09 |
| UBS | Maintain | Buy | 2025-12-17 |
| UBS | Upgrade | Buy | 2025-10-24 |
| BMO Capital | Maintain | Market Perform | 2025-10-17 |
| B of A Securities | Maintain | Buy | 2025-10-17 |
| Barclays | Maintain | Underweight | 2025-10-14 |
| UBS | Maintain | Neutral | 2025-10-10 |
| B of A Securities | Maintain | Buy | 2025-08-14 |
Which company has the best grades?
CMS Energy Corporation consistently receives stable to positive grades, including multiple “Buy” and “Overweight” ratings. Alliant Energy shows a mix of upgrades and downgrades but features notable upgrades to “Outperform” and “Buy.” Investors may interpret CMS’s steady favorable grades as a sign of consistent institutional confidence, while Alliant’s varied ratings suggest a more mixed outlook.
Risks specific to each company
The following categories identify the critical pressure points and systemic threats facing both firms in the 2026 market environment:
1. Market & Competition
CMS Energy Corporation
- Operates primarily in Michigan with a diverse generation mix including coal, wind, gas, and nuclear. Faces regional regulatory competition.
Alliant Energy Corporation
- Operates mainly in the Midwest with regulated electricity and gas services, plus freight operations, exposing it to diverse market segments.
2. Capital Structure & Debt
CMS Energy Corporation
- Debt-to-equity ratio of 2.12 signals higher leverage, a notable risk despite neutral debt-to-assets. Interest coverage is moderate at 2.58.
Alliant Energy Corporation
- Lower debt-to-equity at 1.49 but with poor liquidity ratios (current 0.44, quick 0.33) raises short-term solvency concerns. Interest coverage slightly weaker at 2.28.
3. Stock Volatility
CMS Energy Corporation
- Beta of 0.48 indicates lower stock volatility, suggesting defensive utility status.
Alliant Energy Corporation
- Beta of 0.67 reflects higher sensitivity to market swings, increasing risk for risk-averse investors.
4. Regulatory & Legal
CMS Energy Corporation
- Subject to Michigan’s state utility regulations; environmental compliance adds complexity.
Alliant Energy Corporation
- Regulated across multiple states, increasing regulatory exposure and complexity. Additional freight operations add legal oversight.
5. Supply Chain & Operations
CMS Energy Corporation
- Large infrastructure footprint with extensive electric and gas distribution lines; reliance on coal and nuclear presents operational risk.
Alliant Energy Corporation
- Operations span electricity, gas, and freight logistics; diversification offers resilience but adds operational complexity.
6. ESG & Climate Transition
CMS Energy Corporation
- Mix of fossil fuels and renewables; transition risk from coal and gas assets remains significant.
Alliant Energy Corporation
- Wind farm ownership and natural gas plants indicate some ESG focus but fossil fuel reliance persists.
7. Geopolitical Exposure
CMS Energy Corporation
- Primarily domestic Michigan operations limit geopolitical risks.
Alliant Energy Corporation
- Operations concentrated in Midwest US; geopolitical risks limited but regional economic shifts could impact demand.
Which company shows a better risk-adjusted profile?
CMS Energy’s most impactful risk is its high leverage, signaling financial strain despite favorable liquidity ratios. Alliant Energy’s critical risk lies in weak liquidity and operational complexity from diversified business lines. CMS’s lower stock volatility and stronger liquidity suggest a better risk-adjusted profile. However, CMS’s Altman Z-score in the distress zone flags bankruptcy risk, underscoring urgency. Alliant’s broader regulatory exposure and weaker liquidity amplify its vulnerabilities. Overall, CMS edges ahead on risk management but warrants caution due to leverage and distress signals.
Final Verdict: Which stock to choose?
CMS Energy Corporation’s superpower lies in its solid income generation and favorable net margins that reflect operational strength. However, its declining ROIC and heavy debt load are points of vigilance, suggesting potential value erosion. CMS fits a portfolio seeking steady income with a tolerance for financial complexity and cyclical risks.
Alliant Energy Corporation commands a strategic moat through its recurring revenue model and slightly higher margin efficiency. Despite weaker liquidity and a higher debt burden, it offers a safer profile relative to CMS, making it suitable for investors prioritizing stable cash flow and moderate growth with a cautious risk appetite.
If you prioritize operational cash flow robustness and income generation, CMS stands out despite its financial leverage concerns. However, if you seek more consistent revenue streams and relative stability amid sector headwinds, Alliant Energy offers better defensive qualities. Both require careful risk management given their value-destroying ROIC trends.
Disclaimer: Investment carries a risk of loss of initial capital. The past performance is not a reliable indicator of future results. Be sure to understand risks before making an investment decision.
Go Further
I encourage you to read the complete analyses of CMS Energy Corporation and Alliant Energy Corporation to enhance your investment decisions: