American Electric Power Company, Inc. (AEP) and Alliant Energy Corporation (LNT) are two prominent players in the regulated electric utilities sector. Both companies provide essential electricity services across multiple U.S. states, focusing on innovation in energy generation and distribution while balancing traditional and renewable sources. This article compares their market presence, growth strategies, and risk profiles to help you identify which utility stock might best enhance your investment portfolio.
Table of contents
Companies Overview
I will begin the comparison between American Electric Power Company, Inc. and Alliant Energy Corporation by providing an overview of these two companies and their main differences.
American Electric Power Company, Inc. Overview
American Electric Power Company, Inc. is a major electric public utility holding company based in Columbus, Ohio. Founded in 1906, AEP focuses on generation, transmission, and distribution of electricity across the United States. It operates through multiple segments and employs 16,330 people, generating power using diverse energy sources including coal, natural gas, nuclear, hydro, solar, and wind.
Alliant Energy Corporation Overview
Alliant Energy Corporation, headquartered in Madison, Wisconsin, is a utility holding company providing regulated electricity and natural gas services primarily in Iowa and Wisconsin. Established in 1981, it serves over 1.4M retail customers through subsidiaries IPL and WPL and operates additional freight and logistics assets. The company employs about 3,000 people and owns natural gas and wind power generation facilities.
Key similarities and differences
Both AEP and Alliant Energy operate in the regulated electric utility industry and serve retail and wholesale customers in the U.S. AEP is substantially larger with a market cap of $62.6B and a broader energy generation mix. Alliant Energy, with a $16.7B market cap, integrates natural gas services and has diversified logistics operations. Their scale, geographic focus, and asset structures represent the main differences.
Income Statement Comparison
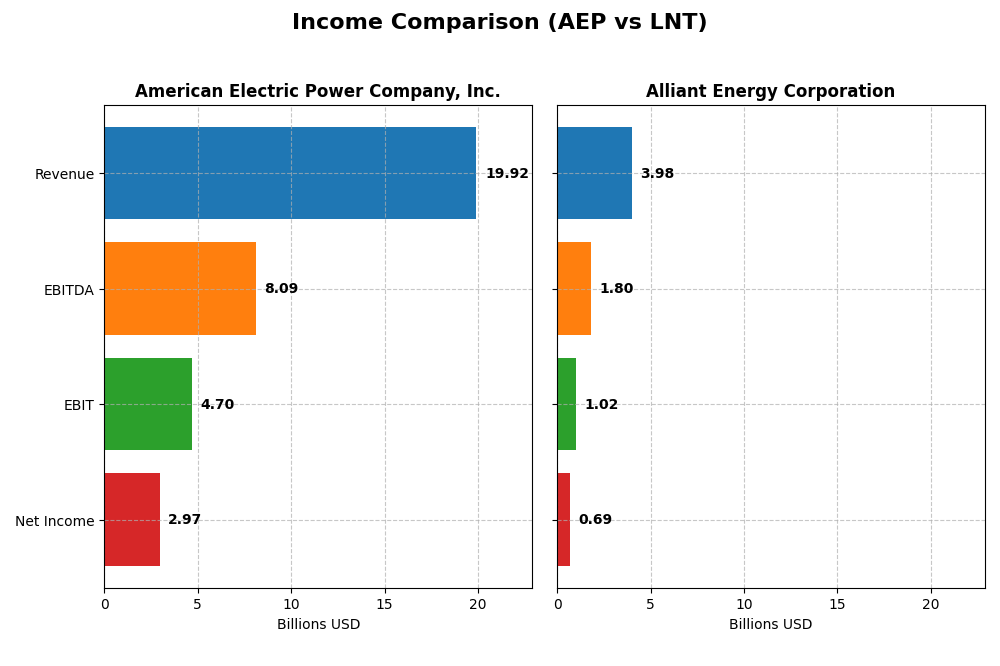
The table below presents a side-by-side comparison of key income statement metrics for American Electric Power Company, Inc. and Alliant Energy Corporation for the fiscal year 2024.
| Metric | American Electric Power Company, Inc. (AEP) | Alliant Energy Corporation (LNT) |
|---|---|---|
| Market Cap | 62.6B | 16.7B |
| Revenue | 19.9B | 3.98B |
| EBITDA | 8.09B | 1.80B |
| EBIT | 4.70B | 1.03B |
| Net Income | 2.97B | 690M |
| EPS | 5.60 | 2.69 |
| Fiscal Year | 2024 | 2024 |
Income Statement Interpretations
American Electric Power Company, Inc.
American Electric Power (AEP) showed steady revenue growth from $14.9B in 2020 to $19.9B in 2024, with net income rising from $2.2B to $3.0B over the same period. Margins remained stable with a favorable gross margin near 32% and net margin around 15%. In 2024, revenue growth slowed to 2.8%, but net income and earnings per share increased sharply, reflecting improved profitability.
Alliant Energy Corporation
Alliant Energy (LNT) experienced more modest revenue growth, from $3.4B in 2020 to $4.0B in 2024, with net income increasing from $614M to $690M. Margins were comparatively higher, with a gross margin near 45% and net margin around 17%. However, 2024 showed a slight revenue decline and deterioration in EBIT and net margin growth, signaling some pressure on operational efficiency.
Which one has the stronger fundamentals?
AEP demonstrates stronger fundamentals with higher overall revenue and net income growth, supported by stable gross and net margins and favorable margin expansion in the latest year. Conversely, LNT, despite better margins, faces challenges with recent revenue contraction and several unfavorable margin trends. The overall income statement evaluations favor AEP’s consistent growth and profitability.
Financial Ratios Comparison
This table presents a comparison of key financial ratios for American Electric Power Company, Inc. (AEP) and Alliant Energy Corporation (LNT) for the fiscal year 2024, reflecting their latest reported data.
| Ratios | American Electric Power (AEP) | Alliant Energy (LNT) |
|---|---|---|
| ROE | 11.0% | 9.9% |
| ROIC | 5.0% | 4.9% |
| P/E | 16.5 | 22.0 |
| P/B | 1.81 | 2.17 |
| Current Ratio | 0.44 | 0.44 |
| Quick Ratio | 0.31 | 0.33 |
| D/E (Debt-to-Equity) | 1.70 | 1.49 |
| Debt-to-Assets | 44.4% | 45.8% |
| Interest Coverage | 2.56 | 1.97 |
| Asset Turnover | 0.19 | 0.18 |
| Fixed Asset Turnover | 0.24 | 0.21 |
| Payout Ratio | 64.2% | 71.3% |
| Dividend Yield | 3.9% | 3.2% |
Interpretation of the Ratios
American Electric Power Company, Inc.
American Electric Power shows a mixed ratio profile with strong net margin (14.9%, favorable) and dividend yield (3.89%, favorable), but weaknesses in return on invested capital (4.96%, unfavorable) and liquidity ratios, such as a low current ratio of 0.44. The company maintains a neutral return on equity (11.01%) and price multiples. Dividends are well-covered with a stable payout, yet risks include the company’s high debt-to-equity ratio and asset turnover challenges.
Alliant Energy Corporation
Alliant Energy exhibits strong net margin (17.33%, favorable) but weaker profitability indicators like return on equity (9.85%, unfavorable) and return on invested capital (4.88%, unfavorable). Liquidity ratios are low with a current ratio of 0.44, and debt levels remain a concern. The dividend yield is moderate at 3.24%, supported by consistent payouts, though high debt and low asset turnover ratios may impact financial flexibility.
Which one has the best ratios?
Both companies face similar challenges, including low liquidity and weak asset turnover metrics. American Electric Power benefits from a slightly better return on equity and higher dividend yield, while Alliant Energy has a stronger net margin but weaker profitability and higher debt concerns. Overall, their global ratios are both slightly unfavorable, reflecting a cautious financial outlook.
Strategic Positioning
This section compares the strategic positioning of American Electric Power Company, Inc. (AEP) and Alliant Energy Corporation (LNT), including market position, key segments, and exposure to technological disruption:
American Electric Power Company, Inc. (AEP)
- Large market cap of 62.6B with diverse regulated electric utility assets; moderate competitive pressure.
- Revenue driven by vertically integrated utilities, transmission & distribution, generation & marketing segments.
- Uses a mix of coal, natural gas, nuclear, hydro, solar, and wind; adapting to evolving energy technologies.
Alliant Energy Corporation (LNT)
- Smaller market cap of 16.7B; operates regulated electric and natural gas utilities; faces typical utility sector competition.
- Revenue mainly from electric utility operations, natural gas distribution, and other utility services.
- Owns natural gas-fired units and wind farms; exposure focused on electric and gas utility operations.
AEP vs LNT Positioning
AEP exhibits a diversified business model across multiple energy generation types and utility segments, while LNT’s operations concentrate on electric and gas utilities with some renewable assets. AEP’s scale and vertical integration contrast with LNT’s more regional and segmented utility focus.
Which has the best competitive advantage?
Both companies are currently shedding value relative to their cost of capital. AEP shows a growing ROIC trend, indicating improving profitability, whereas LNT’s ROIC trend is neutral. AEP holds a slightly more favorable moat status compared to LNT’s unfavorable rating.
Stock Comparison
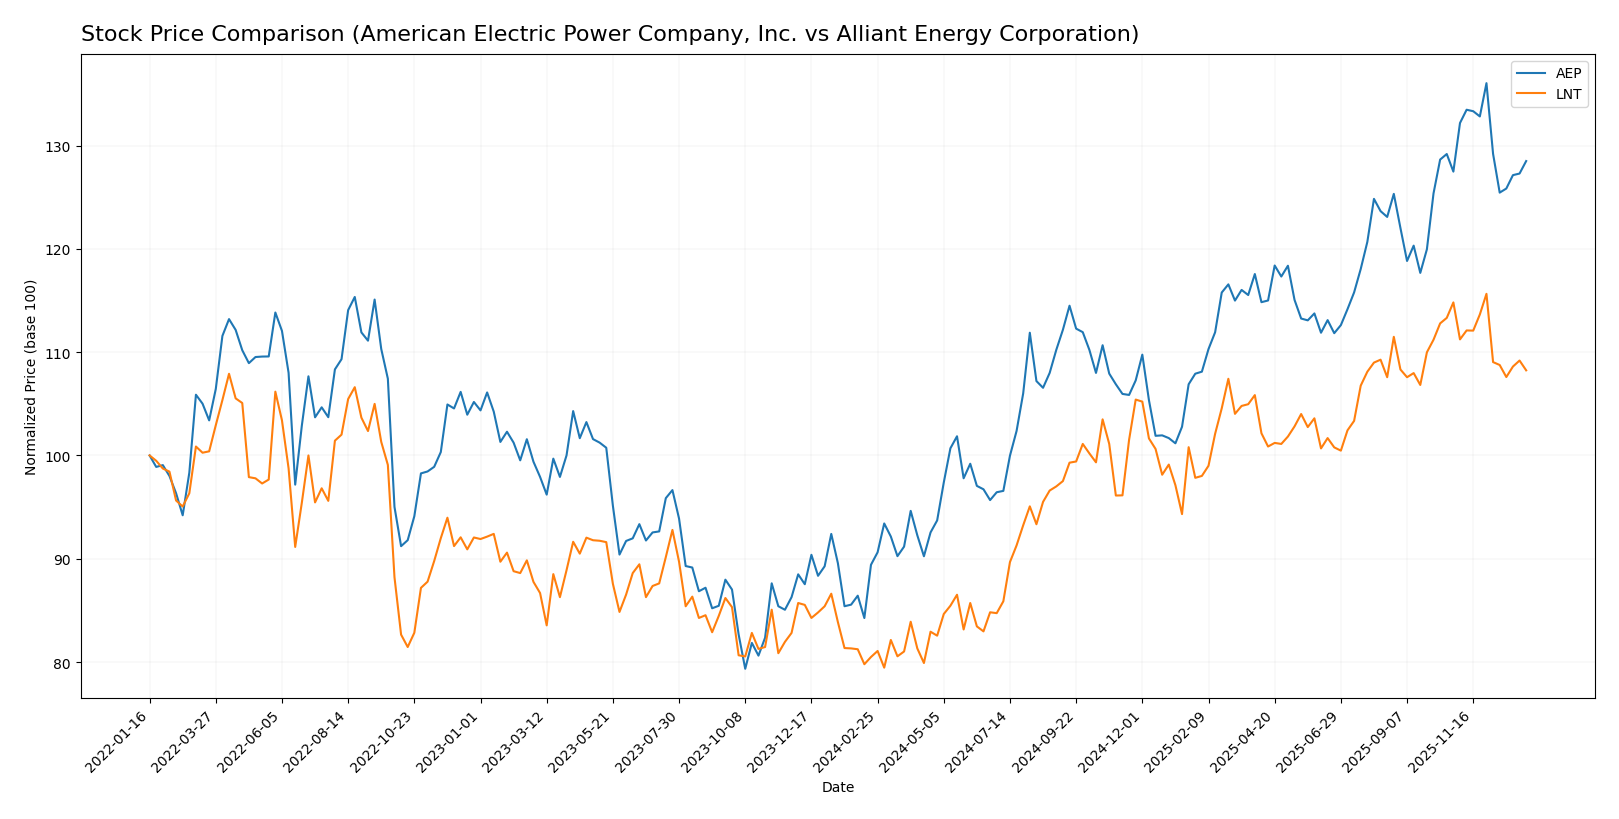
The stock price movements of American Electric Power Company, Inc. (AEP) and Alliant Energy Corporation (LNT) over the past year reveal strong bullish trends with decelerating momentum, highlighted by notable highs and contrasting recent trading dynamics.
Trend Analysis
American Electric Power Company, Inc. (AEP) showed a bullish trend over the past 12 months with a 43.71% price increase and decelerating acceleration. The highest price reached 123.77, with volatility at a 10.6 standard deviation.
Alliant Energy Corporation (LNT) also experienced a bullish trend with a 34.48% price rise over the same period and deceleration in momentum. Price volatility was lower at 5.9 standard deviation, with a peak price of 69.47.
Comparing both, AEP outperformed LNT in market performance with a higher percentage gain of 43.71% versus 34.48% over the past year.
Target Prices
The consensus target prices from verified analysts suggest moderate upside potential for these utilities.
| Company | Target High | Target Low | Consensus |
|---|---|---|---|
| American Electric Power Company, Inc. | 138 | 107 | 126.82 |
| Alliant Energy Corporation | 78 | 65 | 73 |
Analysts expect American Electric Power’s price to rise above its current 116.91 USD, while Alliant Energy’s target consensus at 73 USD indicates a notable upside from its 65.02 USD market price.
Analyst Opinions Comparison
This section compares analysts’ ratings and grades for American Electric Power Company, Inc. (AEP) and Alliant Energy Corporation (LNT):
Rating Comparison
AEP Rating
- Rating: B+ indicating a very favorable overall evaluation.
- Discounted Cash Flow Score: 4, reflecting a favorable valuation outlook.
- ROE Score: 4, showing strong efficiency in generating profit from equity.
- ROA Score: 4, demonstrating effective use of assets to generate earnings.
- Debt To Equity Score: 2, representing moderate financial risk management.
- Overall Score: 3, classified as moderate overall financial standing.
LNT Rating
- Rating: C+ also rated very favorable overall but lower than AEP.
- Discounted Cash Flow Score: 3, indicating a moderate valuation assessment.
- ROE Score: 1, a very unfavorable efficiency in equity profit generation.
- ROA Score: 4, equally favorable asset utilization for earnings.
- Debt To Equity Score: 1, signaling very unfavorable financial risk position.
- Overall Score: 2, reflecting a moderate but lower overall financial rating.
Which one is the best rated?
Based strictly on the provided data, AEP holds better ratings overall, with higher scores in discounted cash flow, return on equity, and debt-to-equity metrics. LNT matches AEP only in return on assets but scores lower elsewhere.
Scores Comparison
Here is a comparison of the Altman Z-Score and Piotroski Score for both companies:
AEP Scores
- Altman Z-Score: 0.998, indicating distress zone risk.
- Piotroski Score: 6, reflecting average financial health.
LNT Scores
- Altman Z-Score: unavailable for this company.
- Piotroski Score: 5, reflecting average financial health.
Which company has the best scores?
Based on the provided data, AEP has a measurable Altman Z-Score indicating financial distress, while LNT’s score is unavailable. Both have average Piotroski Scores, with AEP slightly higher at 6 versus 5 for LNT.
Grades Comparison
Here is the detailed grades comparison for American Electric Power Company, Inc. and Alliant Energy Corporation:
American Electric Power Company, Inc. Grades
The table below shows recent stock grades issued by major grading companies for American Electric Power Company, Inc.:
| Grading Company | Action | New Grade | Date |
|---|---|---|---|
| UBS | Maintain | Sell | 2025-12-17 |
| JP Morgan | Maintain | Neutral | 2025-12-12 |
| Jefferies | Upgrade | Buy | 2025-11-17 |
| Citigroup | Maintain | Neutral | 2025-10-31 |
| Wells Fargo | Maintain | Overweight | 2025-10-30 |
| Evercore ISI Group | Maintain | Outperform | 2025-10-30 |
| Morgan Stanley | Maintain | Overweight | 2025-10-30 |
| Mizuho | Maintain | Neutral | 2025-10-30 |
| BMO Capital | Downgrade | Market Perform | 2025-10-30 |
| Scotiabank | Maintain | Sector Perform | 2025-10-30 |
Overall, American Electric Power Company, Inc. shows a mixed pattern with several neutral and overweight ratings, a few upgrades, and a recent downgrade from BMO Capital.
Alliant Energy Corporation Grades
The table below shows recent stock grades issued by major grading companies for Alliant Energy Corporation:
| Grading Company | Action | New Grade | Date |
|---|---|---|---|
| Argus Research | Downgrade | Hold | 2026-01-09 |
| UBS | Maintain | Buy | 2025-12-17 |
| UBS | Upgrade | Buy | 2025-10-24 |
| B of A Securities | Maintain | Buy | 2025-10-17 |
| BMO Capital | Maintain | Market Perform | 2025-10-17 |
| Barclays | Maintain | Underweight | 2025-10-14 |
| UBS | Maintain | Neutral | 2025-10-10 |
| B of A Securities | Maintain | Buy | 2025-08-14 |
| BMO Capital | Maintain | Market Perform | 2025-08-11 |
| UBS | Maintain | Neutral | 2025-07-11 |
Alliant Energy Corporation’s grades show a predominance of buy ratings, with some market perform and neutral grades and one recent downgrade to hold.
Which company has the best grades?
Both companies have a consensus rating of “Buy,” but American Electric Power Company, Inc. has more neutral and overweight ratings, while Alliant Energy Corporation has more consistent buy ratings with fewer downgrades. This suggests varying analyst confidence that investors should monitor closely.
Strengths and Weaknesses
Below is a comparison of key strengths and weaknesses of American Electric Power Company, Inc. (AEP) and Alliant Energy Corporation (LNT) based on their latest financial and operational data.
| Criterion | American Electric Power Company, Inc. (AEP) | Alliant Energy Corporation (LNT) |
|---|---|---|
| Diversification | High revenue from Transmission & Distribution (5.88B), Generation & Marketing (1.94B), and other services | Moderate diversification: mainly Electric (3.37B), Gas (465M), and Other Utility (54M) |
| Profitability | Net margin 14.9%, ROE neutral at 11.01%, but ROIC unfavorable at 4.96% | Higher net margin 17.33%, lower ROE at 9.85%, ROIC also unfavorable at 4.88% |
| Innovation | Moderate; improving ROIC trend (+28%) indicates growing efficiency | Stable profitability with nearly flat ROIC trend (+0.8%); less dynamic improvement |
| Global presence | Primarily US-focused utility with strong regional presence | US regional utility with stable but limited geographic scope |
| Market Share | Large market share in transmission and distribution with 5.88B revenue segment | Smaller scale with electric revenue at 3.37B; less dominant market share |
Key takeaways: Both companies operate primarily in regulated U.S. utility markets with solid revenue bases. AEP shows stronger diversification and improving profitability trends despite current value destruction, while LNT maintains stable profitability but faces challenges in generating excess returns. Investors should weigh growth potential against current efficiency and risk profiles.
Risk Analysis
The table below summarizes key risk factors for American Electric Power Company, Inc. (AEP) and Alliant Energy Corporation (LNT) based on the latest data from 2024 and early 2026 market conditions.
| Metric | American Electric Power Company, Inc. (AEP) | Alliant Energy Corporation (LNT) |
|---|---|---|
| Market Risk | Moderate (Beta 0.615, stable dividend) | Moderate (Beta 0.671, steady dividend) |
| Debt Level | High (Debt-to-Equity 1.7, Interest Coverage 2.53) | High (Debt-to-Equity 1.49, Interest Coverage 2.28) |
| Regulatory Risk | Elevated (Utility sector subject to policy shifts) | Elevated (Regulated electric and gas operations) |
| Operational Risk | Moderate (Diverse generation mix, including coal) | Moderate (Mixed energy sources, rail freight exposure) |
| Environmental Risk | Significant (Coal use, transition pressures) | Moderate (Renewable projects but fossil fuel reliance) |
| Geopolitical Risk | Low (U.S.-focused operations, limited international exposure) | Low (Primarily U.S. Midwest operations) |
The most impactful and probable risks are the high debt levels and regulatory uncertainties both companies face due to their utility sector nature. AEP’s reliance on coal generation increases environmental and transitional risks, while LNT’s operational diversification into freight adds moderate operational complexity. Both firms exhibit moderate market risk with stable dividends but require caution due to financial leverage and evolving energy policies.
Which Stock to Choose?
American Electric Power Company, Inc. (AEP) shows a generally favorable income statement with 71.43% positive metrics, including strong net margin growth and profitability, but exhibits slightly unfavorable financial ratios and a slightly unfavorable MOAT rating due to value destruction despite a growing ROIC. Its rating is very favorable at B+, supported by solid return scores but moderate debt and liquidity metrics.
Alliant Energy Corporation (LNT) presents a less favorable income statement with 50% unfavorable metrics, reflecting declining margins and EBIT growth, alongside slightly unfavorable financial ratios and an unfavorable MOAT rating indicating value destruction with stable profitability. Its rating is very favorable at C+, though hampered by weaker return on equity and debt-to-equity scores compared to AEP.
Investors with a preference for growth and improving profitability might view AEP more favorably due to its stronger income growth and improving returns, while those valuing stable profitability despite value challenges could find LNT’s profile more suitable, given its steadier ROIC trend and moderate financial risk metrics.
Disclaimer: Investment carries a risk of loss of initial capital. The past performance is not a reliable indicator of future results. Be sure to understand risks before making an investment decision.
Go Further
I encourage you to read the complete analyses of American Electric Power Company, Inc. and Alliant Energy Corporation to enhance your investment decisions: