Ameren Corporation (AEE) and Alliant Energy Corporation (LNT) are two key players in the regulated electric utility sector, serving millions of customers across the Midwest. Both companies focus on electric and natural gas distribution while advancing renewable energy integration and infrastructure modernization. Given their overlapping markets and innovation strategies, this comparison will help investors identify which company presents the most compelling opportunity for long-term growth and stability. Let’s explore which stock deserves a place in your portfolio.
Table of contents
Companies Overview
I will begin the comparison between Ameren Corporation and Alliant Energy Corporation by providing an overview of these two companies and their main differences.
Ameren Corporation Overview
Ameren Corporation is a public utility holding company operating in the United States through four segments, including electric distribution and natural gas transmission. Its mission focuses on providing rate-regulated electric generation, transmission, and distribution services, primarily using coal, nuclear, natural gas, and renewable sources such as wind and solar. Founded in 1881, Ameren serves residential, commercial, and industrial customers and is headquartered in St. Louis, Missouri.
Alliant Energy Corporation Overview
Alliant Energy Corporation is a utility holding company providing regulated electricity and natural gas services primarily in Iowa and Wisconsin. It operates three segments, including electric and gas utility operations, and serves retail customers in various industries such as agriculture and manufacturing. Additionally, Alliant owns freight services and has interests in natural gas and wind power generation. The company was incorporated in 1981 and is headquartered in Madison, Wisconsin.
Key similarities and differences
Both Ameren and Alliant Energy operate as regulated electric utilities offering natural gas services, focusing on stable, rate-regulated markets. Ameren has a broader generation mix including nuclear and hydroelectric power, while Alliant Energy emphasizes wind and natural gas-fired generation and integrates freight logistics. Ameren is significantly larger by market capitalization and employee count, reflecting a wider operational scale and geographic footprint.
Income Statement Comparison
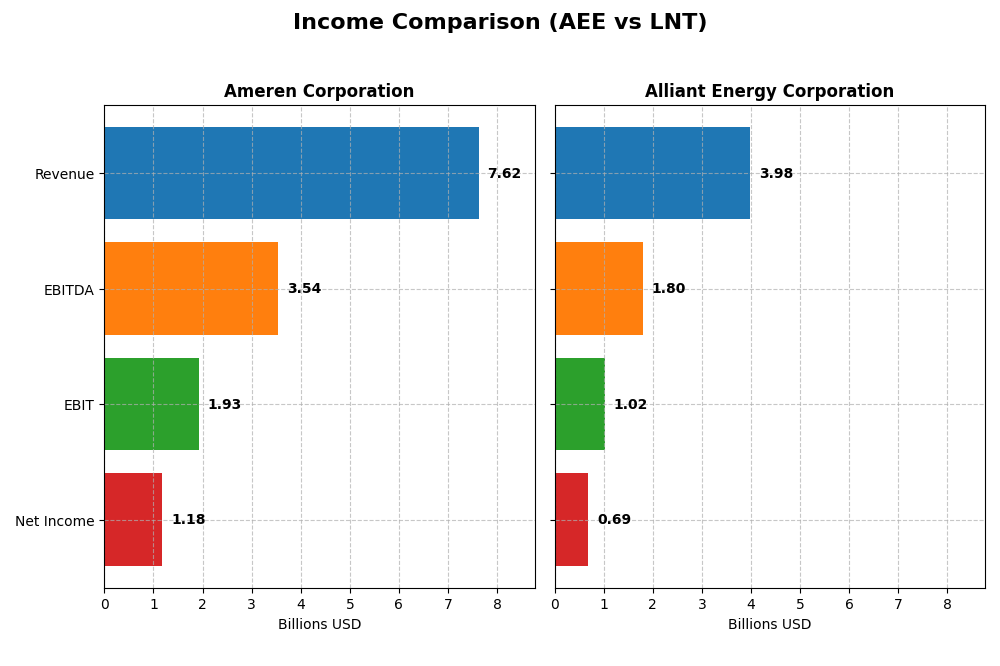
This table presents a side-by-side comparison of the latest fiscal year income statement metrics for Ameren Corporation and Alliant Energy Corporation, providing key financial figures for 2024.
| Metric | Ameren Corporation (AEE) | Alliant Energy Corporation (LNT) |
|---|---|---|
| Market Cap | 27.0B | 16.7B |
| Revenue | 7.62B | 3.98B |
| EBITDA | 3.54B | 1.80B |
| EBIT | 1.93B | 1.03B |
| Net Income | 1.18B | 690M |
| EPS | 4.43 | 2.69 |
| Fiscal Year | 2024 | 2024 |
Income Statement Interpretations
Ameren Corporation
Ameren’s revenue increased steadily from 5.79B in 2020 to 7.62B in 2024, with net income rising from 871M to 1.18B in the same period. Gross and EBIT margins remained favorable, around 48% and 25%, respectively. The 2024 growth slowed to 1.64% in revenue but saw a 5.36% gross profit increase, indicating improved operational efficiency despite modest revenue gains.
Alliant Energy Corporation
Alliant’s revenue grew from 3.42B in 2020 to 3.98B in 2024, while net income rose from 614M to 690M. Margins were favorable but showed some weakness: gross margin stood at 44.7%, EBIT margin at 25.75%, and net margin at 17.33%. The 2024 revenue declined by 1.14%, with EBIT and net margin both decreasing, signaling some challenges in recent profitability.
Which one has the stronger fundamentals?
Ameren demonstrates stronger fundamentals with consistent revenue and net income growth, favorable margin stability, and a positive overall income statement evaluation. Alliant shows slower revenue growth, declining margins, and an unfavorable income statement opinion, reflecting more risk. However, both companies maintain positive net income growth over the period, but Ameren’s financials appear more robust.
Financial Ratios Comparison
This table presents a snapshot of key financial ratios for Ameren Corporation and Alliant Energy Corporation for the fiscal year ended 2024, facilitating a straightforward comparison of their recent financial performance.
| Ratios | Ameren Corporation (AEE) | Alliant Energy Corporation (LNT) |
|---|---|---|
| ROE | 9.76% | 9.85% |
| ROIC | 3.32% | 4.88% |
| P/E | 20.12 | 21.98 |
| P/B | 1.96 | 2.17 |
| Current Ratio | 0.66 | 0.44 |
| Quick Ratio | 0.44 | 0.33 |
| D/E (Debt-to-Equity) | 1.55 | 1.49 |
| Debt-to-Assets | 42.0% | 45.8% |
| Interest Coverage | 2.29 | 1.97 |
| Asset Turnover | 0.17 | 0.18 |
| Fixed Asset Turnover | 0.21 | 0.21 |
| Payout Ratio | 60.4% | 71.3% |
| Dividend Yield | 3.0% | 3.2% |
Interpretation of the Ratios
Ameren Corporation
Ameren shows a mixed ratio profile with a favorable net margin of 15.51% and dividend yield of 3.0%, but faces challenges with low return on equity (9.76%), return on invested capital (3.32%), and liquidity ratios below 1, signaling potential operational and solvency concerns. Its dividend payout appears supported but must be monitored due to negative free cash flow yield, which could pressure future distributions.
Alliant Energy Corporation
Alliant Energy reports a robust net margin of 17.33% and a slightly higher dividend yield at 3.24%, yet also struggles with subpar returns on equity (9.85%) and invested capital (4.88%). Liquidity metrics remain weak, with current and quick ratios well below 1, while its dividend payments seem sustainable but rely on stable cash flows amid ongoing capital expenditures.
Which one has the best ratios?
Both Ameren and Alliant Energy share a similar profile: strong profitability via net margins and dividends, but weakened by low returns on equity, invested capital, and liquidity constraints. Neither distinctly outperforms the other, as each holds an equal proportion of favorable and unfavorable ratios, resulting in a slightly unfavorable overall ratio evaluation for both companies.
Strategic Positioning
This section compares the strategic positioning of Ameren Corporation and Alliant Energy Corporation, including market position, key segments, and exposure to technological disruption:
Ameren Corporation
- Larger market cap of 27B with moderate competitive pressure in regulated electric utilities
- Key segments include regulated electricity and natural gas distribution and transmission
- Generates electricity using coal, nuclear, natural gas, and renewables, balancing traditional and green energy
Alliant Energy Corporation
- Smaller market cap of 16.7B, competing mainly in regulated electric utility markets
- Focus on regulated electric and natural gas services, plus freight and logistics operations
- Uses natural gas and wind power, with additional utility and freight services, showing moderate diversification
Ameren Corporation vs Alliant Energy Corporation Positioning
Ameren shows a more diversified energy generation mix and larger scale across multiple regulated segments. Alliant Energy concentrates on electric, gas, and freight services, with less scale but additional logistics operations. Both operate mainly in regulated utility markets.
Which has the best competitive advantage?
Both companies are shedding value with ROIC below WACC; Ameren’s declining profitability contrasts with Alliant’s stable but unfavorable value creation, indicating neither currently holds a strong competitive moat.
Stock Comparison
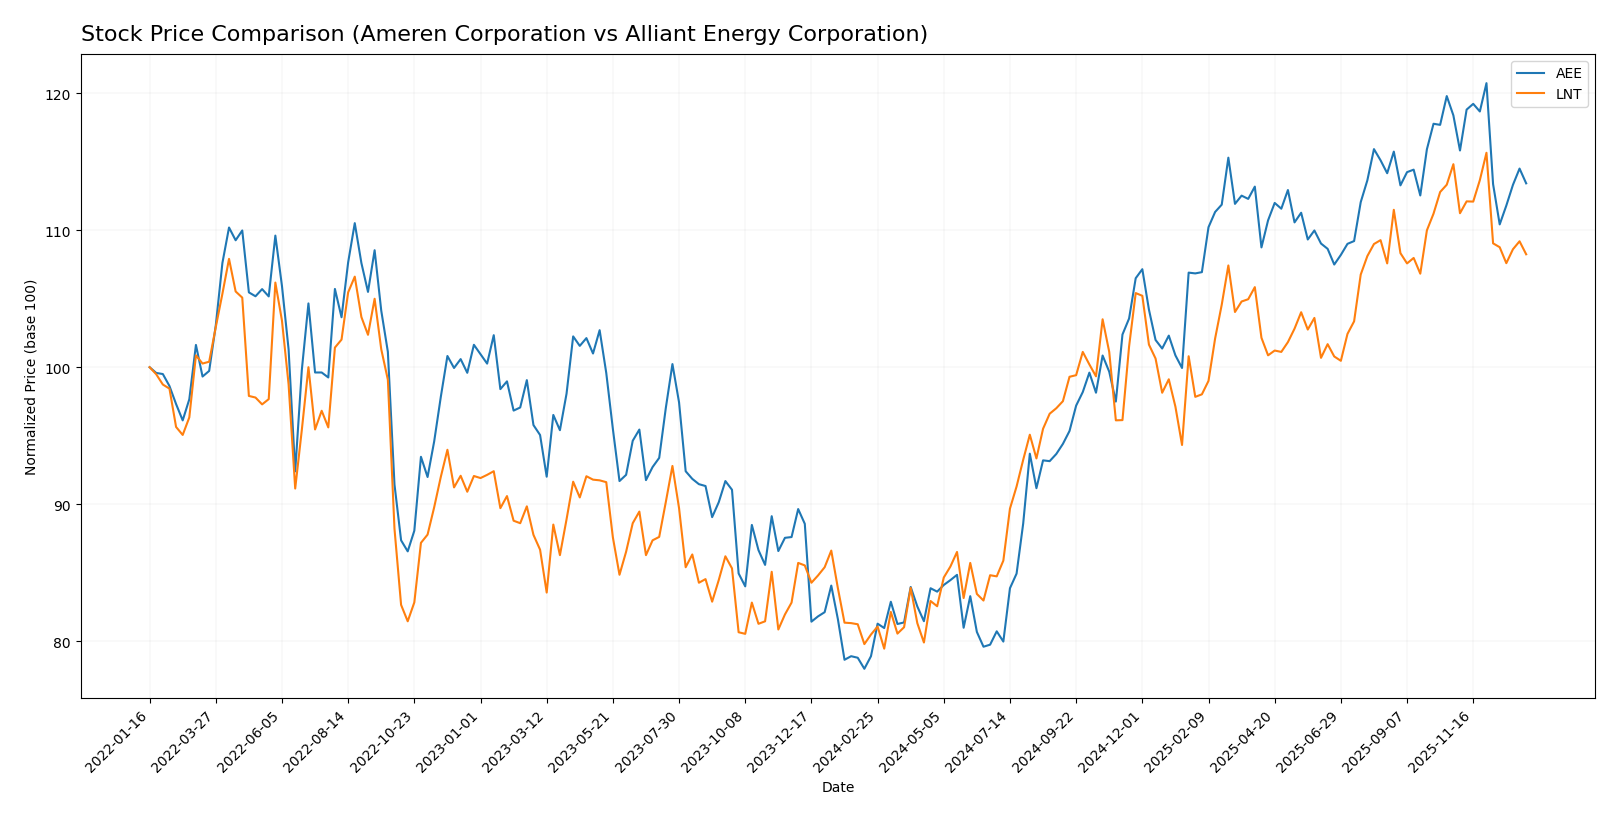
The stock prices of Ameren Corporation and Alliant Energy Corporation have demonstrated significant bullish trends over the past 12 months, with Ameren showing a stronger overall gain but both experiencing recent deceleration and slight declines in price.
Trend Analysis
Ameren Corporation’s stock posted a 43.73% increase over the past year, confirming a bullish trend with decelerating momentum. The price ranged between 69.51 and 106.35, with volatility measured by an 11.4 standard deviation. Recent weeks show a slight bearish pullback of -4.19%.
Alliant Energy Corporation saw a 34.48% price rise in the last 12 months, also bullish but with deceleration and lower volatility at a 5.9 standard deviation. Its price fluctuated from 47.73 to 69.47. The recent trend reveals a -5.73% decline, indicating a mild downward correction.
Comparing the two, Ameren Corporation delivered the highest market performance over the past year, outperforming Alliant Energy by over 9 percentage points despite both experiencing recent price pullbacks.
Target Prices
Analysts present a clear target price consensus for Ameren Corporation and Alliant Energy Corporation.
| Company | Target High | Target Low | Consensus |
|---|---|---|---|
| Ameren Corporation | 119 | 103 | 111.86 |
| Alliant Energy Corporation | 78 | 65 | 73 |
The consensus target prices suggest an upside potential for both stocks compared to their current prices of $99.91 for Ameren and $65.02 for Alliant Energy. Analysts expect moderate growth in these regulated electric utilities.
Analyst Opinions Comparison
This section compares analysts’ ratings and grades for Ameren Corporation (AEE) and Alliant Energy Corporation (LNT):
Rating Comparison
AEE Rating
- Rated B- with a very favorable status overall.
- Discounted Cash Flow Score of 1, considered very unfavorable by analysts.
- Return on Equity Score of 4, indicating favorable profit generation efficiency.
- Return on Assets Score of 3, showing moderate effectiveness in asset use.
- Debt to Equity Score of 2, reflecting moderate financial risk.
- Overall Score of 2, assessed as moderate in overall financial standing.
LNT Rating
- Rated C+ with a very favorable status overall.
- Discounted Cash Flow Score of 3, considered moderate in valuation potential.
- Return on Equity Score of 1, considered very unfavorable for equity returns.
- Return on Assets Score of 4, indicating favorable asset utilization.
- Debt to Equity Score of 1, signaling very unfavorable financial leverage.
- Overall Score of 2, also rated moderate in overall financial standing.
Which one is the best rated?
Based strictly on the provided scores, AEE holds a better rating (B-) compared to LNT’s C+, with stronger return on equity and a better debt to equity profile. Both have the same overall moderate score.
Scores Comparison
Here is a comparison of the Altman Z-Score and Piotroski Score for Ameren Corporation and Alliant Energy Corporation:
Ameren Corporation Scores
- Altman Z-Score: 0.97, in distress zone indicating high bankruptcy risk.
- Piotroski Score: 6, categorized as average financial strength.
Alliant Energy Corporation Scores
- Altman Z-Score: unavailable, no data provided.
- Piotroski Score: 5, categorized as average financial strength.
Which company has the best scores?
Ameren has a clearly quantified Altman Z-Score in the distress zone, while Alliant Energy’s score is unavailable. Both companies show average Piotroski Scores, with Ameren slightly higher at 6 versus 5.
Grades Comparison
The following tables summarize the recent grades assigned by reputable grading companies for Ameren Corporation and Alliant Energy Corporation:
Ameren Corporation Grades
This table shows the most recent grades and rating actions from established firms for Ameren Corporation.
| Grading Company | Action | New Grade | Date |
|---|---|---|---|
| UBS | Maintain | Buy | 2025-12-17 |
| Keybanc | Downgrade | Sector Weight | 2025-12-12 |
| Mizuho | Maintain | Outperform | 2025-10-27 |
| Morgan Stanley | Maintain | Equal Weight | 2025-10-22 |
| Barclays | Maintain | Equal Weight | 2025-10-21 |
| Keybanc | Maintain | Overweight | 2025-10-15 |
| Morgan Stanley | Maintain | Equal Weight | 2025-09-25 |
| Keybanc | Maintain | Overweight | 2025-07-16 |
| UBS | Maintain | Buy | 2025-07-11 |
| Barclays | Maintain | Equal Weight | 2025-07-10 |
Overall, Ameren Corporation’s grades mostly range from Equal Weight to Buy, with some downgrades to Sector Weight, indicating a generally cautious but positive outlook from analysts.
Alliant Energy Corporation Grades
Below is a summary of recent grades and rating actions from credible grading companies for Alliant Energy Corporation.
| Grading Company | Action | New Grade | Date |
|---|---|---|---|
| Argus Research | Downgrade | Hold | 2026-01-09 |
| UBS | Maintain | Buy | 2025-12-17 |
| UBS | Upgrade | Buy | 2025-10-24 |
| B of A Securities | Maintain | Buy | 2025-10-17 |
| BMO Capital | Maintain | Market Perform | 2025-10-17 |
| Barclays | Maintain | Underweight | 2025-10-14 |
| UBS | Maintain | Neutral | 2025-10-10 |
| B of A Securities | Maintain | Buy | 2025-08-14 |
| BMO Capital | Maintain | Market Perform | 2025-08-11 |
| UBS | Maintain | Neutral | 2025-07-11 |
The grading trend for Alliant Energy Corporation is mixed, with ratings spanning from Underweight to Buy, reflecting a diverse range of analyst opinions.
Which company has the best grades?
Alliant Energy Corporation has received a slightly stronger consensus with more Buy ratings compared to Ameren Corporation’s Hold consensus. This disparity may influence investor perception by implying a more favorable outlook for Alliant Energy, although both companies show some analyst caution.
Strengths and Weaknesses
Here is a comparative overview of key strengths and weaknesses for Ameren Corporation (AEE) and Alliant Energy Corporation (LNT) based on their latest financial and operational data:
| Criterion | Ameren Corporation (AEE) | Alliant Energy Corporation (LNT) |
|---|---|---|
| Diversification | Strong focus on electricity (6.54B) and natural gas (1.08B), moderate product diversification | Primarily electric revenue (3.37B) with smaller gas and other utility segments, less diversified |
| Profitability | Net margin 15.5% (favorable); ROIC 3.32% (unfavorable, below WACC 5.19%) | Net margin 17.3% (favorable); ROIC 4.88% (unfavorable, below WACC 5.91%) |
| Innovation | Limited data on innovation; declining ROIC suggests challenges in value creation | Stable ROIC trend but also below cost of capital; innovation impact unclear |
| Global presence | Primarily regional US utility operations; limited global footprint | Similar regional focus with no significant global presence |
| Market Share | Large electricity segment, strong regional utility market share | Smaller scale but growing electric segment, steady market share growth |
Key takeaways: Both companies operate mainly in regional utility markets with similar business models. Ameren shows a stronger revenue base and diversification between electricity and gas, but both face challenges in creating economic value as their ROIC remains below their WACC. Profitability margins are solid, yet declining or stagnant returns on invested capital warrant caution for investors focusing on value creation.
Risk Analysis
Below is a comparative table highlighting key risk metrics for Ameren Corporation (AEE) and Alliant Energy Corporation (LNT) as of 2024:
| Metric | Ameren Corporation (AEE) | Alliant Energy Corporation (LNT) |
|---|---|---|
| Market Risk | Beta 0.59 (low volatility) | Beta 0.67 (low volatility) |
| Debt level | Debt-to-Equity 1.55 (unfavorable) | Debt-to-Equity 1.49 (unfavorable) |
| Regulatory Risk | High (regulated electric sector) | High (regulated electric sector) |
| Operational Risk | Moderate (diversified generation) | Moderate (diversified generation) |
| Environmental Risk | Moderate (coal, nuclear, renewables mix) | Moderate (natural gas, wind, renewables) |
| Geopolitical Risk | Low (US-based operations) | Low (US-based operations) |
The most impactful risks for both companies stem from their significant debt levels and heavy regulation in the utility sector. Ameren’s slightly higher debt and lower liquidity ratios suggest greater financial strain, while both face operational challenges transitioning to cleaner energy amid environmental regulations. Market volatility remains low, but debt management and regulatory compliance are critical for sustainable investment.
Which Stock to Choose?
Ameren Corporation (AEE) shows a generally favorable income statement with steady revenue and net income growth over 2020-2024, though recent revenue growth is slightly unfavorable. Its financial ratios are mixed, with strong net margin and dividend yield but unfavorable returns on equity and invested capital, and relatively high debt levels. The company’s MOAT is very unfavorable due to declining ROIC below WACC, and its rating is very favorable overall despite moderate scores on some metrics.
Alliant Energy Corporation (LNT) presents an unfavorable income statement trend in recent years, with negative revenue and EBIT growth but positive overall income growth since 2020. Its financial ratios parallel AEE’s, showing favorable net margin and dividend yield but unfavorable leverage and valuation ratios. LNT’s MOAT is unfavorable with ROIC below WACC but stable, and its rating is also very favorable, though with several moderate to very unfavorable sub-scores.
For investors focused on growth and positive income trends, Ameren Corporation may appear more appealing due to its favorable income statement and stronger recent profitability metrics. Conversely, investors prioritizing stability amid less volatile asset turnover and a steadier MOAT trend might find Alliant Energy Corporation a more suitable consideration given its stable but less dynamic financial profile.
Disclaimer: Investment carries a risk of loss of initial capital. The past performance is not a reliable indicator of future results. Be sure to understand risks before making an investment decision.
Go Further
I encourage you to read the complete analyses of Ameren Corporation and Alliant Energy Corporation to enhance your investment decisions: