Home > Comparison > Healthcare > SYK vs ALGN
The strategic rivalry between Stryker Corporation and Align Technology defines the current trajectory of the healthcare medical devices sector. Stryker operates as a diversified medical technology giant with a broad portfolio spanning orthopaedics and neurotechnology. In contrast, Align Technology focuses on innovative clear aligners and digital scanning solutions, emphasizing high-margin, tech-driven orthodontics. This analysis will determine which company’s strategic path offers the superior risk-adjusted return for a diversified portfolio in this evolving industry.
Table of contents
Companies Overview
Stryker Corporation and Align Technology, Inc. both command significant roles in the medical devices sector, shaping healthcare innovation globally.
Stryker Corporation: Orthopaedic and Surgical Innovation Leader
Stryker dominates with a diversified medical technology portfolio, splitting revenues between Orthopaedics and MedSurg segments. It generates most sales from implants for joint replacements and spinal surgeries. In 2026, Stryker focuses strategically on expanding minimally invasive and neurotechnology products to enhance surgical outcomes and broaden its clinical footprint.
Align Technology, Inc.: Clear Aligner and Digital Dentistry Pioneer
Align Technology leads in orthodontic clear aligners and intraoral scanning. Its revenue derives primarily from Invisalign products and iTero scanners, catering to orthodontists and dentists. For 2026, Align sharpens its strategy on advancing digital scanning services and expanding treatment products for younger patients, pushing innovation in non-invasive orthodontic care.
Strategic Collision: Similarities & Divergences
Both firms excel in medical device innovation but diverge in scope—Stryker offers broad surgical solutions, while Align specializes in orthodontics and digital dentistry. Their primary battleground lies in technological leadership within medical specialties. Investors face distinct profiles: Stryker’s scale and diversification contrast with Align’s niche growth and higher volatility.
Income Statement Comparison
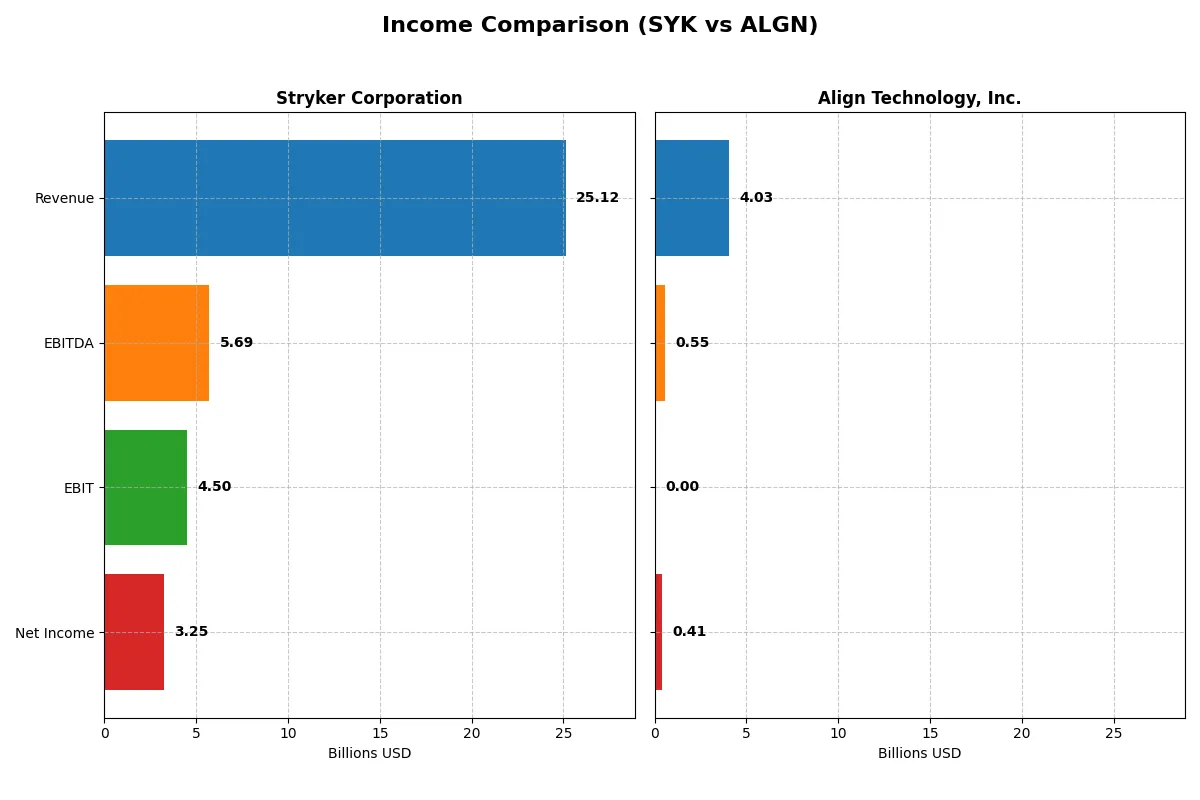
This data dissects the core profitability and scalability of both corporate engines to reveal who dominates the bottom line:
| Metric | Stryker Corporation (SYK) | Align Technology, Inc. (ALGN) |
|---|---|---|
| Revenue | 25.1B | 4.0B |
| Cost of Revenue | 9.7B | 1.3B |
| Operating Expenses | 9.8B | 2.1B |
| Gross Profit | 15.4B | 2.7B |
| EBITDA | 5.7B | 546M |
| EBIT | 4.5B | 0 |
| Interest Expense | 0 | 0 |
| Net Income | 3.2B | 410M |
| EPS | 8.49 | 5.66 |
| Fiscal Year | 2025 | 2025 |
Income Statement Analysis: The Bottom-Line Duel
This income statement comparison reveals which company operates more efficiently and generates stronger profitability from its revenue base.
Stryker Corporation Analysis
Stryker’s revenue rose from $17.1B in 2021 to $25.1B in 2025, showing solid growth momentum. Its gross margin stays robust at 61.4%, and despite a slight dip in net margin to 12.9%, the company’s EBIT margin of 17.9% signals healthy operational efficiency. The 2025 year highlights strong earnings growth and disciplined expense management.
Align Technology, Inc. Analysis
Align’s revenue stagnated near $4B between 2021 and 2025, with a negligible 0.9% growth in the latest year. A high gross margin of 67.2% contrasts sharply with a zero EBIT margin in 2025, reflecting operational challenges. The company’s net margin dropped to 10.2%, accompanied by negative trends in net income and EPS over the period, indicating weakening profitability.
Margin Strength vs. Growth Trajectory
Stryker clearly outperforms Align in both revenue growth and profitability, boasting superior margins and consistent earnings expansion. Align’s stagnant revenue and collapsing EBIT margin mark fundamental concerns. For investors, Stryker’s profile offers stronger growth paired with operational resilience, making it the more attractive fundamental choice.
Financial Ratios Comparison
These vital ratios act as a diagnostic tool to expose underlying fiscal health, valuation premiums, and capital efficiency for the companies compared below:
| Ratios | Stryker Corporation (SYK) | Align Technology, Inc. (ALGN) |
|---|---|---|
| ROE | 14.5% | 10.9% |
| ROIC | 7.4% | 10.0% |
| P/E | 41.4 | 37.1 |
| P/B | 6.0 | 4.1 |
| Current Ratio | 1.89 | 1.22 |
| Quick Ratio | 1.21 | 1.10 |
| D/E | 0.66 | 0.03 |
| Debt-to-Assets | 31.1% | 1.9% |
| Interest Coverage | 0 | 0 |
| Asset Turnover | 0.52 | 0.64 |
| Fixed Asset Turnover | 6.48 | 2.89 |
| Payout ratio | 39.6% | 0% |
| Dividend yield | 0.96% | 0% |
| Fiscal Year | 2025 | 2024 |
Efficiency & Valuation Duel: The Vital Signs
Financial ratios serve as a company’s DNA, uncovering hidden risks and highlighting operational strengths critical to investment decisions.
Stryker Corporation
Stryker shows a solid net margin of 12.92%, with ROE at 14.48% signaling moderate profitability. Its P/E ratio at 41.38 suggests the stock trades at a premium, possibly stretched. The company offers a modest 0.96% dividend yield, balancing shareholder returns with reinvestment in R&D to sustain growth.
Align Technology, Inc.
Align reports a respectable net margin of 10.54% and a lower ROE of 10.94%. Its P/E ratio of 37.05 also indicates an expensive valuation but slightly more reasonable than Stryker. Align pays no dividends, instead reinvesting heavily in research and development to fuel future expansion.
Premium Valuation vs. Operational Safety
Stryker commands a higher valuation but demonstrates a slightly stronger balance of profitability and stable shareholder returns. Align’s lower leverage and reinvestment focus appeal to growth-oriented investors. The choice depends on tolerance for premium pricing versus a growth-driven profile.
Which one offers the Superior Shareholder Reward?
I observe Stryker Corporation (SYK) pays a steady dividend with a ~0.96% yield and a sustainable 40% payout ratio, backed by solid free cash flow coverage. Its consistent buyback program complements shareholder returns. Align Technology (ALGN) reinvests all cash into growth, with no dividends but strong free cash flow and zero debt, fueling aggressive R&D and expansion. Historically, SYK’s balanced distribution suits income-focused investors, while ALGN’s growth reinvestment targets capital appreciation. In 2026, I favor SYK for total return due to dividend income plus buybacks, offering less risk than ALGN’s all-growth strategy.
Comparative Score Analysis: The Strategic Profile
The radar chart reveals the fundamental DNA and trade-offs of Stryker Corporation and Align Technology, Inc., highlighting their financial strengths and valuation approaches:
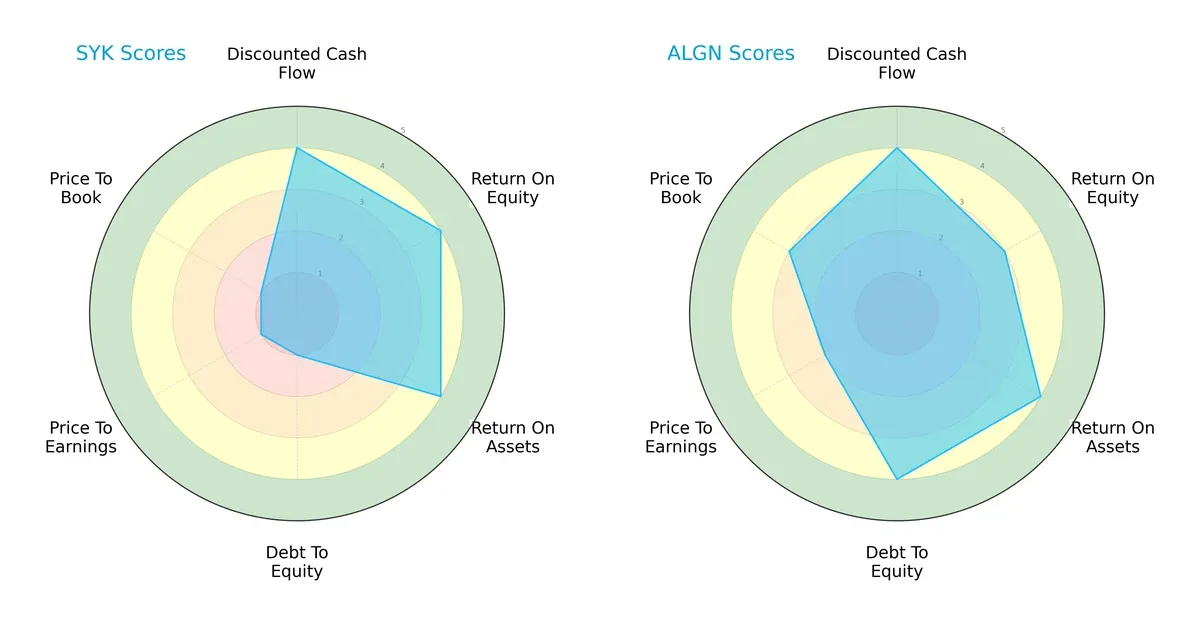
Stryker excels in profitability with top ROE and ROA scores but struggles with financial leverage and valuation metrics, showing weak debt and price ratios. Align presents a more balanced profile, maintaining strong debt management and moderate valuation scores, though its ROE trails slightly. Align’s diversified financial strength contrasts with Stryker’s reliance on operational efficiency.
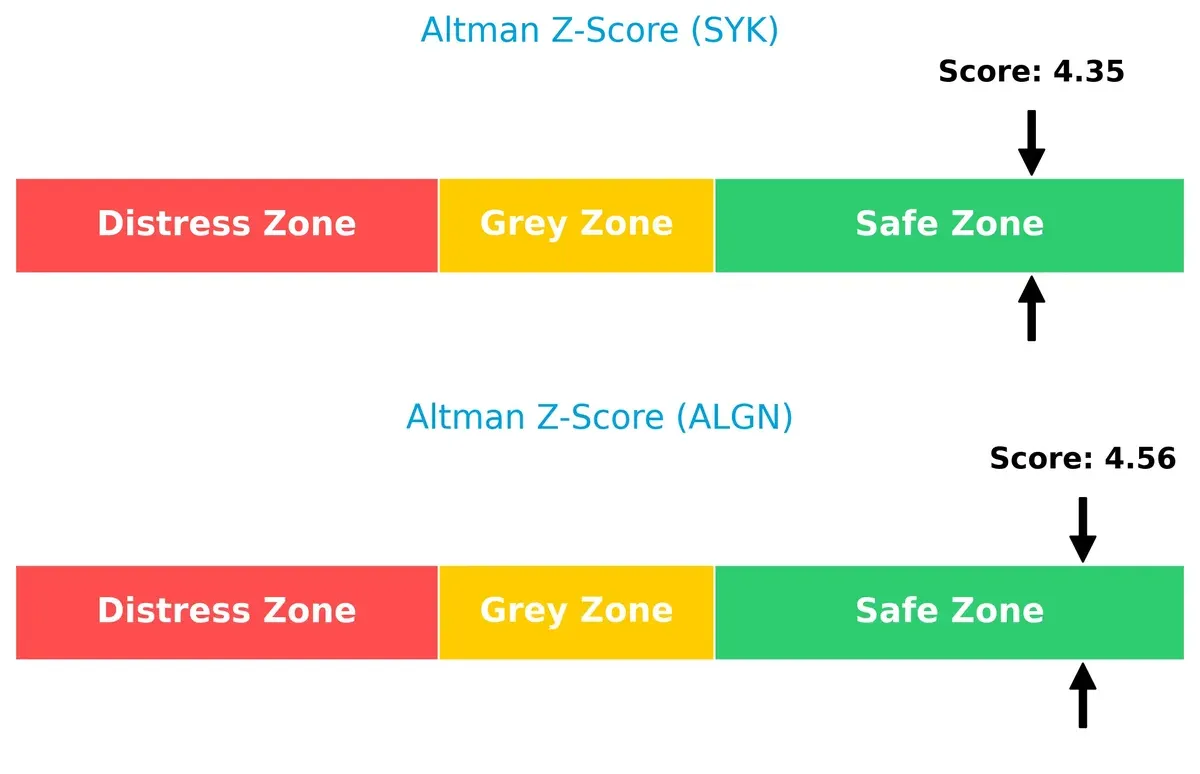
Bankruptcy Risk: Solvency Showdown
The Altman Z-Score comparison shows both firms firmly in the safe zone, with Align slightly ahead, suggesting superior financial resilience for long-term survival in this cycle:
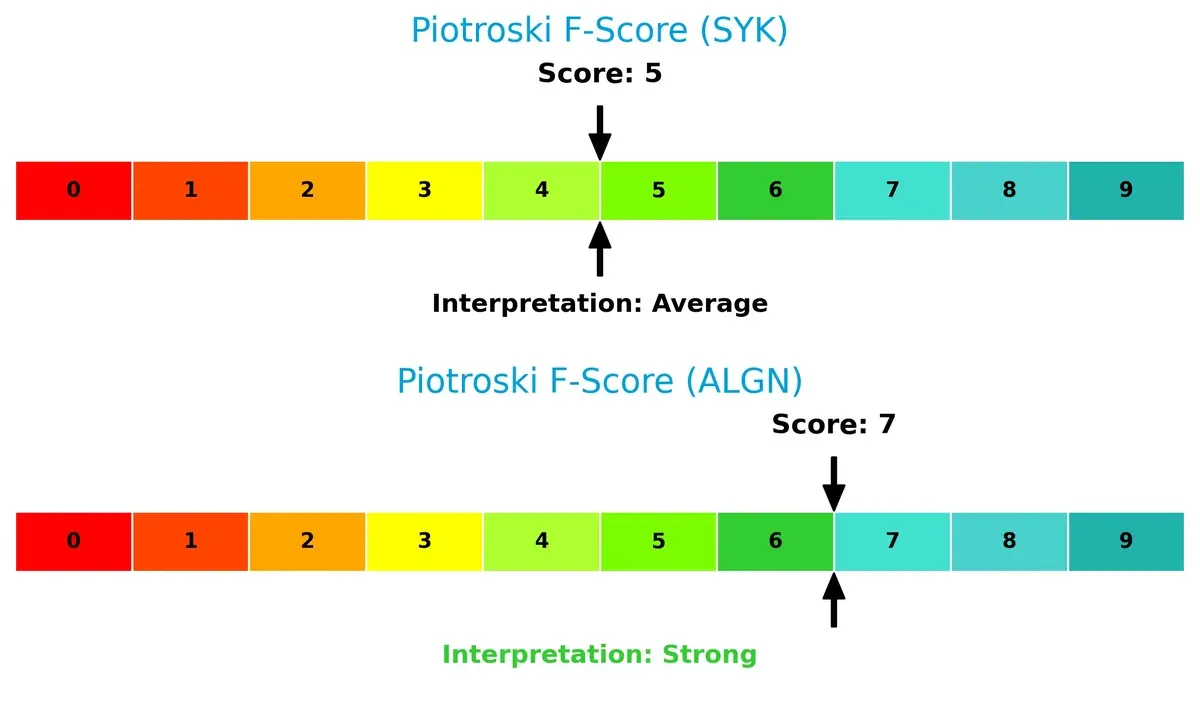
Financial Health: Quality of Operations
Align’s Piotroski F-Score of 7 signals strong operational health and fewer red flags, outperforming Stryker’s average score of 5, which indicates moderate internal financial strength:
How are the two companies positioned?
This section dissects the operational DNA of Stryker and Align by comparing their revenue distribution and internal strengths and weaknesses. The goal is to confront their economic moats to reveal which business model offers the most resilient and sustainable competitive advantage today.
Revenue Segmentation: The Strategic Mix
This visual comparison dissects how Stryker Corporation and Align Technology diversify their income streams and where their primary sector bets lie:
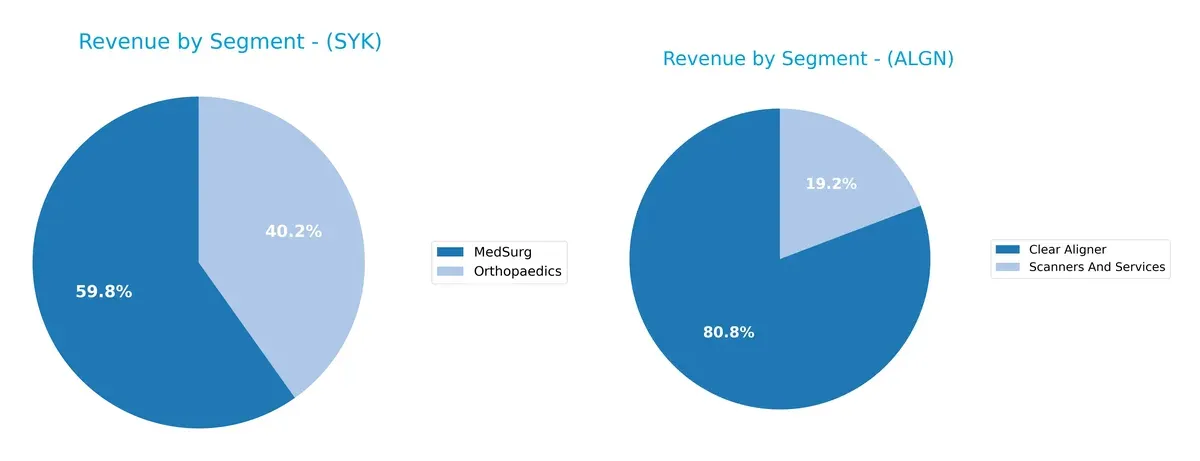
Stryker dominates with a more balanced mix, generating $13.5B in MedSurg and $9.1B in Orthopaedics. Align pivots heavily on Clear Aligners at $3.2B, with Scanners and Services trailing at $770M. Stryker’s diversified portfolio reduces concentration risk and anchors its ecosystem lock-in. Align’s reliance on a dominant segment exposes it to market shifts but leverages infrastructure dominance in dental tech.
Strengths and Weaknesses Comparison
This table compares the Strengths and Weaknesses of Stryker Corporation and Align Technology, Inc.:
Stryker Corporation Strengths
- High net margin at 12.92%
- Favorable current and quick ratios indicate strong liquidity
- Diverse revenue streams from MedSurg and Orthopaedics
- Global presence with significant US, EMEA, and Asia Pacific sales
Align Technology, Inc. Strengths
- Favorable net margin of 10.54%
- Very low debt-to-equity and debt-to-assets ratios indicate conservative leverage
- Innovation focus on Clear Aligners and Scanners
- Presence in US, Switzerland, and growing international markets
Stryker Corporation Weaknesses
- High PE and PB ratios suggest overvaluation risk
- Dividend yield below 1% may deter income investors
- ROIC slightly below WACC signals neutral capital efficiency
- Moderate debt levels limit financial flexibility
Align Technology, Inc. Weaknesses
- Unfavorable interest coverage ratio signals potential risk servicing debt
- Zero dividend yield offers no income return
- Lack of available WACC data limits capital efficiency analysis
- PE and PB ratios also on the high side
Stryker shows strength in diversified product lines and global scale with solid liquidity, but faces valuation and capital efficiency challenges. Align benefits from low leverage and innovation but must address debt servicing risks and valuation concerns. Both companies’ profiles suggest strategic focus areas to improve financial robustness.
The Moat Duel: Analyzing Competitive Defensibility
A structural moat alone shields long-term profits from relentless competition erosion. Let’s dissect the sources of defensibility for these two medical device leaders:
Stryker Corporation: Diversified Product Portfolio Moat
Stryker leverages broad product diversification and deep hospital relationships as its moat. Its stable gross margin of 61.4% and favorable revenue growth of 11.2% reflect solid pricing power. Yet, a declining ROIC signals weakening capital efficiency, threatening moat durability in 2026.
Align Technology, Inc.: Innovation-Driven Niche Moat
Align’s moat stems from proprietary clear aligner technology and digital orthodontic ecosystem. Despite stronger gross margin at 67.2%, recent revenue growth falters at 0.9%, and EBIT margins vanished. Declining ROIC trends hint at pressure but continued innovation could revive competitive edge.
Verdict: Diversification Resilience vs. Innovation Vulnerability
Stryker’s diversified portfolio offers a wider moat than Align’s niche-focused innovation, despite both facing declining ROIC trends. Stryker appears better equipped to defend market share amid intensifying competition in 2026.
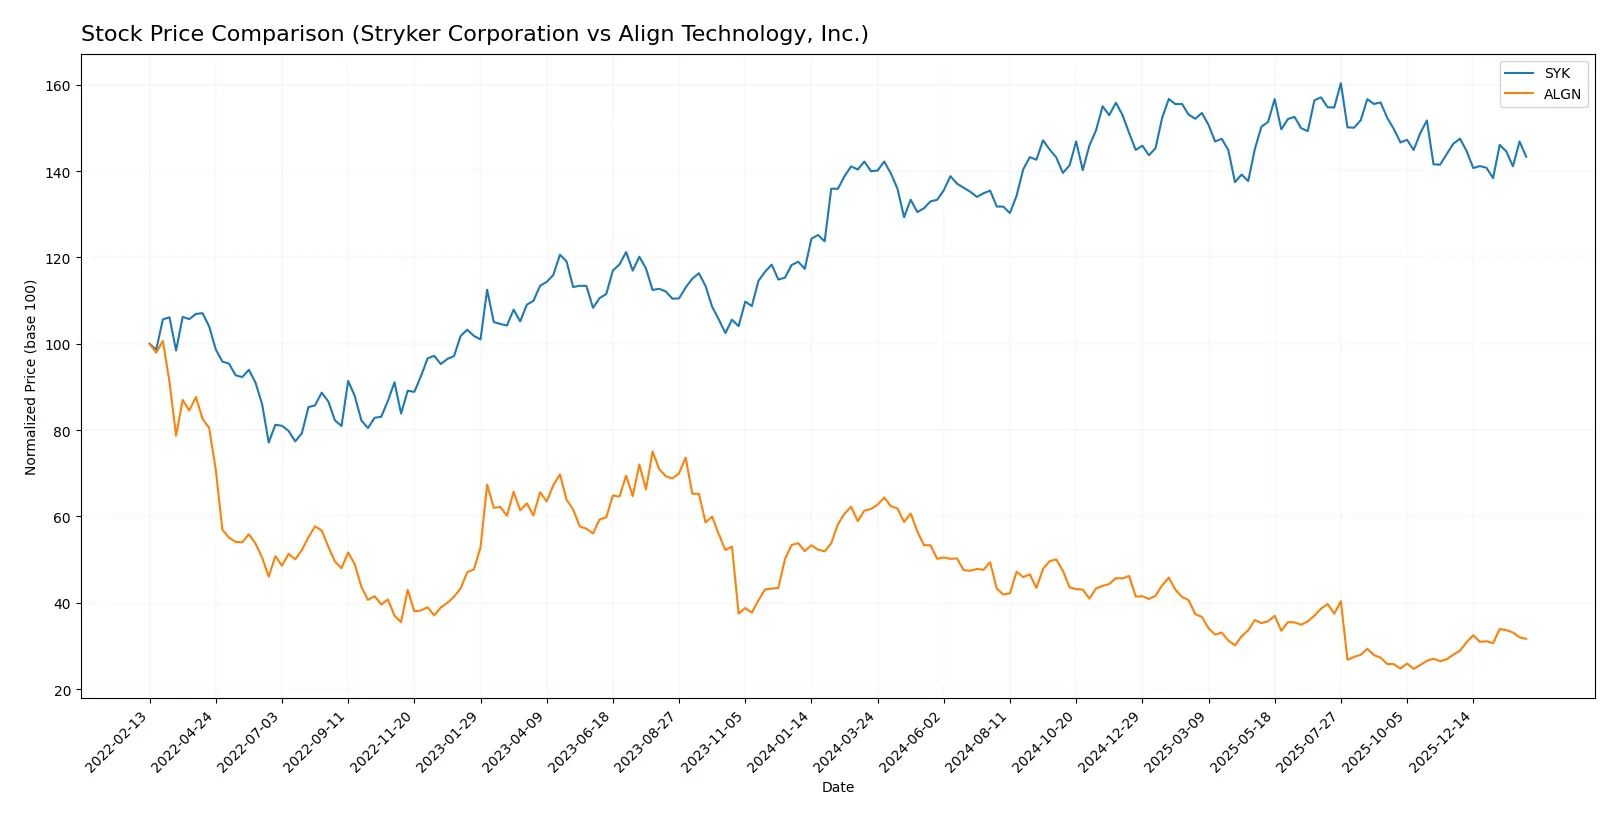
Which stock offers better returns?
The past year shows divergent stock price movements: Stryker Corporation edges higher with decelerating gains, while Align Technology suffers a sharp decline but gains some recent upward momentum.
Trend Comparison
Stryker’s stock rose 2.39% over the past 12 months, marking a bullish trend with decelerating price gains. Its price ranged between 325.43 and 403.53, reflecting moderate volatility.
Align Technology’s stock fell 48.69% in the same period, confirming a strong bearish trend with accelerating losses. The price fluctuated widely, from a low of 125.79 to a high of 327.92.
Stryker delivered the highest market performance over 12 months, showing modest gains. Align’s significant decline outweighs its recent short-term rebound in the last two and a half months.
Target Prices
Analysts present a cautiously optimistic consensus for both Stryker Corporation and Align Technology, highlighting moderate upside potential.
| Company | Target Low | Target High | Consensus |
|---|---|---|---|
| Stryker Corporation | 390 | 469 | 425.58 |
| Align Technology, Inc. | 140 | 200 | 176.43 |
Stryker’s consensus target of 425.58 implies roughly 18% upside from its current 360.66 price. Align Technology’s target of 176.43 suggests about 9% potential gain from 161.3.

Don’t Let Luck Decide Your Entry Point
Optimize your entry points with our advanced ProRealTime indicators. You’ll get efficient buy signals with precise price targets for maximum performance. Start outperforming now!
How do institutions grade them?
Stryker Corporation Grades
The following table shows recent institutional grades for Stryker Corporation.
| Grading Company | Action | New Grade | Date |
|---|---|---|---|
| BTIG | Maintain | Buy | 2026-01-30 |
| Needham | Maintain | Buy | 2026-01-30 |
| Bernstein | Maintain | Outperform | 2026-01-09 |
| Citizens | Upgrade | Market Outperform | 2025-12-19 |
| Truist Securities | Maintain | Hold | 2025-12-18 |
| Citigroup | Maintain | Buy | 2025-12-11 |
| Needham | Maintain | Buy | 2025-11-14 |
| Truist Securities | Maintain | Hold | 2025-11-14 |
| Wells Fargo | Maintain | Overweight | 2025-11-14 |
| BTIG | Maintain | Buy | 2025-11-14 |
Align Technology, Inc. Grades
The following table shows recent institutional grades for Align Technology, Inc.
| Grading Company | Action | New Grade | Date |
|---|---|---|---|
| Mizuho | Maintain | Outperform | 2026-01-20 |
| Piper Sandler | Maintain | Overweight | 2025-10-30 |
| Morgan Stanley | Maintain | Equal Weight | 2025-10-30 |
| Wells Fargo | Maintain | Overweight | 2025-10-30 |
| Evercore ISI Group | Maintain | Outperform | 2025-10-30 |
| Morgan Stanley | Maintain | Equal Weight | 2025-10-21 |
| UBS | Maintain | Neutral | 2025-10-16 |
| Mizuho | Maintain | Outperform | 2025-10-13 |
| Jefferies | Downgrade | Hold | 2025-10-10 |
| Evercore ISI Group | Maintain | Outperform | 2025-10-08 |
Which company has the best grades?
Stryker Corporation consistently receives Buy and Outperform ratings, including a recent upgrade to Market Outperform. Align Technology shows more mixed grades, including Equal Weight and Hold. Investors may view Stryker’s stronger consensus as a positive signal.
Risks specific to each company
In the challenging 2026 market environment, these categories highlight critical pressure points and systemic threats facing both Stryker Corporation and Align Technology, Inc.:
1. Market & Competition
Stryker Corporation
- Dominates diversified medical devices with strong brand and broad product portfolio.
Align Technology, Inc.
- Faces intense competition in clear aligners; innovation pace critical for market share.
2. Capital Structure & Debt
Stryker Corporation
- Moderate debt-to-equity ratio (0.66) with strong interest coverage signals controlled leverage.
Align Technology, Inc.
- Extremely low debt (0.03 D/E) but zero interest coverage raises concerns on earnings to cover debt costs.
3. Stock Volatility
Stryker Corporation
- Beta of 0.87 indicates lower volatility than market, offering relative stability.
Align Technology, Inc.
- High beta of 1.83 signals elevated stock price swings and higher investor risk.
4. Regulatory & Legal
Stryker Corporation
- Faces complex regulations across multiple device categories; compliance costs substantial.
Align Technology, Inc.
- Regulatory scrutiny focuses on orthodontic device safety and digital health compliance.
5. Supply Chain & Operations
Stryker Corporation
- Global supply chain complexity risks disruptions but benefits from scale and redundancy.
Align Technology, Inc.
- Supply chain more streamlined but sensitive to component shortages impacting device production.
6. ESG & Climate Transition
Stryker Corporation
- Increasing ESG commitments; managing energy use and waste in manufacturing is challenging.
Align Technology, Inc.
- Strong ESG initiatives in digital health reduction of physical waste, but scope for improvement remains.
7. Geopolitical Exposure
Stryker Corporation
- Operations in 75 countries expose it to diverse geopolitical risks and trade tensions.
Align Technology, Inc.
- More concentrated market exposure with risks from US-China trade relations impacting supply chain.
Which company shows a better risk-adjusted profile?
Stryker’s most impactful risk lies in its complex global supply chain vulnerable to geopolitical tensions. Align’s key risk is its high stock volatility driven by competitive pressures and earnings uncertainty. On balance, Stryker offers a better risk-adjusted profile with lower market volatility, stronger interest coverage, and diversified operations. Recent financial data shows Stryker’s stable debt management and robust Altman Z-Score (4.35) contrast with Align’s zero interest coverage and higher beta, reinforcing my caution towards Align’s elevated risk despite its strong Piotroski score.
Final Verdict: Which stock to choose?
Stryker Corporation’s superpower lies in its robust operational efficiency and strong cash flow generation, making it a resilient player in medical devices. Its key point of vigilance is a declining return on invested capital, signaling potential value erosion. It fits well in portfolios targeting steady, long-term growth with moderate risk tolerance.
Align Technology’s strategic moat centers on its innovative digital orthodontics platform and recurring revenue streams, offering a competitive edge. It presents a safer balance sheet with low debt levels compared to Stryker. Align suits investors seeking growth at a reasonable price, blending innovation with financial prudence.
If you prioritize operational resilience and consistent cash flow, Stryker outshines with its established market presence and efficiency. However, if you seek innovation-driven growth with stronger balance sheet safety, Align offers better stability and a compelling growth moat despite recent volatility. Each appeals to distinct investor archetypes balancing growth and risk.
Disclaimer: Investment carries a risk of loss of initial capital. The past performance is not a reliable indicator of future results. Be sure to understand risks before making an investment decision.
Go Further
I encourage you to read the complete analyses of Stryker Corporation and Align Technology, Inc. to enhance your investment decisions: