Home > Comparison > Healthcare > MDT vs ALGN
The strategic rivalry between Medtronic plc and Align Technology defines the evolving landscape of the medical devices sector. Medtronic operates as a diversified healthcare giant with a broad portfolio spanning cardiovascular to neuroscience therapies. In contrast, Align Technology focuses on high-growth, innovative orthodontic devices and digital scanning solutions. This analysis will determine which company’s trajectory offers superior risk-adjusted returns for a diversified healthcare portfolio.
Table of contents
Companies Overview
Medtronic and Align Technology both shape the competitive landscape of the medical devices industry.
Medtronic plc: Global Medical Device Powerhouse
Medtronic dominates healthcare with its diverse medical device portfolio, including cardiac devices, surgical instruments, and diabetes care products. Its revenue engine relies on selling advanced therapies to healthcare providers worldwide. In 2026, the company emphasizes innovation in robotic-assisted surgery and remote patient monitoring, blending technology with clinical care to maintain its market leadership.
Align Technology, Inc.: Orthodontic Innovation Leader
Align Technology specializes in clear aligners and digital scanning solutions for orthodontists and dentists. Its core revenue derives from Invisalign treatments and iTero scanners, which revolutionize dental care with precision and convenience. The firm focuses on expanding its digital orthodontic ecosystem, enhancing treatment customization and software services to capture growing demand in aesthetic dentistry.
Strategic Collision: Similarities & Divergences
Both companies excel in medical device innovation but differ in scope—Medtronic offers a broad, multispecialty portfolio while Align targets niche orthodontic markets with digital precision. They primarily compete over technological adoption in clinical settings. Medtronic’s scale contrasts with Align’s agility, defining distinct investment profiles driven by diversified resilience versus focused growth potential.
Income Statement Comparison
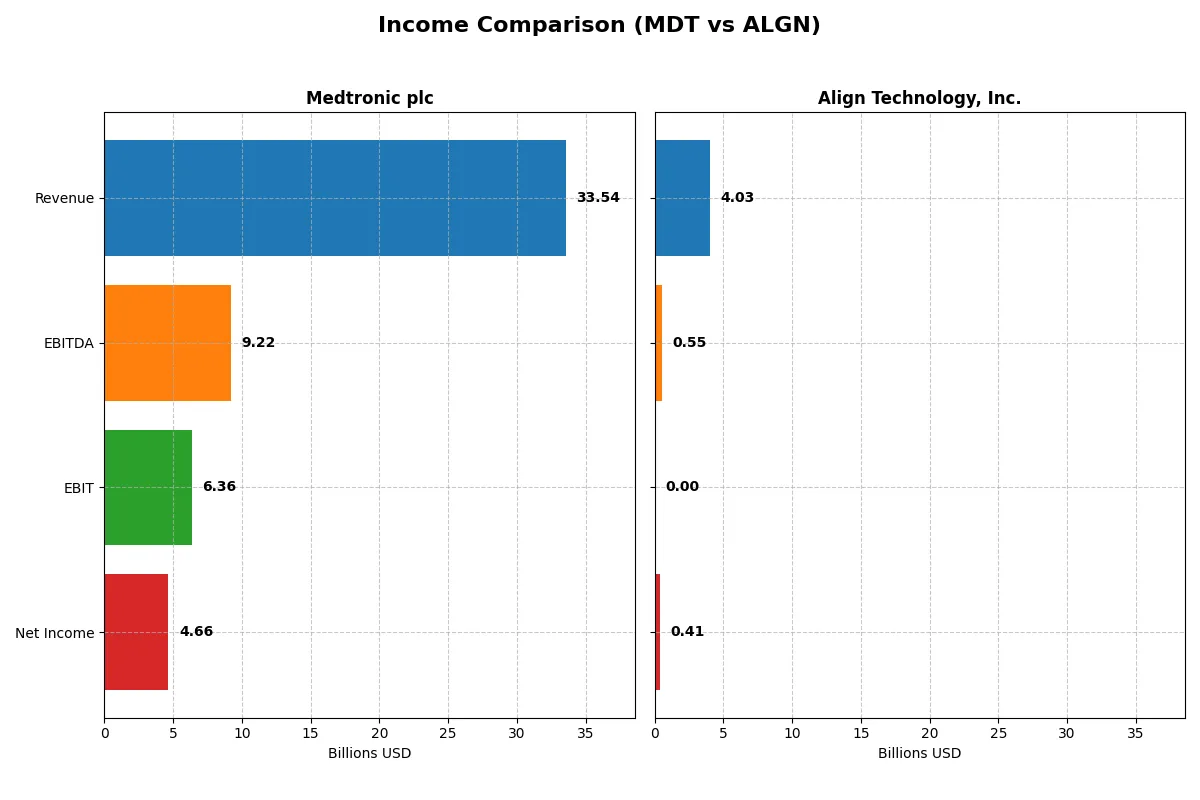
The following data dissects the core profitability and scalability of both corporate engines to reveal who dominates the bottom line:
| Metric | Medtronic plc (MDT) | Align Technology, Inc. (ALGN) |
|---|---|---|
| Revenue | 33.5B | 4.0B |
| Cost of Revenue | 11.6B | 1.3B |
| Operating Expenses | 15.9B | 2.1B |
| Gross Profit | 21.9B | 2.7B |
| EBITDA | 9.2B | 546M |
| EBIT | 6.4B | 0 |
| Interest Expense | 729M | 0 |
| Net Income | 4.7B | 410M |
| EPS | 3.63 | 5.66 |
| Fiscal Year | 2025 | 2025 |
Income Statement Analysis: The Bottom-Line Duel
This income statement comparison reveals which company operates its financial engine with superior efficiency and sustainable momentum.
Medtronic plc Analysis
Medtronic’s revenue steadily grew from 30.1B in 2021 to 33.5B in 2025, alongside a net income rise from 3.6B to 4.7B. Gross margins remain robust at 65.3%, while net margins expanded favorably to 13.9%. The 2025 fiscal year shows strong operational leverage, with EBIT growing 14.4% and EPS surging 30.8%.
Align Technology, Inc. Analysis
Align’s revenue hovered around 4B between 2021 and 2025 but showed marginal 0.9% growth in the last year. Gross margin stands slightly higher than Medtronic at 67.2%, yet EBIT margin collapsed to zero in 2025. Net income declined sharply by 46.9% over five years, reflecting weakening profitability and negative margin trends.
Margin Strength vs. Growth Stability
Medtronic delivers consistent revenue growth with expanding margins and solid profitability. Align offers superior gross margins but suffers from deteriorating EBIT and net income trends. For investors, Medtronic’s profile signals a more reliable growth and margin trajectory, favoring steady returns over Align’s volatility and declining bottom-line performance.
Financial Ratios Comparison
These vital ratios act as a diagnostic tool to expose the underlying fiscal health, valuation premiums, and capital efficiency of the companies compared below:
| Ratios | Medtronic plc (MDT) | Align Technology, Inc. (ALGN) |
|---|---|---|
| ROE | 9.71% | 10.94% |
| ROIC | 6.08% | 9.99% |
| P/E | 23.37 | 37.05 |
| P/B | 2.27 | 4.05 |
| Current Ratio | 1.85 | 1.22 |
| Quick Ratio | 1.42 | 1.10 |
| D/E | 0.59 | 0.03 |
| Debt-to-Assets | 31.10% | 1.92% |
| Interest Coverage | 8.17 | 0 |
| Asset Turnover | 0.37 | 0.64 |
| Fixed Asset Turnover | 4.91 | 2.89 |
| Payout ratio | 77.0% | 0% |
| Dividend yield | 3.29% | 0% |
| Fiscal Year | 2025 | 2024 |
Efficiency & Valuation Duel: The Vital Signs
Financial ratios serve as a company’s DNA, revealing hidden risks and operational strengths investors must understand to assess true value.
Medtronic plc
Medtronic posts a solid net margin of 13.9% but a modest ROE of 9.7%, signaling moderate profitability. Its P/E of 23.4 and P/B of 2.3 show a fairly valued stock, neither stretched nor cheap. The 3.3% dividend yield reflects a shareholder-friendly policy, balancing income with steady R&D reinvestment.
Align Technology, Inc.
Align maintains a decent net margin at 10.5% and a slightly higher ROE of 10.9%, indicating efficient equity use. However, its P/E of 37.1 and P/B of 4.1 point to a richly valued stock, possibly stretched. The lack of dividends shifts focus to growth investments, especially in R&D, to fuel future expansion.
Valuation Discipline vs. Growth Ambition
Medtronic offers a more balanced profile with moderate valuation and attractive dividend yield, reducing downside risk. Align’s premium multiples highlight growth expectations but raise valuation concerns. Income-focused investors may favor Medtronic, while growth seekers may lean toward Align’s reinvestment strategy.
Which one offers the Superior Shareholder Reward?
Medtronic (MDT) combines a 3.3% dividend yield with a high payout ratio near 77%, signaling a strong commitment to returning cash. Its free cash flow comfortably covers dividends, supporting sustainability. MDT also executes steady buybacks, amplifying total returns. Align Technology (ALGN) pays no dividend but reinvests heavily in growth, with a robust free cash flow yield and aggressive buybacks. Historically, MDT’s balanced income and buyback strategy reward income-focused investors, while ALGN’s reinvestment targets capital appreciation. In 2026, I favor MDT for superior total return due to its consistent, sustainable distributions and shareholder-friendly buybacks.
Comparative Score Analysis: The Strategic Profile
The radar chart reveals the fundamental DNA and trade-offs of Medtronic plc and Align Technology, Inc., highlighting their core financial strengths and vulnerabilities:
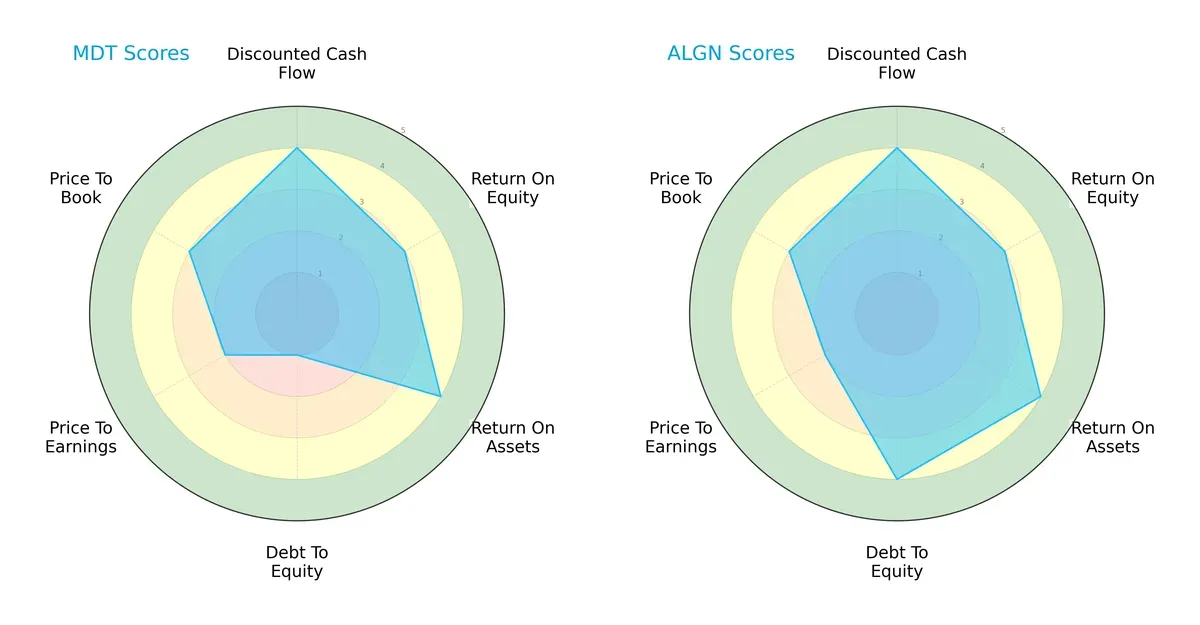
Medtronic shows a balanced cash flow and asset efficiency but struggles with a very unfavorable debt-to-equity score of 1, signaling higher leverage risk. Align maintains a superior debt profile with a score of 4, enhancing financial stability. Both share similar ROE and ROA scores at 3 and 4, respectively, but Align’s overall score of 4 edges out Medtronic’s 3, reflecting a more favorable valuation and risk balance.
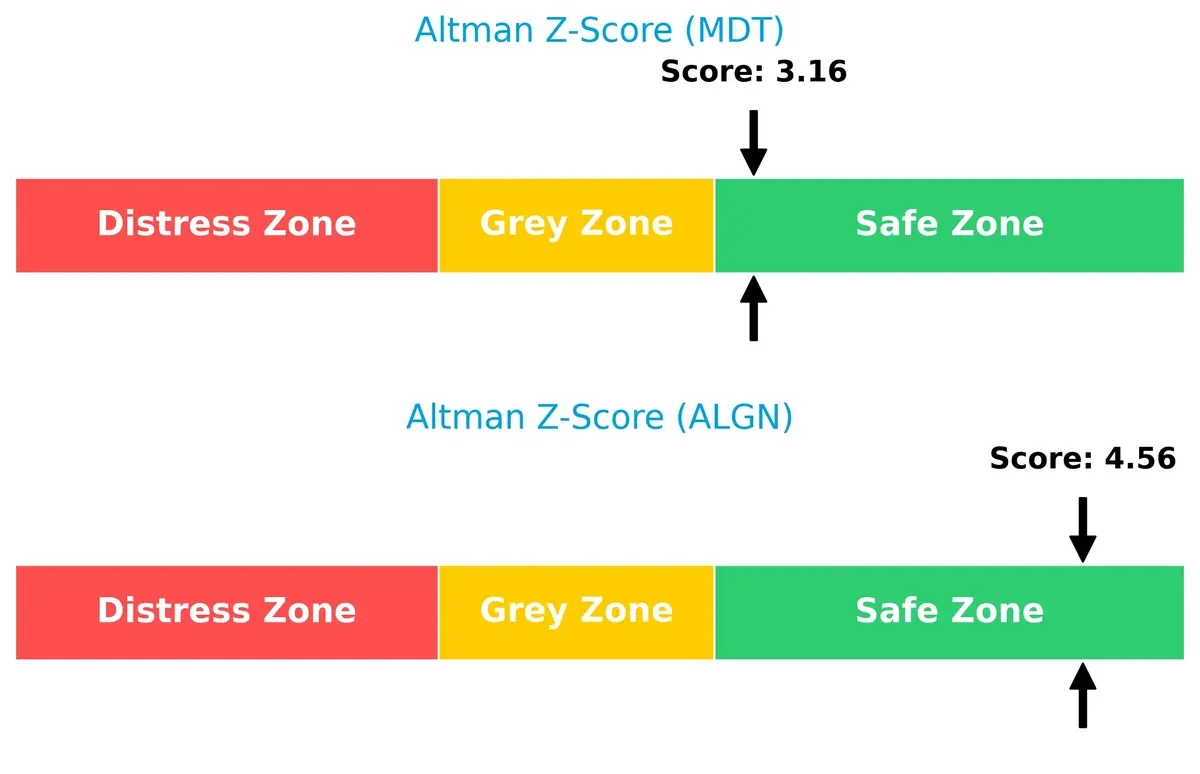
Bankruptcy Risk: Solvency Showdown
Align Technology’s Altman Z-Score of 4.56 surpasses Medtronic’s 3.16, placing both safely in the zone but showing Align’s stronger buffer against bankruptcy risk in this cycle:
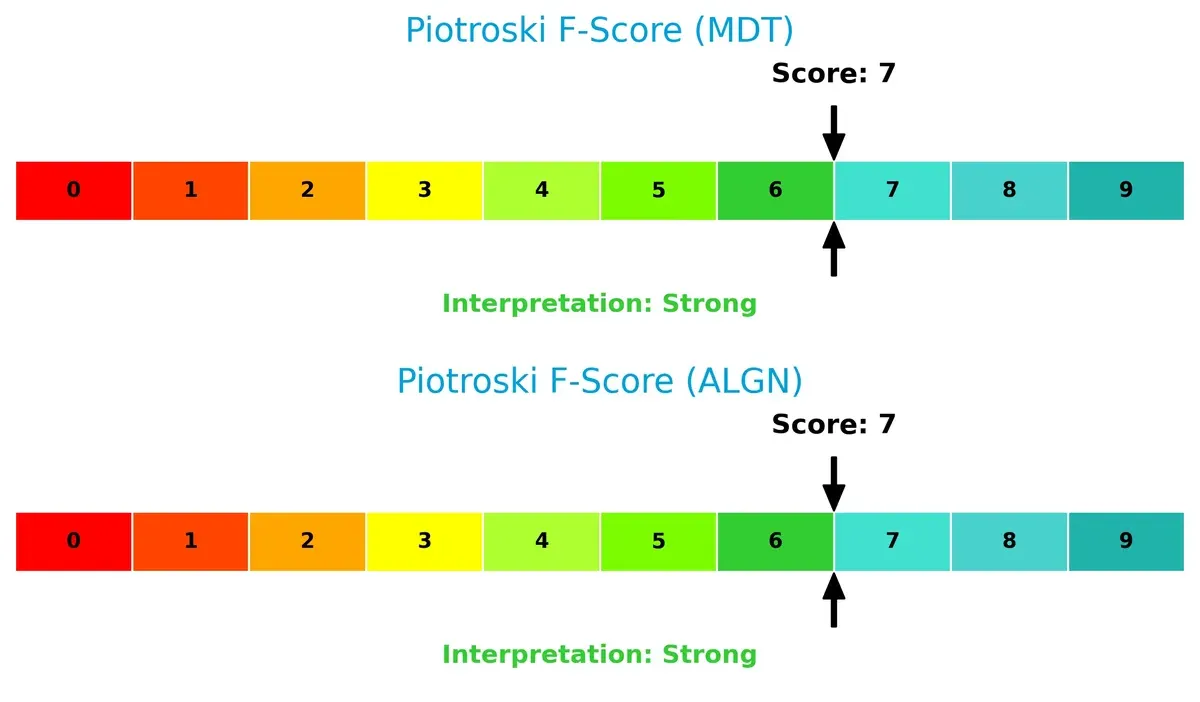
Financial Health: Quality of Operations
Both firms share a robust Piotroski F-Score of 7, indicating strong operational quality. Neither company presents red flags in internal metrics, supporting confidence in their financial health:
How are the two companies positioned?
This section dissects the operational DNA of Medtronic and Align Technology by comparing their revenue distribution and internal dynamics. The goal is to confront their economic moats and identify which model offers the most resilient, sustainable competitive advantage today.
Revenue Segmentation: The Strategic Mix
This visual comparison dissects how Medtronic plc and Align Technology, Inc. diversify their income streams and where their primary sector bets lie:
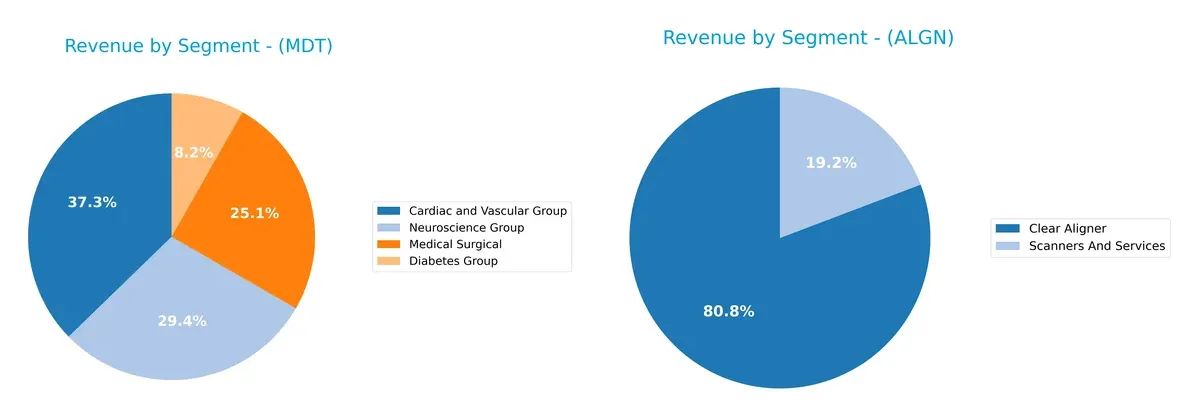
Medtronic anchors its revenue across four robust segments, with Cardiac and Vascular Group leading at $12.5B, supplemented by Neuroscience at $9.8B, Medical Surgical at $8.4B, and Diabetes at $2.8B. Align Technology pivots heavily on Clear Aligner, generating $3.2B, while Scanners and Services contribute a modest $770M. Medtronic’s diversified portfolio reduces concentration risk and signals ecosystem lock-in. Align’s reliance on a single dominant segment elevates execution risk but leverages niche market leadership.
Strengths and Weaknesses Comparison
This table compares the Strengths and Weaknesses of Medtronic plc and Align Technology, Inc.:
Medtronic plc Strengths
- Diversified revenue across four major medical segments
- Favorable net margin at 13.9%
- Strong current and quick ratios indicate solid liquidity
- Global presence with significant US and international sales
- Favorable interest coverage ratio
- Consistent dividend yield of 3.29%
Align Technology, Inc. Strengths
- Favorable net margin at 10.54%
- Low debt-to-equity and debt-to-assets show conservative leverage
- Favorable quick ratio demonstrates liquidity
- Clear Aligner strong revenue driver
- Presence in US, Switzerland, and Other International markets
- Neutral ROIC suggests efficient capital use
Medtronic plc Weaknesses
- ROE at 9.71% considered unfavorable
- Asset turnover ratio low at 0.37 indicates less efficient asset use
- PE and PB ratios neutral, no valuation edge
- Moderate debt level with D/E at 0.59
- Market share fragmented across segments
Align Technology, Inc. Weaknesses
- Higher PE and PB ratios unfavorable for valuation
- Interest coverage ratio at zero signals risk with debt servicing
- No dividend yield limits income appeal
- Limited diversification focused mainly on Clear Aligner
- Neutral asset turnover and fixed asset turnover ratios
Medtronic’s broad diversification and strong liquidity underpin its stable position but efficiency metrics warrant attention. Align shows strength in profitability and low leverage but faces valuation and capital structure risks. Both companies must navigate these factors relative to market expectations.
The Moat Duel: Analyzing Competitive Defensibility
A structural moat shields long-term profits from relentless competition erosion. It defines which firms endure and which falter:
Medtronic plc: Diversified Innovation Moat
Medtronic’s moat stems from broad product portfolios and surgical robotics, delivering stable margins and rising profitability. Expansion in AI-guided surgery deepens this moat in 2026.
Align Technology, Inc.: Niche Network Effects Moat
Align relies on proprietary Invisalign and digital scanner ecosystems. Unlike Medtronic’s scale, Align’s moat faces pressure as ROIC declines and growth slows, limiting expansion prospects.
Innovation Depth vs. Ecosystem Lock-In
Medtronic’s diversified innovation produces a wider, more resilient moat than Align’s narrowing network effects. Medtronic is better positioned to defend and grow its market share amid competitive shifts.
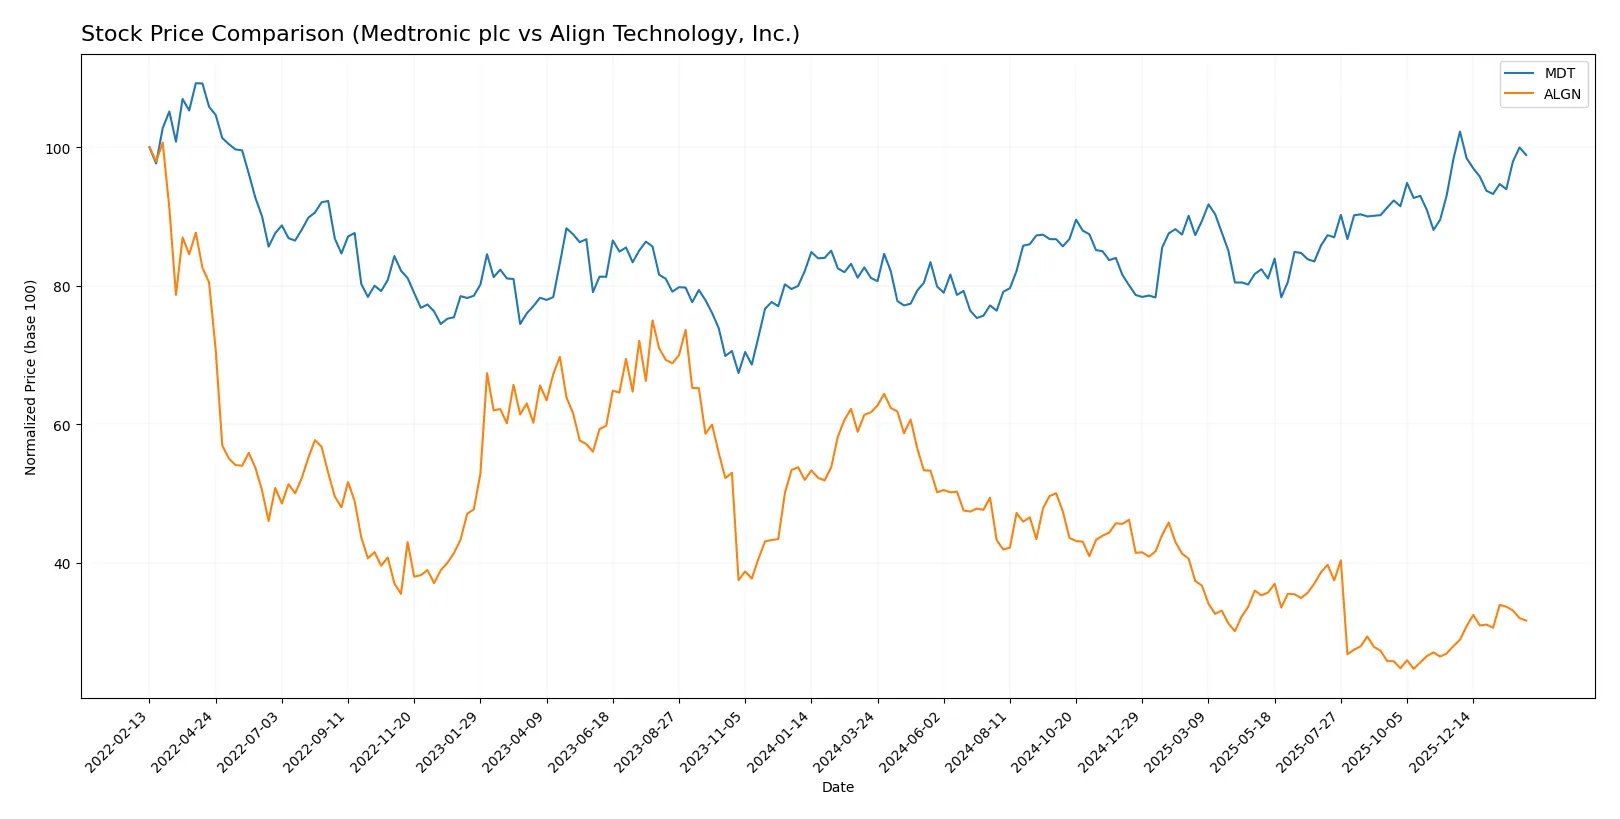
Which stock offers better returns?
Over the past year, Medtronic’s shares rose steadily, while Align Technology experienced a sharp decline with recent signs of recovery.
Trend Comparison
Medtronic’s stock gained 21.86% over the past 12 months, showing a bullish trend with decelerating momentum and moderate volatility (6.38% std deviation). The price ranged between 77.61 and 105.33.
Align Technology’s stock lost 48.69% over the same period, marking a bearish trend with accelerating decline and high volatility (50.54% std deviation). Recent months show a 13.15% rebound.
Medtronic outperformed Align Technology in market returns over the past year despite Align’s recent recovery momentum.
Target Prices
Analysts present a bullish consensus for both Medtronic plc and Align Technology, Inc.
| Company | Target Low | Target High | Consensus |
|---|---|---|---|
| Medtronic plc | 103 | 120 | 111.18 |
| Align Technology, Inc. | 140 | 200 | 176.43 |
Medtronic’s target consensus sits roughly 9% above its current price of 101.84, signaling moderate upside. Align Technology’s consensus exceeds its 161.3 price by nearly 9.5%, reflecting strong growth expectations.

Don’t Let Luck Decide Your Entry Point
Optimize your entry points with our advanced ProRealTime indicators. You’ll get efficient buy signals with precise price targets for maximum performance. Start outperforming now!
How do institutions grade them?
Medtronic plc Grades
The recent institutional grades for Medtronic plc reflect mostly positive analyst views.
| Grading Company | Action | New Grade | Date |
|---|---|---|---|
| Bernstein | Maintain | Outperform | 2026-01-09 |
| Barclays | Maintain | Overweight | 2026-01-08 |
| William Blair | Upgrade | Outperform | 2026-01-06 |
| Truist Securities | Maintain | Hold | 2025-12-18 |
| Truist Securities | Maintain | Hold | 2025-11-20 |
| Barclays | Maintain | Overweight | 2025-11-20 |
| Morgan Stanley | Maintain | Overweight | 2025-11-19 |
| Goldman Sachs | Upgrade | Neutral | 2025-11-19 |
| UBS | Maintain | Neutral | 2025-11-19 |
| Wells Fargo | Maintain | Overweight | 2025-11-19 |
Align Technology, Inc. Grades
Align Technology, Inc. has a majority of Buy-side institutional grades with some Hold ratings.
| Grading Company | Action | New Grade | Date |
|---|---|---|---|
| Mizuho | Maintain | Outperform | 2026-01-20 |
| Piper Sandler | Maintain | Overweight | 2025-10-30 |
| Morgan Stanley | Maintain | Equal Weight | 2025-10-30 |
| Wells Fargo | Maintain | Overweight | 2025-10-30 |
| Evercore ISI Group | Maintain | Outperform | 2025-10-30 |
| Morgan Stanley | Maintain | Equal Weight | 2025-10-21 |
| UBS | Maintain | Neutral | 2025-10-16 |
| Mizuho | Maintain | Outperform | 2025-10-13 |
| Jefferies | Downgrade | Hold | 2025-10-10 |
| Evercore ISI Group | Maintain | Outperform | 2025-10-08 |
Which company has the best grades?
Medtronic plc generally receives stronger grades, including recent upgrades to Outperform and Overweight. Align Technology shows more mixed ratings, with some downgrades and Equal Weight assessments. Investors might interpret Medtronic’s consistently higher grades as greater institutional confidence, potentially influencing portfolio choices.
Risks specific to each company
In 2026, both Medtronic plc and Align Technology face critical pressure points and systemic threats across key risk categories in the evolving medical devices market environment:
1. Market & Competition
Medtronic plc
- Established global leader with diversified portfolio in medical devices, facing intense competition in cardiovascular and surgical segments.
Align Technology, Inc.
- Specializes in clear aligners and scanners, competing in a niche but highly innovative orthodontic market with rapid technological shifts.
2. Capital Structure & Debt
Medtronic plc
- Moderate leverage with debt-to-equity of 0.59; interest coverage strong at 8.72x, indicating solid ability to service debt.
Align Technology, Inc.
- Extremely low debt (debt-to-equity 0.03) but interest coverage is poor at 0, signaling potential risks if debt increases or earnings dip.
3. Stock Volatility
Medtronic plc
- Beta of 0.718 suggests lower volatility than market, providing more defensive characteristics for risk-averse investors.
Align Technology, Inc.
- High beta of 1.831 indicates greater sensitivity to market swings, increasing risk for investors in volatile conditions.
4. Regulatory & Legal
Medtronic plc
- Subject to stringent FDA and international medical device regulations; diversified product lines help mitigate regulatory impact.
Align Technology, Inc.
- Regulatory scrutiny focused on orthodontic devices and digital health software; innovation pace may invite compliance challenges.
5. Supply Chain & Operations
Medtronic plc
- Large, complex supply chain with global sourcing; exposure to operational disruptions but benefits from scale and diversification.
Align Technology, Inc.
- More concentrated supply chain; reliance on advanced manufacturing for scanners and aligners could pose risks during disruptions.
6. ESG & Climate Transition
Medtronic plc
- Increasing ESG initiatives aligned with healthcare sustainability trends; larger footprint requires ongoing improvements.
Align Technology, Inc.
- Smaller scale allows agile ESG adaptations but less influence on industry-wide sustainability; climate transition risks moderate.
7. Geopolitical Exposure
Medtronic plc
- Headquartered in Ireland with global operations; exposure to EU regulatory and trade policies amid geopolitical tensions.
Align Technology, Inc.
- US-based with significant international sales; vulnerable to trade tariffs and geopolitical disruptions in key markets like China.
Which company shows a better risk-adjusted profile?
Medtronic’s most impactful risk lies in its complex global supply chain and regulatory demands. Align’s key risk is high stock volatility paired with weak interest coverage. Medtronic’s stable capital structure and lower beta give it a superior risk-adjusted profile. Notably, Align’s interest coverage of zero flags potential financial vulnerability despite its low debt, warranting caution.
Final Verdict: Which stock to choose?
Medtronic’s superpower lies in its resilient cash generation and disciplined capital allocation despite current value erosion. Its slightly unfavorable ROIC vs. WACC warns investors to monitor profitability closely. It suits portfolios seeking steady income with moderate growth — a conservative core holding with defensive qualities.
Align Technology boasts a compelling strategic moat rooted in innovation and recurring demand for orthodontic solutions. Its pristine balance sheet and strong free cash flow provide a safety cushion absent in Medtronic. Align fits well in a GARP (Growth at a Reasonable Price) portfolio targeting innovation-driven growth tempered by financial prudence.
If you prioritize reliable cash flow and dividend income, Medtronic is the compelling choice due to its stable operating performance and defensive stance. However, if you seek growth fueled by technological edge and lower leverage, Align offers better upside potential and superior financial stability. Both stocks carry distinct risks, making investor profile the key determinant.
Disclaimer: Investment carries a risk of loss of initial capital. The past performance is not a reliable indicator of future results. Be sure to understand risks before making an investment decision.
Go Further
I encourage you to read the complete analyses of Medtronic plc and Align Technology, Inc. to enhance your investment decisions: