Home > Comparison > Healthcare > DXCM vs ALGN
The strategic rivalry between DexCom, Inc. and Align Technology, Inc. shapes the future of the medical devices sector. DexCom operates as a specialized innovator in continuous glucose monitoring systems, while Align Technology leads with advanced orthodontic and dental digital solutions. This head-to-head reflects a broader contest between niche medical device innovation and integrated digital dentistry. This analysis aims to identify which trajectory offers superior risk-adjusted returns for diversified healthcare portfolios.
Table of contents
Companies Overview
DexCom and Align Technology dominate distinct niches within the medical devices sector, shaping diabetes and dental care markets.
DexCom, Inc.: Pioneer in Continuous Glucose Monitoring
DexCom leads in continuous glucose monitoring (CGM) systems, generating revenue through advanced devices like DexCom G6 and G7. Its core strength lies in real-time glucose data integration and remote monitoring, crucial for diabetes management. In 2026, DexCom focuses on expanding its product pipeline and enhancing API partnerships, reinforcing its competitive edge in diabetes care technology.
Align Technology, Inc.: Innovator in Orthodontic Solutions
Align Technology specializes in clear aligners and intraoral scanners, driving revenue from Invisalign and iTero scanner platforms. Its business model integrates orthodontic treatment packages with digital scanning services, catering to dentists and orthodontists globally. The company’s 2026 strategy emphasizes broadening product offerings for diverse age groups and enhancing digital workflow tools to capture more market share in aesthetic dentistry.
Strategic Collision: Similarities & Divergences
Both companies excel in high-tech medical device innovation but diverge in application—DexCom targets diabetes management while Align focuses on orthodontics. Their competition unfolds in healthcare providers’ adoption of digital tools, with DexCom pushing real-time health data and Align advancing digital dental workflows. Investors face contrasting profiles: DexCom offers growth via chronic disease management, whereas Align bets on elective and aesthetic dental care expansion.
Income Statement Comparison
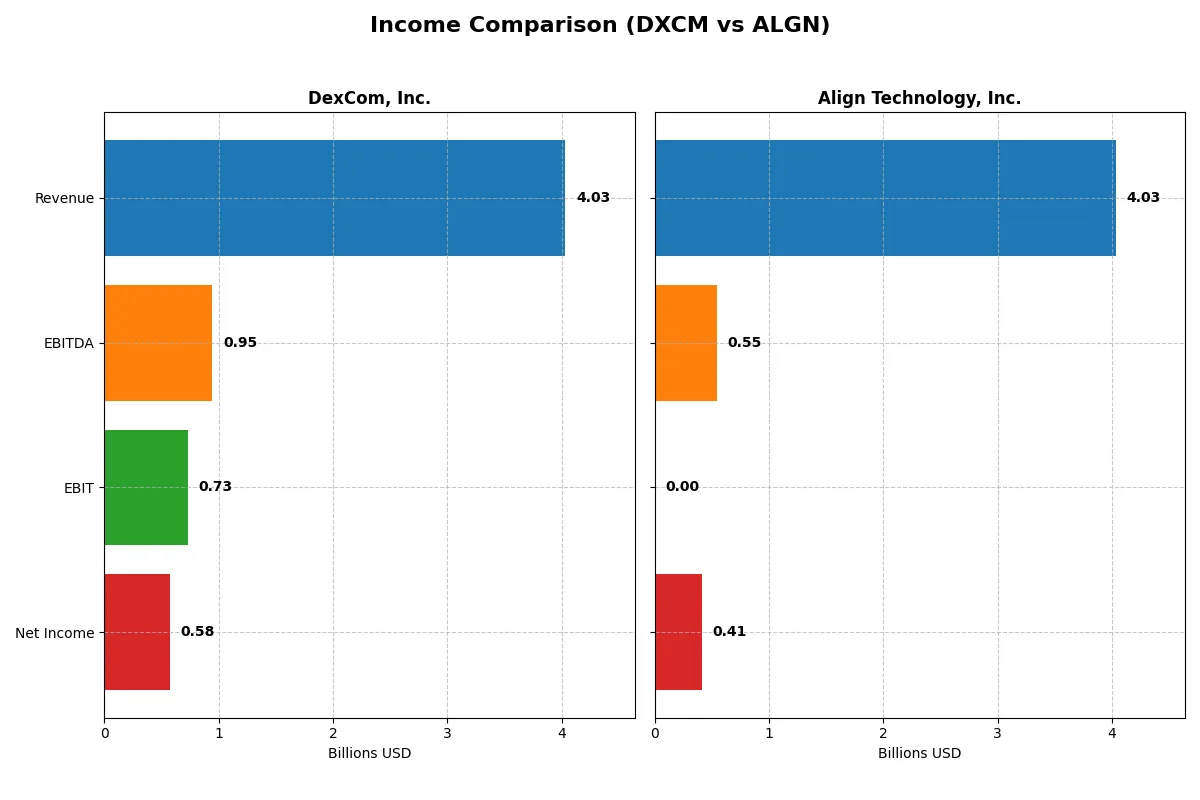
This data dissects the core profitability and scalability of both corporate engines to reveal who dominates the bottom line:
| Metric | DexCom, Inc. (DXCM) | Align Technology, Inc. (ALGN) |
|---|---|---|
| Revenue | 4.03B | 4.03B |
| Cost of Revenue | 1.59B | 1.32B |
| Operating Expenses | 1.84B | 2.13B |
| Gross Profit | 2.44B | 2.71B |
| EBITDA | 946M | 546M |
| EBIT | 728M | 0 |
| Interest Expense | 19M | 0 |
| Net Income | 587.7M | 410.4M |
| EPS | 1.46 | 5.66 |
| Fiscal Year | 2024 | 2025 |
Income Statement Analysis: The Bottom-Line Duel
This income statement comparison reveals which company drives superior operational efficiency and profitability in their respective markets.
DexCom, Inc. Analysis
DexCom’s revenue climbed steadily from $1.9B in 2020 to $4.0B in 2024, reflecting robust growth. Net income nearly doubled from $493M to $587M in the same period. Its gross margin holds strong at 60.5%, while net margin remains healthy at 14.3%. Despite a slight EBIT dip in 2024, momentum persists with solid EPS growth and disciplined expense control.
Align Technology, Inc. Analysis
Align’s revenue hovered near $4.0B from 2021 to 2025, showing minimal growth of 0.9% last year. Net income declined sharply, dropping from $772M in 2021 to $410M in 2025. Gross margin is impressive at 67.2%, but EBIT margin is zero, signaling operational challenges. Margins deteriorate with consistent net margin declines and negative long-term EPS trends, indicating weakening profitability.
Growth and Margin Strength: DexCom’s Resilience vs. Align’s Pressure
DexCom outperforms with double-digit revenue growth and favorable margin expansion over five years. Align struggles with stagnant top-line and eroding bottom-line metrics. DexCom’s consistent profitability and strong margin control make it the clearer fundamental winner. Investors seeking sustained growth and margin strength may find DexCom’s profile more compelling.
Financial Ratios Comparison
These vital ratios act as a diagnostic tool to expose the underlying fiscal health, valuation premiums, and capital efficiency of each company:
| Ratios | DexCom, Inc. (DXCM) | Align Technology, Inc. (ALGN) |
|---|---|---|
| ROE | 27.4% | 10.9% |
| ROIC | 10.2% | 10.0% |
| P/E | 54.6 | 37.1 |
| P/B | 15.0 | 4.1 |
| Current Ratio | 1.47 | 1.22 |
| Quick Ratio | 1.28 | 1.10 |
| D/E | 1.23 | 0.03 |
| Debt-to-Assets | 39.9% | 1.9% |
| Interest Coverage | 31.6 | 0 |
| Asset Turnover | 0.62 | 0.64 |
| Fixed Asset Turnover | 2.88 | 2.89 |
| Payout Ratio | 0 | 0 |
| Dividend Yield | 0 | 0 |
| Fiscal Year | 2024 | 2024 |
Efficiency & Valuation Duel: The Vital Signs
Financial ratios act as a company’s DNA, revealing hidden risks and operational excellence that shape investor confidence.
DexCom, Inc.
DexCom boasts a strong 27.4% ROE and a favorable 14.3% net margin, signaling robust profitability. However, its high P/E of 54.6 and P/B of 15 mark the stock as expensive and stretched. With no dividends, DexCom reinvests heavily in R&D, fueling future growth despite its slightly unfavorable overall ratio profile.
Align Technology, Inc.
Align shows moderate profitability with a 10.9% ROE and a decent 10.5% net margin. Its P/E of 37.1 and P/B of 4.1 still reflect a premium but less stretched than DexCom. Align’s low debt levels and zero dividend suggest a focus on growth and capital efficiency, supported by a neutral global ratio stance indicating balanced risks.
Premium Valuation vs. Operational Balance
DexCom trades at a higher valuation with stronger profitability but carries more financial risk. Align offers a more balanced risk-reward profile with moderate returns and healthier leverage. Investors seeking growth with financial discipline may prefer Align’s steadier profile over DexCom’s aggressive expansion.
Which one offers the Superior Shareholder Reward?
DexCom and Align Technology both avoid dividends, focusing on reinvestment and buybacks. DexCom’s free cash flow per share stands at $1.56, with no dividend payout but moderate buybacks supporting shareholder returns. Align’s FCF per share is much higher at $8.32, also with zero dividends, but it backs this with aggressive buybacks and maintains a lower debt ratio (3% vs. DexCom’s 40%). Align’s distribution philosophy balances robust free cash flow with capital allocation toward buybacks, enhancing long-term value. DexCom’s higher leverage and stretched valuation (P/E ~55) raise risks. I judge Align Technology offers the superior total return profile in 2026 due to its sustainable buyback strategy and stronger free cash flow generation.
Comparative Score Analysis: The Strategic Profile
The radar chart reveals the fundamental DNA and trade-offs of DexCom, Inc. and Align Technology, Inc., highlighting their core financial strengths and weaknesses:
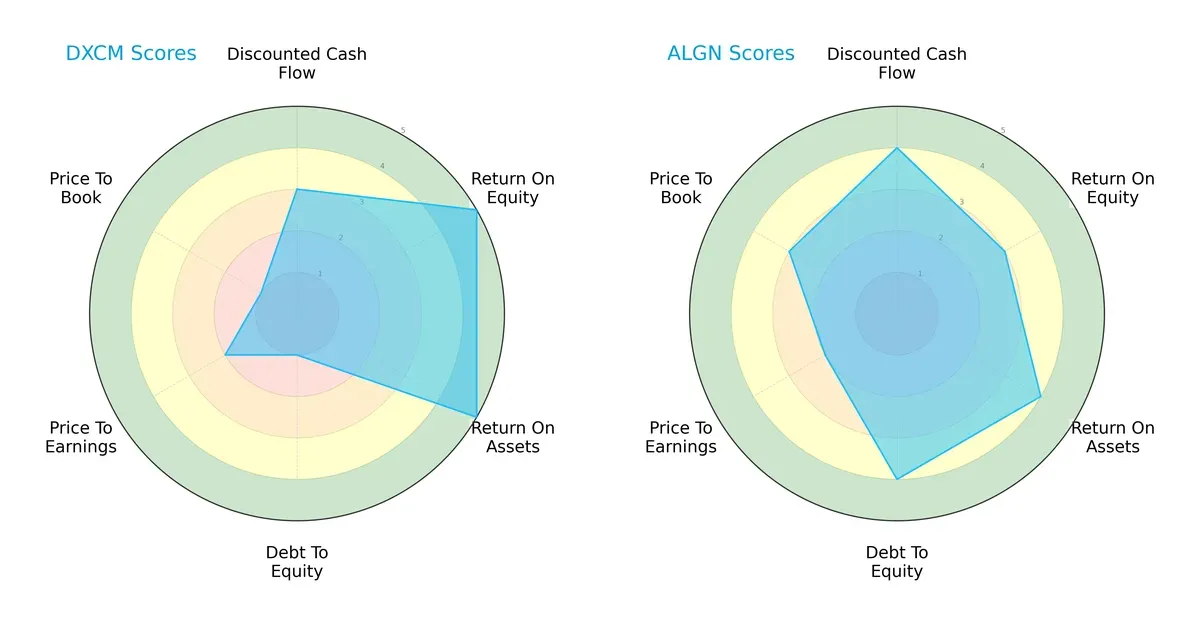
DexCom excels in profitability with top scores in ROE (5) and ROA (5), showing superior asset and equity efficiency. Align leads in financial stability with a strong debt-to-equity score (4), reflecting prudent leverage management. DexCom’s valuation metrics (P/E 2, P/B 1) lag behind Align’s more balanced profile, which maintains moderate scores across valuation and cash flow (DCF 4). Overall, Align presents a more balanced financial profile, while DexCom relies heavily on operational efficiency but carries higher financial risk.
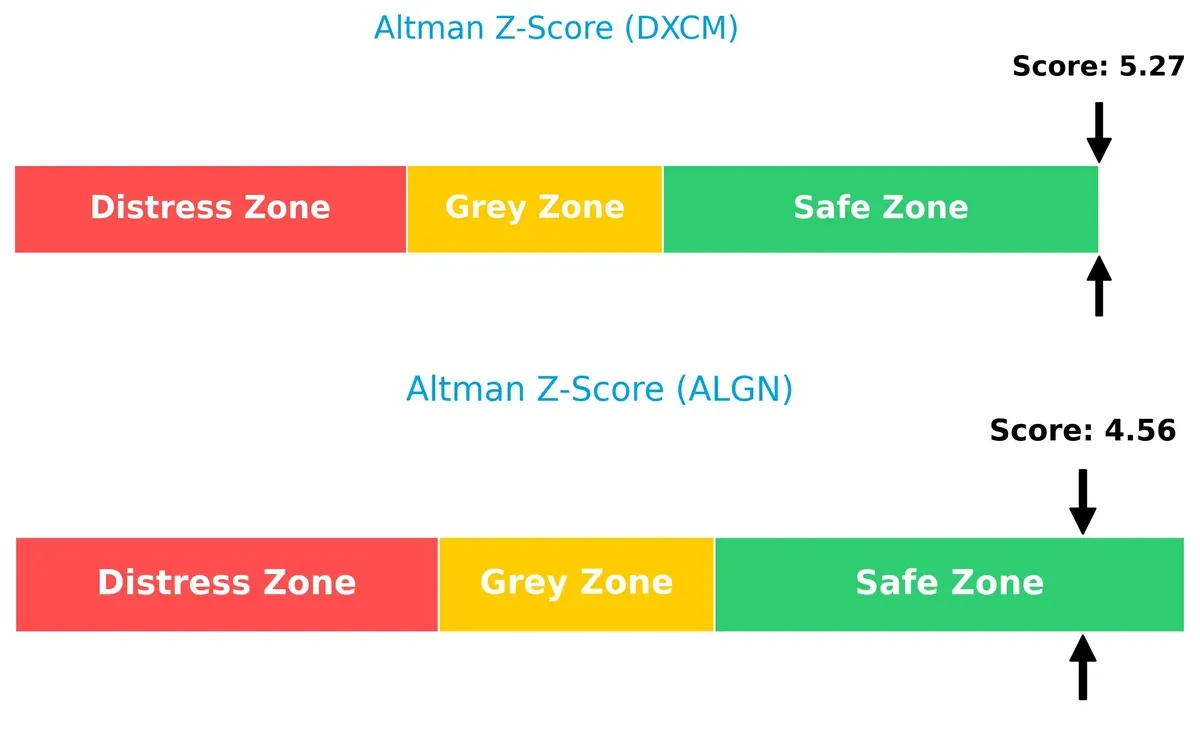
Bankruptcy Risk: Solvency Showdown
DexCom’s Altman Z-Score of 5.27 surpasses Align’s 4.56, placing both firmly in the safe zone but signaling DexCom’s stronger buffer against financial distress in this cycle:
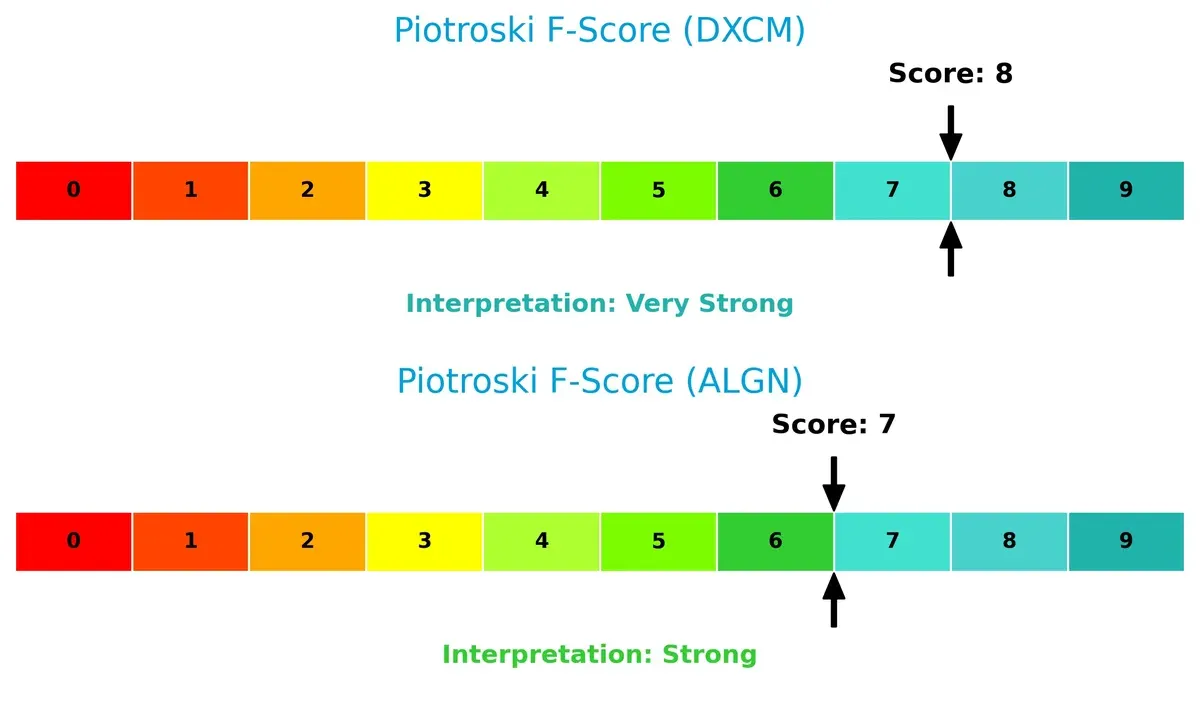
Financial Health: Quality of Operations
DexCom scores an 8 on the Piotroski F-Score, outperforming Align’s 7, indicating superior internal financial health and operational quality. Align’s slightly lower score suggests minor red flags in efficiency or liquidity metrics to monitor:
How are the two companies positioned?
This section dissects the operational DNA of DexCom and Align by comparing their revenue distribution and internal dynamics. The goal is to confront their economic moats to identify which model offers the most resilient competitive advantage today.
Revenue Segmentation: The Strategic Mix
This visual comparison dissects how DexCom, Inc. and Align Technology, Inc. diversify their income streams and where their primary sector bets lie:
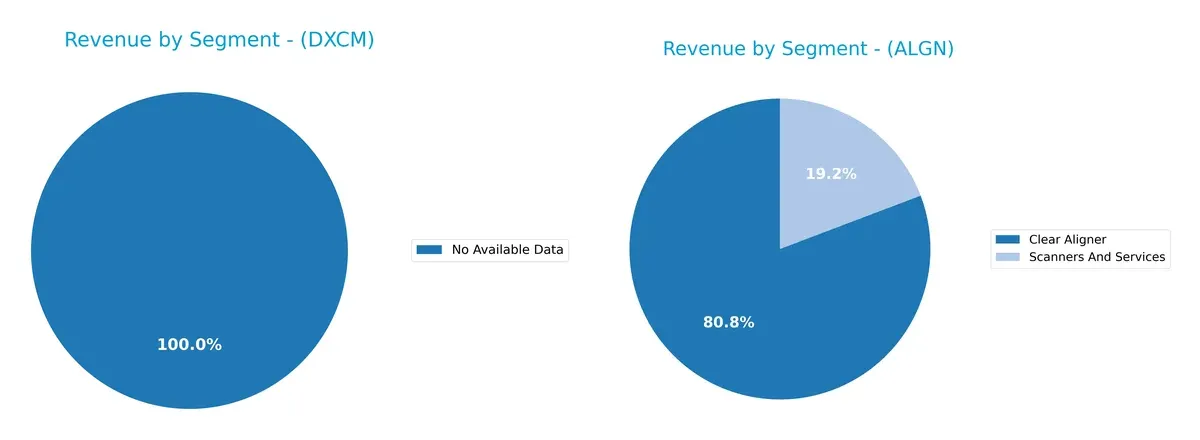
DexCom, Inc. lacks available segmentation data, preventing detailed comparison. Align Technology, Inc. pivots on Clear Aligners, generating $3.23B in 2024, dwarfing its $769M Scanners and Services segment. Align’s concentrated reliance on Clear Aligners anchors its ecosystem dominance but heightens concentration risk. Without diversified streams, Align bets heavily on orthodontic innovation, while DexCom’s unknown mix leaves its strategic balance unclear.
Strengths and Weaknesses Comparison
This table compares the Strengths and Weaknesses of DexCom and Align Technology:
DexCom Strengths
- Higher net margin at 14.29%
- Strong return on equity of 27.4%
- Favorable quick ratio at 1.28
- Solid interest coverage at 38.32
- Significant U.S. revenue of 2.63B and growing international sales
Align Technology Strengths
- Diverse product portfolio including clear aligners and scanners
- Favorable quick ratio at 1.1
- Very low debt-to-equity at 0.03 and debt-to-assets at 1.92%
- Robust international presence with 1.7B U.S. and 2.3B international revenue
- Slightly more neutral ROIC near 10%
DexCom Weaknesses
- ROIC barely covers WACC, both around 10.2% indicating weak capital efficiency
- High PE at 54.61 and PB at 14.97 suggesting rich valuation
- Elevated debt-to-equity at 1.23
- No dividend yield
- Neutral current ratio at 1.47
Align Technology Weaknesses
- Lower net margin at 10.54%
- Neutral ROE at 10.94%
- Unfavorable interest coverage at 0 due to zero interest expense or data gap
- PE at 37.05 and PB at 4.05 still high
- No dividend yield
Both companies show strengths in profitability metrics and liquidity, yet DexCom’s capital returns struggle against its cost of capital. Align’s low leverage supports financial stability but lower profitability metrics suggest room for margin improvement. This contrast may influence their strategic priorities on capital allocation and growth investment.
The Moat Duel: Analyzing Competitive Defensibility
A structural moat is the only thing protecting long-term profits from competition’s relentless erosion:
DexCom, Inc.: Innovation-Driven Switching Costs
DexCom’s primary moat lies in switching costs embedded in its continuous glucose monitoring ecosystem. Its 60% gross margin and stable net margin reflect pricing power. The upcoming G7 system could deepen this advantage as it integrates seamlessly into diabetes care workflows.
Align Technology, Inc.: Brand and Product Ecosystem
Align’s moat centers on a strong brand and comprehensive digital orthodontic ecosystem, contrasting DexCom’s tech platform moat. Despite a 67% gross margin, its declining ROIC signals weakening capital efficiency. Expansion into scanner software may unlock new growth but risks intensifying competition.
Innovation Ecosystem vs. Brand Loyalty: The Moat Battle
DexCom’s moat is deeper, driven by improving profitability and sticky customer integration. Align’s brand strength is notable but its declining ROIC undermines sustainability. DexCom is better positioned to defend market share through innovation and margin resilience.
Which stock offers better returns?
Over the past year, both DexCom, Inc. and Align Technology, Inc. experienced significant price declines followed by recent upward momentum, with notable volatility shaping their trading dynamics.
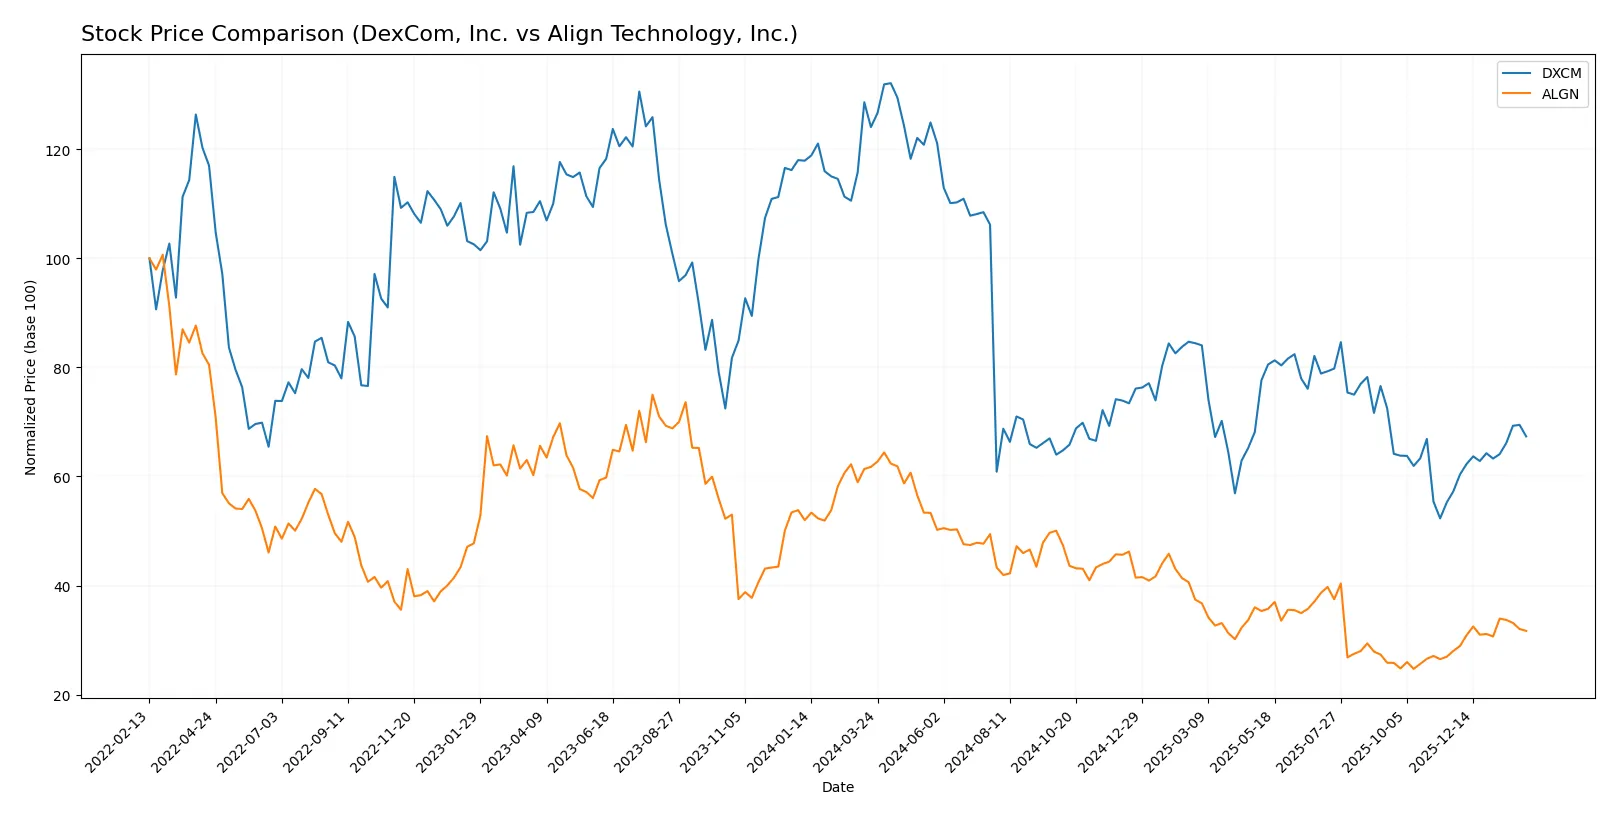
Trend Comparison
DexCom’s stock dropped 45.72% over the last 12 months, showing a bearish trend with accelerating decline and high volatility (std dev 21.42). It rebounded recently by 17.58% with strong buyer dominance.
Align Technology’s stock fell 48.69% in the same period, also bearish with accelerating losses and even higher volatility (std dev 50.54). Its recent 13.15% gain shows a moderate recovery but lower buyer dominance.
DexCom outperformed Align with a smaller overall loss and stronger recent recovery, delivering the highest market performance in the last year.
Target Prices
Analysts present a confident target price consensus for DexCom and Align Technology, reflecting positive sector momentum.
| Company | Target Low | Target High | Consensus |
|---|---|---|---|
| DexCom, Inc. | 71 | 99 | 84.55 |
| Align Technology, Inc. | 140 | 200 | 176.43 |
The consensus targets for both companies exceed current prices, indicating expected upside potential. DexCom’s $84.55 target sits 19% above its $70.82 price, while Align’s $176.43 target is roughly 9% above its $161.30 price.

Don’t Let Luck Decide Your Entry Point
Optimize your entry points with our advanced ProRealTime indicators. You’ll get efficient buy signals with precise price targets for maximum performance. Start outperforming now!
How do institutions grade them?
DexCom, Inc. Grades
Here are the recent professional grades assigned to DexCom, Inc.:
| Grading Company | Action | New Grade | Date |
|---|---|---|---|
| Barclays | Downgrade | Underweight | 2026-01-12 |
| Bernstein | Maintain | Outperform | 2026-01-09 |
| Mizuho | Maintain | Outperform | 2025-12-17 |
| Citigroup | Maintain | Buy | 2025-12-11 |
| Morgan Stanley | Upgrade | Overweight | 2025-12-02 |
| Morgan Stanley | Maintain | Equal Weight | 2025-11-10 |
| Argus Research | Maintain | Buy | 2025-11-07 |
| UBS | Maintain | Buy | 2025-11-03 |
| Truist Securities | Maintain | Buy | 2025-11-03 |
| Barclays | Maintain | Equal Weight | 2025-11-03 |
Align Technology, Inc. Grades
These are the latest verified grades for Align Technology, Inc.:
| Grading Company | Action | New Grade | Date |
|---|---|---|---|
| Mizuho | Maintain | Outperform | 2026-01-20 |
| Piper Sandler | Maintain | Overweight | 2025-10-30 |
| Morgan Stanley | Maintain | Equal Weight | 2025-10-30 |
| Wells Fargo | Maintain | Overweight | 2025-10-30 |
| Evercore ISI Group | Maintain | Outperform | 2025-10-30 |
| Morgan Stanley | Maintain | Equal Weight | 2025-10-21 |
| UBS | Maintain | Neutral | 2025-10-16 |
| Mizuho | Maintain | Outperform | 2025-10-13 |
| Jefferies | Downgrade | Hold | 2025-10-10 |
| Evercore ISI Group | Maintain | Outperform | 2025-10-08 |
Which company has the best grades?
Align Technology holds a more consistent set of positive grades, predominantly “Outperform” and “Overweight.” DexCom shows mixed signals, with recent downgrades balanced by multiple “Buy” and “Outperform” ratings. This disparity may affect investor sentiment and portfolio positioning differently for each company.
Risks specific to each company
The following categories identify the critical pressure points and systemic threats facing both firms in the 2026 market environment:
1. Market & Competition
DexCom, Inc. (DXCM)
- Faces intense competition in continuous glucose monitoring with pressure from new entrants and innovation cycles.
Align Technology, Inc. (ALGN)
- Competes aggressively in clear aligners and dental scanners with evolving technology and market saturation risks.
2. Capital Structure & Debt
DexCom, Inc. (DXCM)
- High debt-to-equity ratio (1.23) signals financial leverage risk, though interest coverage is strong.
Align Technology, Inc. (ALGN)
- Very low debt-to-equity (0.03) implies conservative capital structure with minimal financial risk.
3. Stock Volatility
DexCom, Inc. (DXCM)
- Beta of 1.49 suggests higher volatility than the overall market, increasing risk during downturns.
Align Technology, Inc. (ALGN)
- Higher beta of 1.83 indicates greater sensitivity to market swings and elevated share price volatility.
4. Regulatory & Legal
DexCom, Inc. (DXCM)
- Medical device regulations and approvals remain a constant challenge, especially with evolving FDA standards.
Align Technology, Inc. (ALGN)
- Orthodontic and dental device regulations create compliance costs and potential product liability exposure.
5. Supply Chain & Operations
DexCom, Inc. (DXCM)
- Dependence on specialized components for CGM systems exposes it to supply disruptions and cost inflation.
Align Technology, Inc. (ALGN)
- Global supply chain complexity for scanners and aligners risks operational delays and margin pressure.
6. ESG & Climate Transition
DexCom, Inc. (DXCM)
- Increasing investor focus on sustainability pressures DexCom to improve energy use and waste in manufacturing.
Align Technology, Inc. (ALGN)
- Faces rising expectations for eco-friendly materials and lower carbon footprint in production and logistics.
7. Geopolitical Exposure
DexCom, Inc. (DXCM)
- International sales expose DexCom to trade tensions and regulatory changes in key markets like Europe and Asia.
Align Technology, Inc. (ALGN)
- Significant revenue from China and Europe creates vulnerability to geopolitical risks and tariffs.
Which company shows a better risk-adjusted profile?
DexCom’s most impactful risk is its elevated financial leverage amid a challenging innovation cycle. Align’s key risk lies in higher stock volatility linked to global market sensitivity. Despite DexCom’s leverage, it boasts stronger profitability metrics and financial scores. Align benefits from a conservative balance sheet but faces greater market price swings. I see Align’s lower debt and favorable Altman Z-score as positives, but its beta near 1.83 signals riskier trading behavior. Overall, Align offers a slightly better risk-adjusted profile currently, supported by its stable capital structure and strong bankruptcy safety margin.
Final Verdict: Which stock to choose?
DexCom’s superpower lies in its robust profitability and growing operational efficiency, despite a slight value destruction indicated by ROIC below WACC. Its moderate liquidity and gearing warrant vigilance. This stock aligns well with aggressive growth portfolios ready to embrace volatility for potential upside.
Align Technology’s strategic moat centers on its recurring revenue and strong balance sheet, marked by minimal debt and solid cash flow generation. It offers comparatively better financial stability than DexCom. Align fits a GARP (Growth at a Reasonable Price) investor seeking steadier growth with lower leverage risk.
If you prioritize high-growth potential and can tolerate financial leverage risks, DexCom outshines due to its expanding profitability and market opportunity. However, if you seek better financial stability and a more conservative risk profile, Align offers superior balance sheet strength and recurring revenue benefits, commanding a premium for lower risk.
Disclaimer: Investment carries a risk of loss of initial capital. The past performance is not a reliable indicator of future results. Be sure to understand risks before making an investment decision.
Go Further
I encourage you to read the complete analyses of DexCom, Inc. and Align Technology, Inc. to enhance your investment decisions: