Home > Comparison > Healthcare > BSX vs ALGN
The strategic rivalry between Boston Scientific Corporation and Align Technology, Inc. shapes the evolution of the healthcare medical devices sector. Boston Scientific operates as a capital-intensive multinational, delivering a broad portfolio of interventional devices. Align Technology focuses on high-margin, innovative dental aligners and digital scanning solutions. This analysis contrasts their growth models to identify which company presents the superior risk-adjusted opportunity for a diversified portfolio in 2026.

Table of contents
Companies Overview
Boston Scientific and Align Technology stand as pivotal players in the medical devices sector, shaping healthcare innovation globally.
Boston Scientific Corporation: Interventional Medical Devices Leader
Boston Scientific dominates the interventional medical devices market, generating revenue through diversified offerings in MedSurg, Rhythm and Neuro, and Cardiovascular segments. Its portfolio spans from cardiac rhythm management devices to peripheral and structural heart therapies. In 2026, Boston Scientific strategically emphasizes expanding minimally invasive solutions to address complex cardiovascular and neurological conditions worldwide.
Align Technology, Inc.: Clear Aligner and Digital Dentistry Pioneer
Align Technology leads in clear aligners and digital dental scanners, monetizing through Invisalign products and iTero scanning technology. It targets orthodontists and general dentists with comprehensive orthodontic solutions and digital restorative services. In 2026, Align focuses on enhancing its digital platform and broadening adoption of intraoral scanners to innovate orthodontic and restorative care workflows.
Strategic Collision: Similarities & Divergences
Both firms thrive in medical devices yet diverge sharply in focus—Boston Scientific prioritizes invasive therapeutic devices, while Align champions non-invasive, digital orthodontics. Their competition unfolds mainly in specialty healthcare innovation rather than direct market overlap. Boston Scientific’s broad portfolio contrasts with Align’s niche digital expertise, creating distinct risk and growth profiles for investors.
Income Statement Comparison
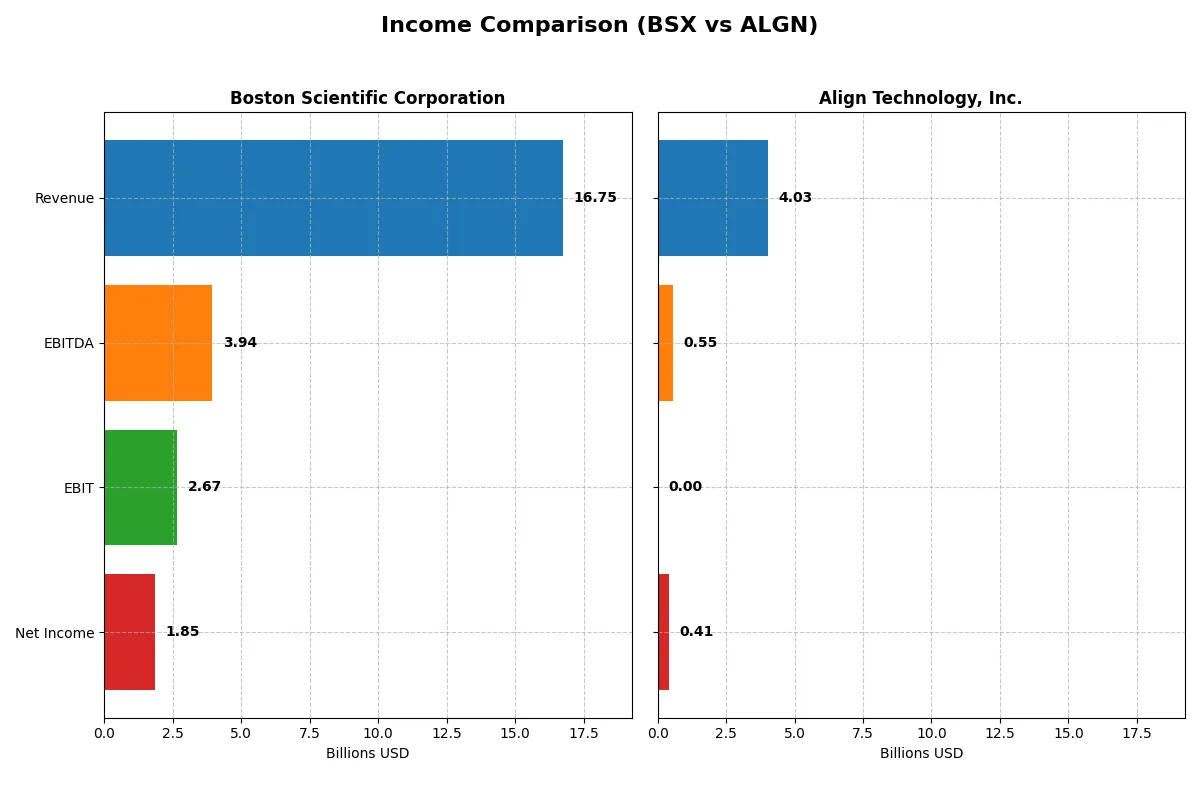
The following data dissects the core profitability and scalability of both corporate engines to reveal who dominates the bottom line:
| Metric | Boston Scientific Corporation (BSX) | Align Technology, Inc. (ALGN) |
|---|---|---|
| Revenue | 16.7B | 4.0B |
| Cost of Revenue | 6.5B | 1.2B |
| Operating Expenses | 7.6B | 2.2B |
| Gross Profit | 10.3B | 2.8B |
| EBITDA | 3.9B | 546M |
| EBIT | 2.7B | 0 |
| Interest Expense | 387M | 0 |
| Net Income | 1.85B | 410M |
| EPS | 1.26 | 5.66 |
| Fiscal Year | 2024 | 2025 |
Income Statement Analysis: The Bottom-Line Duel
This income statement comparison reveals which company efficiently converts revenue into profit, exposing the true power of their business models.
Boston Scientific Corporation Analysis
Boston Scientific grew revenue by nearly 17.6% in 2024, reaching $16.7B, while net income soared 16.4% to $1.85B. Its gross margin stays robust at 61.3%, with a solid net margin of 11.1%. The company sustains strong operating leverage, pushing EBIT margin near 16%, signaling disciplined cost control and momentum.
Align Technology, Inc. Analysis
Align’s revenue barely moved, up 0.9% to $4.0B in 2025, while net income slid 3.5% to $410M. Gross margin at 67.2% remains healthy, but EBIT margin collapsed to zero, reflecting margin pressure. Recent profitability shows signs of strain despite stable top-line, with a sharp decline in operating income undermining efficiency.
Margin Strength vs. Growth Dynamism
Boston Scientific outperforms with strong revenue growth, expanding net income, and healthy margins, showcasing scalable profitability. Align’s stagnant revenue and eroding EBIT margin highlight operational challenges. For investors, Boston Scientific’s profile offers a more compelling balance of growth and margin resilience in the current market environment.
Financial Ratios Comparison
These vital ratios act as a diagnostic tool to expose the underlying fiscal health, valuation premiums, and capital efficiency of the companies compared below:
| Ratios | Boston Scientific (BSX) | Align Technology (ALGN) |
|---|---|---|
| ROE | 8.52% | 10.94% |
| ROIC | 6.13% | 9.99% |
| P/E | 70.9x | 37.1x |
| P/B | 6.04x | 4.05x |
| Current Ratio | 1.08 | 1.22 |
| Quick Ratio | 0.64 | 1.10 |
| D/E | 0.51 | 0.03 |
| Debt-to-Assets | 28.3% | 1.9% |
| Interest Coverage | 6.81x | N/A |
| Asset Turnover | 0.43 | 0.64 |
| Fixed Asset Turnover | 4.47 | 2.89 |
| Payout ratio | 0% | 0% |
| Dividend yield | 0% | 0% |
| Fiscal Year | 2024 | 2024 |
Efficiency & Valuation Duel: The Vital Signs
Ratios act as a company’s DNA, uncovering hidden risks and operational strengths shaping long-term investor outcomes.
Boston Scientific Corporation
Boston Scientific posts a modest ROE of 8.52% with a solid net margin of 11.07%, reflecting steady profitability. However, its P/E ratio at 70.89 signals a stretched valuation compared to sector norms. The company lacks dividends, focusing instead on reinvestment in R&D, which accounts for nearly 9.6% of revenue, aiming to fuel future growth.
Align Technology, Inc.
Align Technology delivers a stronger ROE of 10.94% and a net margin near 10.54%, showcasing healthy efficiency. Despite a high P/E of 37.05, it appears less expensive than Boston Scientific. Align’s balance sheet strength shines with low debt and a favorable quick ratio. It returns no dividends, prioritizing capital for innovation and expansion.
Valuation Stretch vs. Operational Resilience
Boston Scientific’s stretched valuation and limited profitability contrast with Align’s healthier returns and balanced financials. Align offers a more favorable risk-reward trade-off based on current ratios. Investors seeking operational resilience may prefer Align’s profile; those betting on long-term R&D payoff might consider Boston Scientific.
Which one offers the Superior Shareholder Reward?
I see Boston Scientific (BSX) pays a minimal dividend yield (~0.03%) with no buyback activity reported in 2024. Its payout ratio is zero, signaling full reinvestment in operations. Align Technology (ALGN) offers no dividends but executes robust buybacks, reflecting a strong capital return focus. ALGN’s free cash flow per share stands at $8.3, supporting sustainable buybacks, while BSX’s FCF per share is only $1.8. ALGN’s model prioritizes shareholder reward via buybacks and growth, outpacing BSX’s low-yield, reinvestment approach. For total return in 2026, ALGN offers a superior, sustainable shareholder reward profile.
Comparative Score Analysis: The Strategic Profile
The radar chart reveals the fundamental DNA and trade-offs of Boston Scientific and Align Technology, highlighting their strategic strengths and vulnerabilities:
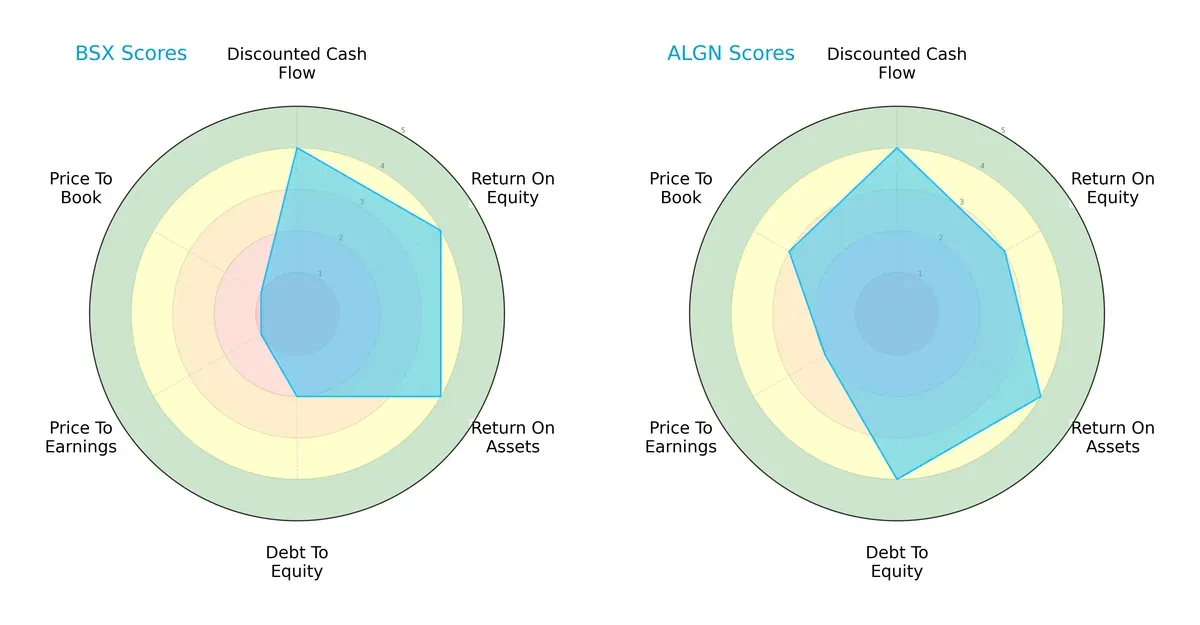
Boston Scientific shows strength in profitability metrics, ranking higher in ROE and ROA, but struggles with valuation scores, reflecting possible overpricing concerns. Align Technology presents a more balanced profile with strong debt management and moderate valuation scores, indicating prudent capital structure and fair market pricing. Align relies on financial stability, while Boston Scientific leans on operational efficiency.
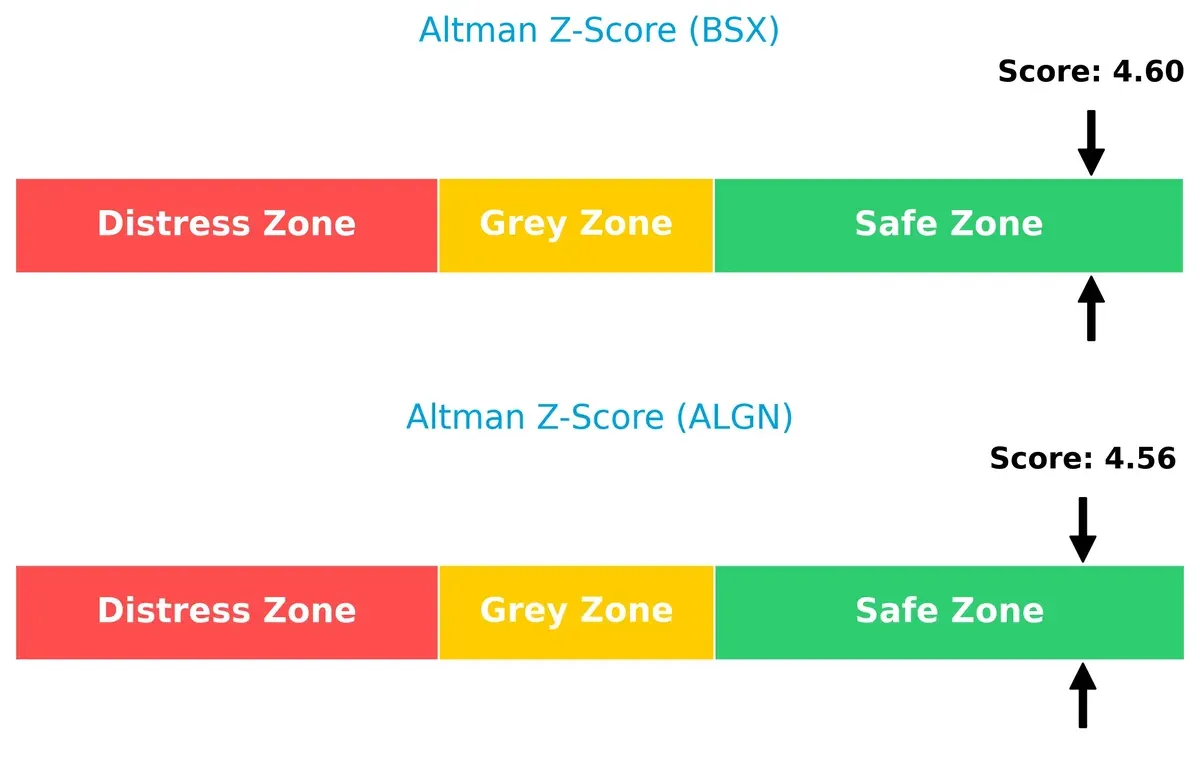
Bankruptcy Risk: Solvency Showdown
Boston Scientific and Align Technology both score well above 4.5 on the Altman Z-Score, indicating robust financial health and low bankruptcy risk in the current economic cycle:
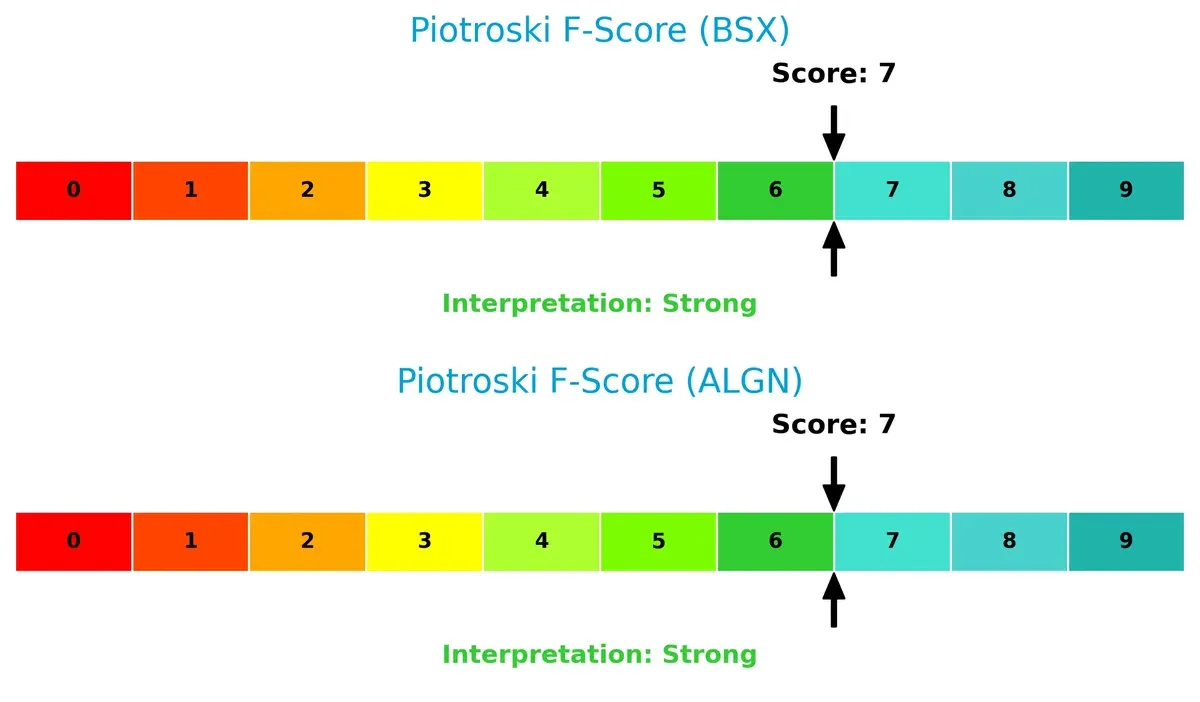
Financial Health: Quality of Operations
Both companies post a Piotroski F-Score of 7, reflecting strong operational quality and financial health without immediate red flags in profitability, liquidity, or leverage metrics:
How are the two companies positioned?
This section dissects the operational DNA of Boston Scientific and Align Technology by comparing their revenue distribution and internal dynamics. The goal is to confront their economic moats to reveal which business model offers the most resilient competitive advantage today.
Revenue Segmentation: The Strategic Mix
This visual comparison dissects how Boston Scientific Corporation and Align Technology diversify their income streams and where their primary sector bets lie:
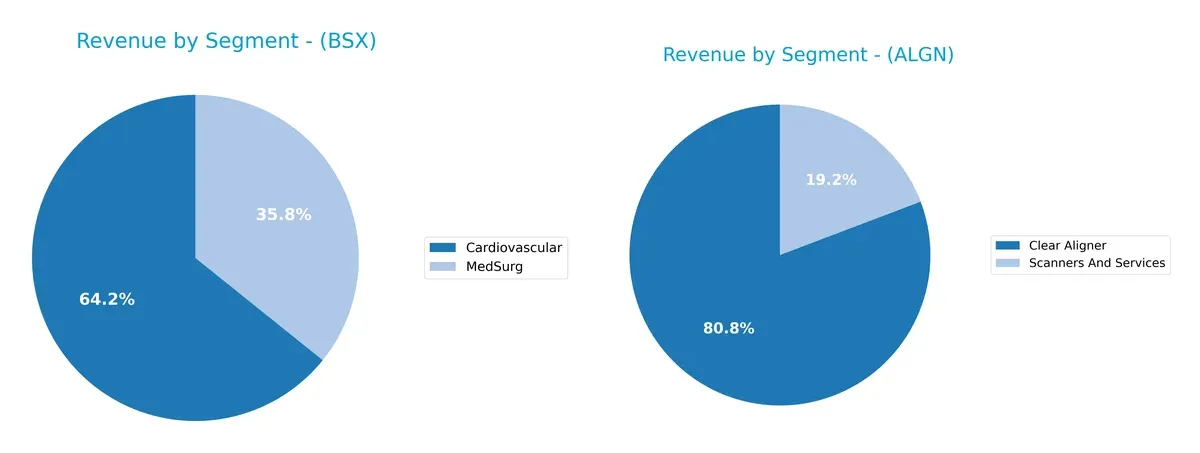
Boston Scientific anchors its revenue in Cardiovascular at $10.8B and MedSurg at $6B in 2024, showing a balanced dual-segment focus. Align Technology pivots heavily on Clear Aligner, generating $3.2B, while Scanners and Services contribute $769M, reflecting a less diversified but highly specialized portfolio. Boston Scientific’s mix reduces concentration risk, while Align relies on ecosystem lock-in around orthodontics innovation.
Strengths and Weaknesses Comparison
This table compares the strengths and weaknesses of Boston Scientific Corporation (BSX) and Align Technology, Inc. (ALGN):
BSX Strengths
- Diversified revenue across Cardiovascular and MedSurg segments
- Favorable net margin at 11.07%
- Strong interest coverage at 6.9
- Low debt to assets at 28.3%
- Significant global presence with $6.5B non-US sales
- High fixed asset turnover at 4.47
ALGN Strengths
- Favorable net margin at 10.54%
- Low debt to equity at 0.03 and debt to assets at 1.92%
- Favorable quick ratio at 1.1
- Diversified revenue from Clear Aligner and Scanners and Services
- Balanced geographic revenue including $1.7B US and $2.3B international
- Neutral ROIC near 10%
BSX Weaknesses
- Unfavorable ROE at 8.52% below cost of capital
- Elevated P/E at 70.89 and P/B at 6.04 indicate high valuation
- Quick ratio low at 0.64 signals liquidity risk
- Asset turnover weak at 0.43 suggests inefficient asset use
- Zero dividend yield limits income potential
ALGN Weaknesses
- Unfavorable interest coverage at 0 limits debt service ability
- High P/E of 37.05 and P/B of 4.05 reflect valuation risk
- No available WACC to assess capital cost
- Dividend yield at 0 offers no shareholder income
- Asset and fixed asset turnover are only neutral
Both companies exhibit strong profitability and global footprints. BSX’s broader diversification contrasts with ALGN’s focus on dental aligners and imaging. BSX faces valuation and liquidity concerns, while ALGN’s debt service coverage and valuation also present risks. These factors shape their capital allocation and growth strategies.
The Moat Duel: Analyzing Competitive Defensibility
A structural moat shields long-term profits from competitors’ erosion; without it, market share and margins inevitably decline:
Boston Scientific Corporation: Diversified Product Portfolio Moat
Boston Scientific leverages intangible assets and innovation across multiple medical device segments. Its robust gross margin (61%) and rising profitability signal a strengthening moat in 2026. Expansion in neuro and cardiovascular markets could deepen its competitive edge.
Align Technology, Inc.: Brand and Technology Ecosystem Moat
Align’s moat rests on proprietary Invisalign technology and scanner integration, creating high switching costs. However, declining revenue growth and shrinking ROIC trend warn of margin pressure. Future success depends on innovation in digital orthodontics to disrupt traditional practices.
Innovation Breadth vs. Niche Technology Leadership
Boston Scientific’s broad product line and improving profitability present a wider moat than Align’s concentrated, though technologically sticky, position. I believe Boston Scientific is better equipped to protect and grow its market share amid evolving healthcare demands.
Which stock offers better returns?
Stock prices for Boston Scientific Corporation and Align Technology, Inc. show contrasting trends over the past year, reflecting divergent market dynamics and investor sentiment.
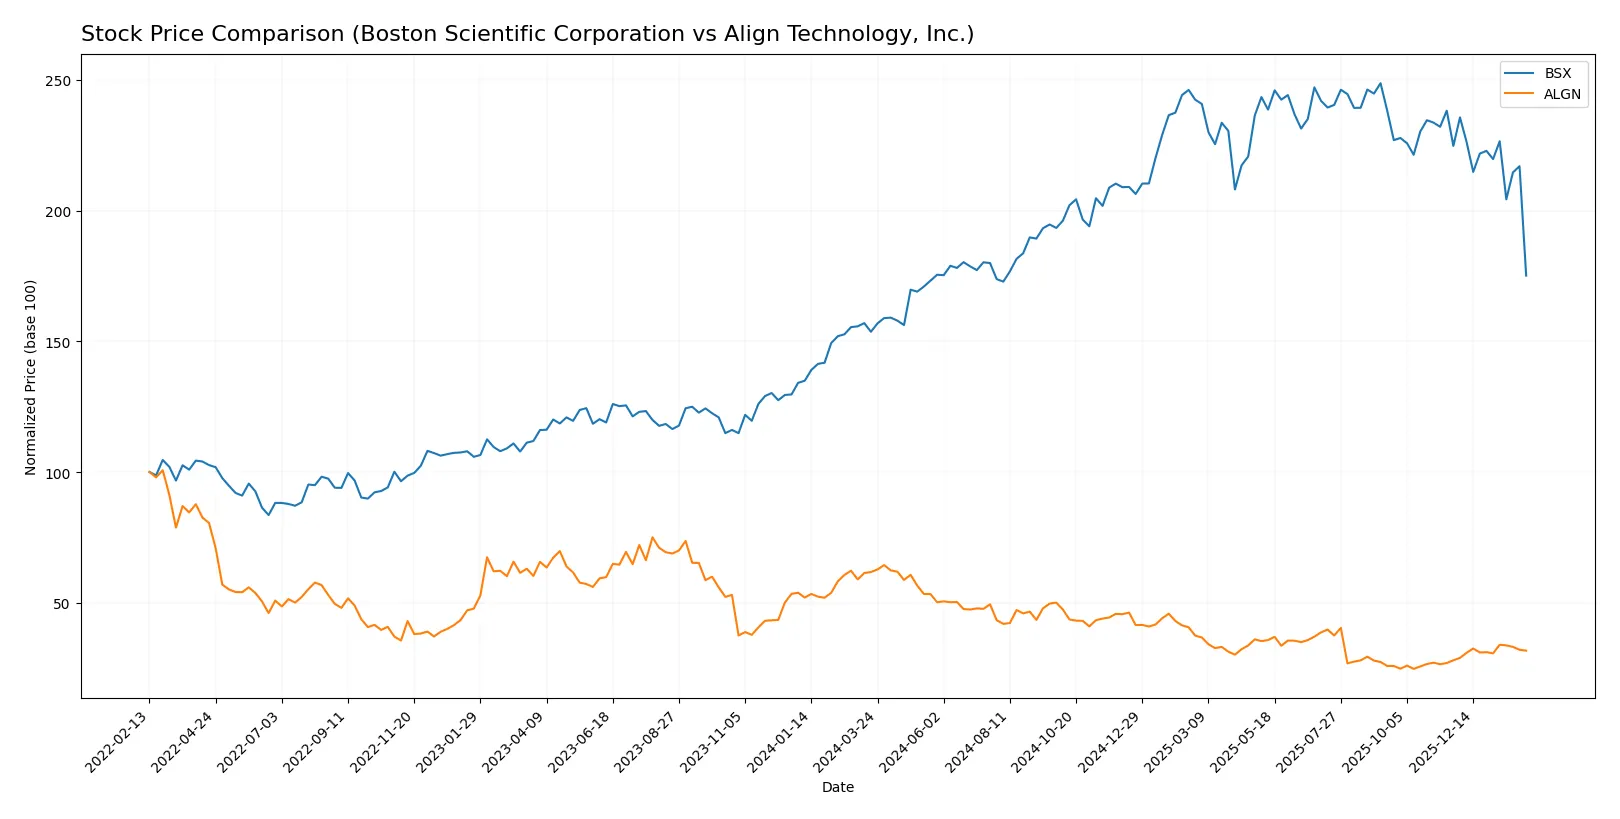
Trend Comparison
Boston Scientific (BSX) posted a 14.0% price increase over the past 12 months, indicating a bullish trend with decelerating momentum. The stock ranged between 66.23 and 107.22.
Align Technology (ALGN) declined by 48.69% over the same period, marking a bearish trend with accelerating losses. Price volatility was high, oscillating from 125.79 to 327.92.
BSX outperformed ALGN in market performance over the past year, showing positive gains versus ALGN’s substantial decline despite recent short-term recovery.
Target Prices
Analysts present a bullish consensus for both Boston Scientific Corporation and Align Technology, Inc.
| Company | Target Low | Target High | Consensus |
|---|---|---|---|
| Boston Scientific Corporation | 100 | 140 | 120.5 |
| Align Technology, Inc. | 140 | 200 | 176.43 |
Boston Scientific’s consensus target of 120.5 implies a significant upside from the current 75.5, reflecting strong growth expectations. Align Technology’s 176.43 target also suggests robust appreciation potential versus its 161.3 price.

Don’t Let Luck Decide Your Entry Point
Optimize your entry points with our advanced ProRealTime indicators. You’ll get efficient buy signals with precise price targets for maximum performance. Start outperforming now!
How do institutions grade them?
Here are the latest institutional grades for Boston Scientific Corporation and Align Technology, Inc.:
Boston Scientific Corporation Grades
The table below summarizes recent grades from major grading firms for Boston Scientific Corporation.
| Grading Company | Action | New Grade | Date |
|---|---|---|---|
| Barclays | Maintain | Overweight | 2026-02-03 |
| Oppenheimer | Maintain | Outperform | 2026-01-16 |
| Truist Securities | Maintain | Buy | 2025-12-18 |
| Canaccord Genuity | Maintain | Buy | 2025-12-17 |
| RBC Capital | Maintain | Outperform | 2025-12-17 |
| BTIG | Maintain | Buy | 2025-11-21 |
| Wells Fargo | Maintain | Overweight | 2025-10-23 |
| Truist Securities | Maintain | Buy | 2025-10-23 |
| Morgan Stanley | Maintain | Overweight | 2025-10-23 |
| Canaccord Genuity | Maintain | Buy | 2025-10-23 |
Align Technology, Inc. Grades
Below is a summary of recent institutional grades for Align Technology, Inc.
| Grading Company | Action | New Grade | Date |
|---|---|---|---|
| Mizuho | Maintain | Outperform | 2026-01-20 |
| Piper Sandler | Maintain | Overweight | 2025-10-30 |
| Morgan Stanley | Maintain | Equal Weight | 2025-10-30 |
| Wells Fargo | Maintain | Overweight | 2025-10-30 |
| Evercore ISI Group | Maintain | Outperform | 2025-10-30 |
| Morgan Stanley | Maintain | Equal Weight | 2025-10-21 |
| UBS | Maintain | Neutral | 2025-10-16 |
| Mizuho | Maintain | Outperform | 2025-10-13 |
| Jefferies | Downgrade | Hold | 2025-10-10 |
| Evercore ISI Group | Maintain | Outperform | 2025-10-08 |
Which company has the best grades?
Boston Scientific consistently receives Buy, Outperform, and Overweight grades, signaling robust institutional confidence. Align Technology’s grades show more variance, including Equal Weight and a recent Hold downgrade, indicating mixed sentiment among analysts. Investors may view Boston Scientific’s steadier positive grades as a sign of stronger consensus support.
Risks specific to each company
The following categories identify the critical pressure points and systemic threats facing both firms in the 2026 market environment:
1. Market & Competition
Boston Scientific Corporation
- Faces intense competition in diversified medical device markets with evolving technologies.
Align Technology, Inc.
- Competes in a niche orthodontic device market, heavily reliant on innovation and consumer adoption.
2. Capital Structure & Debt
Boston Scientific Corporation
- Moderate debt-to-equity ratio (0.51) with solid interest coverage (6.9), indicating manageable leverage.
Align Technology, Inc.
- Very low debt-to-equity (0.03) but concerning zero interest coverage due to limited earnings buffer.
3. Stock Volatility
Boston Scientific Corporation
- Beta of 0.67 signals lower volatility than market, providing relative stability.
Align Technology, Inc.
- High beta at 1.83 suggests significant share price swings and higher market sensitivity.
4. Regulatory & Legal
Boston Scientific Corporation
- Subject to stringent device approvals and recalls risk in multiple medical specialties.
Align Technology, Inc.
- Faces regulatory scrutiny on product safety and data privacy in digital orthodontic solutions.
5. Supply Chain & Operations
Boston Scientific Corporation
- Complex global supply chain with exposure to manufacturing and logistics disruptions.
Align Technology, Inc.
- Relies on specialized manufacturing and digital supply chain, vulnerable to tech component shortages.
6. ESG & Climate Transition
Boston Scientific Corporation
- Pressure to reduce carbon footprint in manufacturing and comply with evolving ESG standards.
Align Technology, Inc.
- ESG efforts focus on sustainable materials and energy-efficient digital products, still emerging.
7. Geopolitical Exposure
Boston Scientific Corporation
- Operates globally, exposed to geopolitical tensions affecting healthcare trade and tariffs.
Align Technology, Inc.
- International sales concentrated in select markets, potentially impacted by trade policies and currency risks.
Which company shows a better risk-adjusted profile?
Boston Scientific’s principal risk lies in market competition and complex supply chains, but it maintains solid financial stability and lower stock volatility. Align Technology faces higher stock volatility and concerning interest coverage despite a strong balance sheet. The zero interest coverage ratio for Align raises caution about its short-term financial resilience. Boston Scientific’s diversified portfolio and safer leverage profile position it as the better risk-adjusted choice in 2026.
Final Verdict: Which stock to choose?
Boston Scientific (BSX) shines as a resilient cash generator with steadily improving profitability despite some value destruction. Its balance sheet shows moderate liquidity risks, a point of vigilance. BSX suits portfolios aiming for steady income with moderate growth exposure.
Align Technology (ALGN) boasts a strategic moat in its innovative digital orthodontics platform and a remarkably clean balance sheet with minimal debt. It offers better liquidity safety than BSX but faces challenges in sustaining growth. ALGN fits well into GARP portfolios seeking innovation with relative stability.
If you prioritize robust cash flow and improving operational efficiency, Boston Scientific outshines due to its growing earnings momentum despite valuation headwinds. However, if you seek exposure to innovation with stronger balance sheet stability, Align Technology offers better downside protection amid a tougher growth outlook. Both scenarios require careful risk assessment given their industry cyclicality and valuation premiums.
Disclaimer: Investment carries a risk of loss of initial capital. The past performance is not a reliable indicator of future results. Be sure to understand risks before making an investment decision.
Go Further
I encourage you to read the complete analyses of Boston Scientific Corporation and Align Technology, Inc. to enhance your investment decisions: