Alibaba Group Holding Limited and Williams-Sonoma, Inc. are two prominent players in the specialty retail sector, yet they operate with distinct business models and market focuses. Alibaba excels in global e-commerce and technology infrastructure, while Williams-Sonoma specializes in omni-channel home goods retail. This comparison explores their market overlap and innovation strategies to help you identify the most compelling investment opportunity for your portfolio. Let’s delve into which company stands out for investors today.

Table of contents
Companies Overview
I will begin the comparison between Alibaba and Williams-Sonoma by providing an overview of these two companies and their main differences.
Alibaba Overview
Alibaba Group Holding Limited focuses on providing technology infrastructure and marketing reach to merchants, brands, and retailers primarily in China and internationally. The company operates a diverse portfolio of e-commerce platforms, logistics, cloud computing, digital media, and AI services. Founded in 1999 and headquartered in Hangzhou, Alibaba is a major player in the specialty retail sector with a market cap of 350B USD and over 124K employees.
Williams-Sonoma Overview
Williams-Sonoma, Inc. is an omni-channel specialty retailer offering home products including cookware, furniture, and decor under multiple brands such as Williams Sonoma, Pottery Barn, and West Elm. Founded in 1956 and based in San Francisco, the company operates 544 stores across several countries and sells through e-commerce and catalogs. It has a market cap of 24B USD and employs around 19.6K people in the consumer cyclical sector.
Key similarities and differences
Both Alibaba and Williams-Sonoma operate in the specialty retail industry but differ significantly in scale and business models. Alibaba emphasizes technology-driven marketplaces and cloud services across global markets, while Williams-Sonoma focuses on physical and online retail of home goods primarily in North America and select international markets. Alibaba’s operations are broader, spanning logistics, entertainment, and AI, contrasting with Williams-Sonoma’s concentrated product and brand portfolio.
Income Statement Comparison
The table below presents the latest fiscal year income statement metrics for Alibaba Group Holding Limited and Williams-Sonoma, Inc., providing a side-by-side financial snapshot.

| Metric | Alibaba Group Holding Limited (BABA) | Williams-Sonoma, Inc. (WSM) |
|---|---|---|
| Market Cap | 350B CNY | 24.4B USD |
| Revenue | 996B CNY | 7.71B USD |
| EBITDA | 183B CNY | 1.66B USD |
| EBIT | 148B CNY | 1.43B USD |
| Net Income | 130B CNY | 1.13B USD |
| EPS | 55.12 CNY | 8.91 USD |
| Fiscal Year | 2025 | 2024 |
Income Statement Interpretations
Alibaba Group Holding Limited
Alibaba’s revenue showed a steady increase from 717B CNY in 2021 to nearly 996B CNY in 2025, marking a favorable overall growth trend. However, net income declined by 13.6% over the same period, with a net margin decrease of 37.8%, indicating margin pressure. The most recent year saw slower revenue growth of 5.9%, but improved gross profit and net margin, suggesting operational gains despite rising expenses.
Williams-Sonoma, Inc.
Williams-Sonoma’s revenue grew by 13.7% from 2020 to 2024 but dipped slightly by 0.5% in the latest year. Net income increased significantly by 65.3% overall, supported by a 45.4% net margin improvement. The 2024 fiscal year showed favorable growth in EBIT (15%) and EPS (21%), reflecting improved profitability and efficiency despite the minor revenue decline.
Which one has the stronger fundamentals?
Williams-Sonoma presents stronger income statement fundamentals, with consistent net income and margin improvements alongside solid revenue growth over the period. Alibaba shows robust revenue expansion but faces challenges with declining net income and margins overall, despite recent operational improvements. Williams-Sonoma’s superior margin stability and earnings growth suggest more favorable underlying financial health.
Financial Ratios Comparison
Below is a comparison of the most recent financial ratios for Alibaba Group Holding Limited (BABA) and Williams-Sonoma, Inc. (WSM), reflecting their fiscal year 2025 and 2024 data respectively.
| Ratios | Alibaba Group Holding Limited (BABA) FY 2025 | Williams-Sonoma, Inc. (WSM) FY 2024 |
|---|---|---|
| ROE | 12.9% | 52.5% |
| ROIC | 7.9% | 29.9% |
| P/E | 17.3 | 23.7 |
| P/B | 2.23 | 12.5 |
| Current Ratio | 1.54 | 1.44 |
| Quick Ratio | 1.49 | 0.74 |
| D/E (Debt-to-Equity) | 0.25 | 0.63 |
| Debt-to-Assets | 13.8% | 25.4% |
| Interest Coverage | 14.7 | 0 (not reported) |
| Asset Turnover | 0.55 | 1.45 |
| Fixed Asset Turnover | 3.99 | 3.49 |
| Payout Ratio | 22.3% | 24.9% |
| Dividend Yield | 1.29% | 1.05% |
Interpretation of the Ratios
Alibaba Group Holding Limited
Alibaba displays a generally favorable ratio profile with a strong current ratio of 1.54 and low debt levels, indicating solid liquidity and financial stability. Its net margin is favorable at 13.06%, though return on equity and invested capital remain neutral, highlighting moderate profitability. The dividend yield is neutral at 1.29%, supported by sustainable payouts and moderate share repurchases without evident risk.
Williams-Sonoma, Inc.
Williams-Sonoma presents strong profitability metrics, including a high return on equity of 52.52% and robust return on invested capital at 29.89%. However, some liquidity ratios, such as the quick ratio at 0.74, are unfavorable, suggesting potential short-term liquidity concerns. The dividend yield is neutral at 1.05%, with stable payouts and no excessive risk from distribution or repurchase programs noted.
Which one has the best ratios?
Alibaba offers a more balanced and financially stable ratio structure, with favorable liquidity and manageable debt, while Williams-Sonoma excels in profitability but shows some weaknesses in liquidity and valuation multiples. Overall, Alibaba’s ratios lean more consistently favorable, whereas Williams-Sonoma is slightly favorable but with notable mixed signals.
Strategic Positioning
This section compares the strategic positioning of Alibaba Group Holding Limited and Williams-Sonoma, Inc., focusing on market position, key segments, and exposure to technological disruption:
Alibaba Group Holding Limited
- Leading specialty retailer with significant scale; faces moderate competitive pressure in China and globally.
- Diverse segments including commerce, cloud services, logistics, digital media, and innovation initiatives.
- Strong technology integration with cloud, AI, digital platforms, and logistics; high exposure to tech disruption.
Williams-Sonoma, Inc.
- Specialty retailer focused on home products, operating in North America and select international markets; faces higher competitive pressure.
- Concentrated on home furnishings and decor with multiple lifestyle brands and omni-channel sales.
- Uses augmented reality and 3-D imaging in home decor; moderate exposure to technological changes in retail.
Alibaba Group Holding Limited vs Williams-Sonoma, Inc. Positioning
Alibaba pursues a highly diversified strategy across multiple sectors including e-commerce, cloud, and logistics, offering scale advantages. Williams-Sonoma concentrates on home specialty retail with strong brand segmentation but less diversification, affecting market reach and growth drivers.
Which has the best competitive advantage?
Both companies demonstrate very favorable economic moats with growing ROIC trends, indicating durable competitive advantages. Alibaba’s scale and technology breadth contrast with Williams-Sonoma’s focused brand strength and efficient capital use.
Stock Comparison
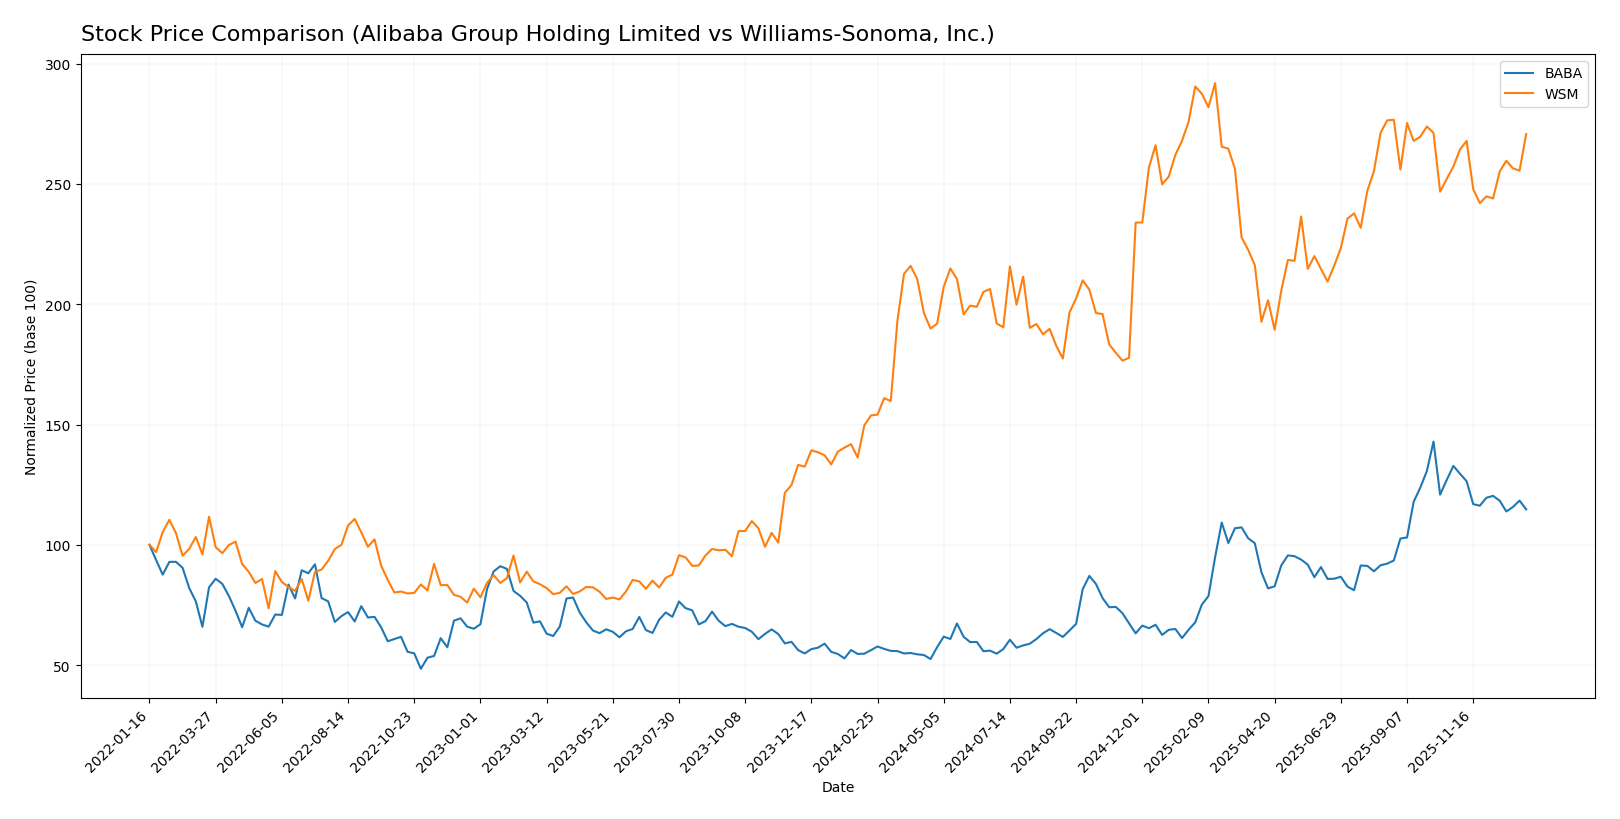
The stock price movements of Alibaba Group Holding Limited (BABA) and Williams-Sonoma, Inc. (WSM) over the past 12 months reveal strong overall bullish trends with notable deceleration phases and contrasting recent trading dynamics.
Trend Analysis
Alibaba’s stock showed a bullish trend with a 104.25% increase over the past year, though the pace has decelerated. It reached a high of 188.03 and a low of 69.07, with a recent 13.59% decline indicating short-term weakness.
Williams-Sonoma posted a bullish trend with a 76.06% gain over the same period, also experiencing deceleration. Its price ranged between 113.05 and 214.6, with recent modest gains of 5.26% reflecting slight upward momentum.
Comparing both, Alibaba delivered the highest market performance overall, despite recent downward pressure, while Williams-Sonoma maintained steadier short-term growth.
Target Prices
The current analyst consensus indicates promising upside potential for both Alibaba Group Holding Limited and Williams-Sonoma, Inc.
| Company | Target High | Target Low | Consensus |
|---|---|---|---|
| Alibaba Group Holding Limited | 225 | 140 | 186.98 |
| Williams-Sonoma, Inc. | 230 | 175 | 205.75 |
Analysts expect Alibaba’s stock to rise from its current price of $150.96 toward the consensus target of $186.98, while Williams-Sonoma’s $199.04 stock price aligns closely with a $205.75 consensus target, signaling moderate growth potential.
Analyst Opinions Comparison
This section compares analysts’ ratings and grades for Alibaba Group Holding Limited and Williams-Sonoma, Inc.:
Rating Comparison
Alibaba Group Holding Limited Rating
- Rating: B+; classified as Very Favorable by analysts.
- Discounted Cash Flow Score: 3 indicating a moderate valuation outlook.
- ROE Score: 4, favorable for efficient profit generation from equity.
- ROA Score: 4, favorable utilization of assets to generate earnings.
- Debt To Equity Score: 3, moderate financial risk level.
- Overall Score: 3, representing a moderate overall financial standing.
Williams-Sonoma, Inc. Rating
- Rating: B+; also Very Favorable according to analysts.
- Discounted Cash Flow Score: 3, suggesting a moderate valuation.
- ROE Score: 5, very favorable, showing strong equity profit use.
- ROA Score: 5, very favorable, demonstrating excellent asset use.
- Debt To Equity Score: 2, indicating lower financial risk.
- Overall Score: 3, also moderate overall financial strength.
Which one is the best rated?
Both Alibaba and Williams-Sonoma share the same B+ rating and overall score of 3, indicating moderate financial standing. However, Williams-Sonoma scores higher on ROE and ROA, while Alibaba has a slightly better debt-to-equity score.
Scores Comparison
Here is a comparison of the Altman Z-Score and Piotroski Score for Alibaba and Williams-Sonoma:
Alibaba Scores
- Altman Z-Score: 1.72, indicating financial distress risk.
- Piotroski Score: 8, classified as very strong financial health.
Williams-Sonoma Scores
- Altman Z-Score: 7.04, indicating a very safe financial zone.
- Piotroski Score: 7, classified as strong financial health.
Which company has the best scores?
Williams-Sonoma has a significantly higher Altman Z-Score, placing it in the safe zone, while Alibaba is in distress. Alibaba’s Piotroski Score is slightly higher, indicating very strong financial health compared to Williams-Sonoma’s strong score.
Grades Comparison
Here is a detailed comparison of the latest grades issued by reputable grading companies for both Alibaba Group Holding Limited and Williams-Sonoma, Inc.:
Alibaba Group Holding Limited Grades
The following table summarizes recent grades from recognized financial institutions for Alibaba:
| Grading Company | Action | New Grade | Date |
|---|---|---|---|
| Jefferies | Maintain | Buy | 2026-01-08 |
| Freedom Capital Markets | Downgrade | Hold | 2026-01-06 |
| Benchmark | Maintain | Buy | 2025-11-26 |
| Bernstein | Maintain | Outperform | 2025-11-26 |
| Citigroup | Maintain | Buy | 2025-11-26 |
| JP Morgan | Maintain | Overweight | 2025-11-26 |
| Barclays | Maintain | Overweight | 2025-11-26 |
| Bernstein | Maintain | Outperform | 2025-10-10 |
| JP Morgan | Maintain | Overweight | 2025-10-09 |
| JP Morgan | Maintain | Overweight | 2025-10-01 |
Alibaba’s grades predominantly indicate a strong buy or outperform stance, with a single recent downgrade to hold, reflecting overall confidence but some caution.
Williams-Sonoma, Inc. Grades
Below is the summary of recent grades from established grading companies for Williams-Sonoma:
| Grading Company | Action | New Grade | Date |
|---|---|---|---|
| Evercore ISI Group | Maintain | In Line | 2025-12-23 |
| RBC Capital | Maintain | Outperform | 2025-11-21 |
| Telsey Advisory Group | Maintain | Outperform | 2025-11-20 |
| UBS | Maintain | Neutral | 2025-11-20 |
| TD Cowen | Maintain | Buy | 2025-11-20 |
| Citigroup | Maintain | Neutral | 2025-11-20 |
| Telsey Advisory Group | Maintain | Outperform | 2025-11-19 |
| Telsey Advisory Group | Maintain | Outperform | 2025-11-14 |
| Wells Fargo | Maintain | Equal Weight | 2025-11-11 |
| Evercore ISI Group | Maintain | In Line | 2025-10-14 |
Williams-Sonoma’s grades are mixed, predominantly ranging from neutral to outperform, with a consensus leaning more toward holding or moderate confidence.
Which company has the best grades?
Alibaba Group Holding Limited has received generally stronger grades, mostly buy and outperform ratings, compared to Williams-Sonoma’s more mixed and neutral to outperform grades. This difference may imply higher analyst confidence in Alibaba’s future performance, potentially offering investors a more bullish outlook.
Strengths and Weaknesses
Below is a comparison table highlighting the key strengths and weaknesses of Alibaba Group Holding Limited (BABA) and Williams-Sonoma, Inc. (WSM) based on their recent financial and strategic data.
| Criterion | Alibaba Group Holding Limited (BABA) | Williams-Sonoma, Inc. (WSM) |
|---|---|---|
| Diversification | Highly diversified with strong segments in Customer Management (424B CNY), Logistics (123B CNY), Cloud Services (85B CNY) | Diversified across home furnishing brands; largest revenue from Pottery Barn (3B USD) and West Elm (1.8B USD) |
| Profitability | Moderate net margin 13.06%, ROIC 7.87%, stable and favorable margins | Strong profitability: net margin 14.59%, very high ROIC 29.89%, and ROE 52.52% |
| Innovation | Significant investment in Cloud and tech services; growing ROIC indicates innovation | Innovation in premium home goods, but less tech-driven; ROIC growing steadily |
| Global presence | Extensive global footprint especially in Asia, strong logistics network | Primarily US-focused with some international reach, less global scale than BABA |
| Market Share | Large market share in e-commerce and cloud in China and Asia | Strong niche market share in premium US home furnishings |
In summary, Alibaba excels in diversification and global scale with solid profitability, while Williams-Sonoma demonstrates superior profitability and a focused premium brand portfolio. Investors should weigh Alibaba’s broader market reach against Williams-Sonoma’s high returns and niche dominance. Both companies show durable competitive advantages with growing profitability.
Risk Analysis
Below is a comparative table highlighting key risks for Alibaba Group Holding Limited (BABA) and Williams-Sonoma, Inc. (WSM) based on the most recent data from 2025 and 2024 respectively:
| Metric | Alibaba Group Holding Limited (BABA) | Williams-Sonoma, Inc. (WSM) |
|---|---|---|
| Market Risk | Moderate, beta 0.36 indicates lower volatility relative to market | Higher, beta 1.58 shows greater sensitivity to market swings |
| Debt level | Low leverage, debt-to-equity 0.25 and debt to assets 13.75% favorable | Moderate leverage, debt-to-equity 0.63, but interest coverage very strong |
| Regulatory Risk | Elevated due to Chinese government scrutiny on tech and e-commerce sectors | Moderate, subject to US and international trade regulations |
| Operational Risk | Complex global operations with diverse segments, moderate asset turnover (0.55) | Streamlined specialty retail operations, higher asset turnover (1.45) |
| Environmental Risk | Moderate, with growing focus on sustainability in China | Moderate, retail operations with supply chain footprint |
| Geopolitical Risk | High, due to China-US tensions impacting global trade and listings | Moderate, mostly US-based but with international exposure |
In summary, Alibaba faces significant geopolitical and regulatory risks that could impact its growth and valuation, despite strong financial stability. Williams-Sonoma shows higher market risk and some leverage concerns but benefits from robust profitability and a safer financial position. Investors should weigh Alibaba’s regulatory environment and geopolitical tensions carefully against its innovation potential.
Which Stock to Choose?
Alibaba Group Holding Limited (BABA) shows a favorable income evolution with a 5.86% revenue growth in the last year and strong profitability, including a 13.06% net margin. Financial ratios are largely favorable, with a solid current ratio (1.54), low debt-to-equity (0.25), and a very favorable global ratio evaluation. The company’s rating is very favorable (B+), supported by a strong Piotroski score (8) despite an Altman Z-Score in the distress zone (1.72). Its economic moat is very favorable, reflecting durable competitive advantages and growing ROIC.
Williams-Sonoma, Inc. (WSM) presents a slightly mixed income evolution, with a small revenue decline (-0.5%) last year but positive net margin growth (14.59%) overall. Financial ratios are slightly less favorable, showing a lower quick ratio (0.74) and some unfavorable valuation metrics like a high price-to-book ratio (12.45), though profitability ratios such as ROE (52.52%) and ROIC (29.89%) are strong. The rating is also very favorable (B+), with a safe Altman Z-Score (7.04) and a strong Piotroski score (7). Its moat is very favorable with growing ROIC and value creation.
For investors, BABA may appear attractive for those seeking a company with a favorable income trend and balanced financial health supported by a durable moat, despite some caution indicated by its bankruptcy risk score. WSM might appeal more to risk-tolerant investors valuing high profitability and financial safety, though with some valuation concerns. The choice could be influenced by whether one prioritizes income growth stability or strong returns on capital with financial safety.
Disclaimer: Investment carries a risk of loss of initial capital. The past performance is not a reliable indicator of future results. Be sure to understand risks before making an investment decision.
Go Further
I encourage you to read the complete analyses of Alibaba Group Holding Limited and Williams-Sonoma, Inc. to enhance your investment decisions: