Alibaba Group Holding Limited and Ulta Beauty, Inc. are two prominent players in the specialty retail sector, yet they cater to vastly different markets—Alibaba dominates e-commerce and technology infrastructure across Asia and beyond, while Ulta Beauty leads in beauty retail across the United States. Their shared focus on innovation and customer engagement makes this comparison particularly insightful. In this article, I will help you determine which company could be the most compelling addition to your investment portfolio.
Table of contents
Companies Overview
I will begin the comparison between Alibaba Group Holding Limited and Ulta Beauty, Inc. by providing an overview of these two companies and their main differences.
Alibaba Group Holding Limited Overview
Alibaba Group Holding Limited, headquartered in Hangzhou, China, operates as a leading technology and specialty retail company. Its mission focuses on providing technology infrastructure and marketing reach to merchants, brands, and retailers both domestically and internationally. Alibaba’s diversified business spans e-commerce platforms, cloud computing, digital media, logistics, and artificial intelligence, serving millions of users through its multiple subsidiaries and digital services.
Ulta Beauty, Inc. Overview
Ulta Beauty, Inc., based in Bolingbrook, Illinois, is a prominent U.S. specialty retailer in the consumer cyclical sector, focusing on beauty products and salon services. Operating over 1,300 stores nationwide, Ulta offers cosmetics, skincare, haircare, and professional salon services, alongside private label products. The company also engages customers through its website and mobile apps, emphasizing a comprehensive beauty retail experience.
Key similarities and differences
Both Alibaba and Ulta operate within the specialty retail industry but differ significantly in scope and business models. Alibaba’s vast technology-driven ecosystem spans global e-commerce, cloud services, and digital media, while Ulta concentrates on beauty retail and salon services predominantly in the U.S. market. Alibaba’s market cap stands at 350B USD with high employee count, reflecting its scale, whereas Ulta’s 30B USD market cap and focused product range highlight a niche retail strategy.
Income Statement Comparison
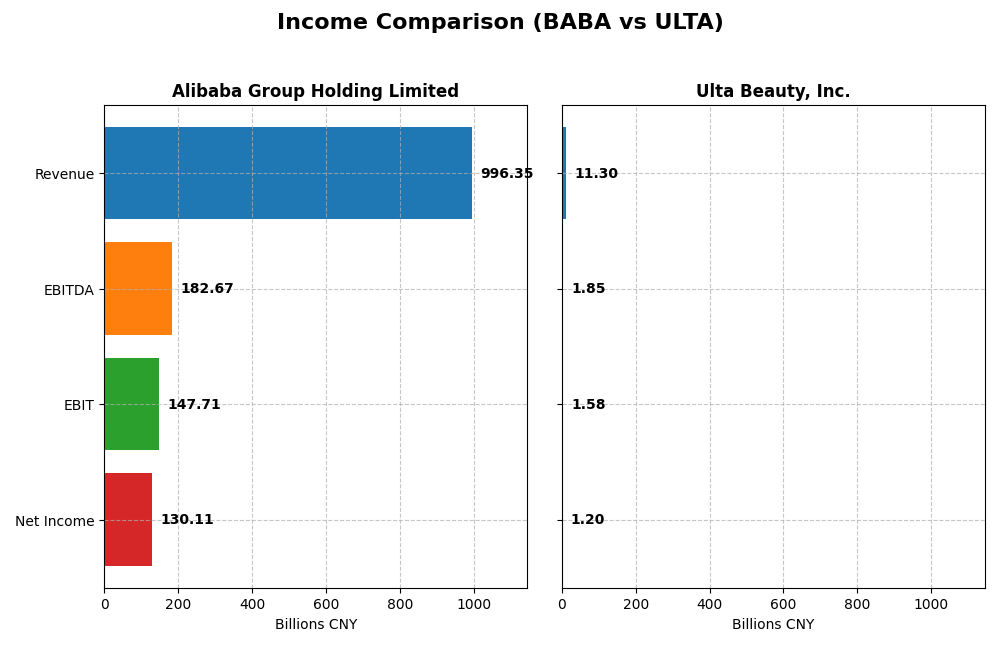
Below is a side-by-side comparison of key income statement metrics for Alibaba Group Holding Limited and Ulta Beauty, Inc. for their most recent fiscal years.
| Metric | Alibaba Group Holding Limited | Ulta Beauty, Inc. |
|---|---|---|
| Market Cap | 350B CNY | 29.9B USD |
| Revenue | 996B CNY | 11.3B USD |
| EBITDA | 183B CNY | 1.85B USD |
| EBIT | 148B CNY | 1.58B USD |
| Net Income | 130B CNY | 1.20B USD |
| EPS | 55.12 CNY | 25.44 USD |
| Fiscal Year | 2025 | 2024 |
Income Statement Interpretations
Alibaba Group Holding Limited
Alibaba’s revenue grew steadily from 717B CNY in 2021 to nearly 1T CNY in 2025, marking a 38.9% increase over five years. Net income fluctuated, peaking in 2021 at 150B CNY before declining to 129B CNY in 2025. Margins show mixed trends: gross margin improved to 39.95% while net margin declined to 13.06%. The latest year showed moderate revenue growth (5.86%) but strong net margin and EPS expansion (53.61% and 70.92%, respectively).
Ulta Beauty, Inc.
Ulta’s revenue expanded from $6.15B in 2020 to $11.3B in 2024, an 83.6% rise over the period. Net income surged even more dramatically from $176M to $1.2B, reflecting strong profitability gains. Gross margin remained stable at about 38.8%, with a net margin near 10.6%. However, recent growth slowed, with revenue up just 0.79% and net margin slipping by 7.69% in the latest year, alongside a slight EPS decline of 2.65%.
Which one has the stronger fundamentals?
Both companies exhibit favorable income statement fundamentals, with Alibaba showing strong margins and significant EPS growth last year, despite some net income volatility. Ulta demonstrates impressive overall revenue and net income growth over five years, though recent performance softened. Alibaba’s income statement suggests margin resilience, while Ulta’s history highlights robust expansion but recent margin pressure.
Financial Ratios Comparison
The table below displays key financial ratios for Alibaba Group Holding Limited and Ulta Beauty, Inc. based on their most recent fiscal year data, facilitating a straightforward comparison.
| Ratios | Alibaba Group Holding Limited (2025) | Ulta Beauty, Inc. (2024) |
|---|---|---|
| ROE | 12.9% | 48.3% |
| ROIC | 7.9% | 26.6% |
| P/E | 17.3 | 16.2 |
| P/B | 2.23 | 7.82 |
| Current Ratio | 1.54 | 1.70 |
| Quick Ratio | 1.49 | 0.60 |
| D/E | 0.25 | 0.77 |
| Debt-to-Assets | 13.8% | 32.0% |
| Interest Coverage | 14.7 | 0 |
| Asset Turnover | 0.55 | 1.88 |
| Fixed Asset Turnover | 3.99 | 3.96 |
| Payout Ratio | 22.3% | 0 |
| Dividend Yield | 1.29% | 0 |
Interpretation of the Ratios
Alibaba Group Holding Limited
Alibaba exhibits a generally favorable financial profile with 57% of its ratios rated positively, including a strong interest coverage of 15.39 and a sound current ratio of 1.54. Neutral ratings on ROE at 12.86% and P/E at 17.32 suggest moderate profitability and valuation. Its dividend yield of 1.29% is supported by a consistent payout, reflecting stable shareholder returns without excessive risk.
Ulta Beauty, Inc.
Ulta also shows 57% favorable ratios, highlighted by a strong ROE of 48.27% and an impressive asset turnover of 1.88, indicating efficient use of assets. However, concerns arise from a low quick ratio of 0.6 and an unfavorable price-to-book ratio of 7.82. The company does not pay dividends, likely prioritizing reinvestment and growth, with no share buyback programs noted.
Which one has the best ratios?
Both companies have a favorable overall ratio assessment at 57%, yet Alibaba’s financial stability is underscored by lower leverage and better liquidity ratios. Ulta’s higher profitability contrasts with some liquidity and valuation concerns. Thus, Alibaba appears slightly more balanced in risk management, while Ulta demonstrates stronger returns but with increased financial risk.
Strategic Positioning
This section compares the strategic positioning of Alibaba and Ulta, focusing on market position, key segments, and exposure to disruption:
Alibaba Group Holding Limited
- Leading e-commerce platform in China with broad international reach amid competitive retail landscape.
- Diverse segments including e-commerce, cloud services, logistics, digital media, and innovation initiatives.
- Significant integration of technology platforms including AI, cloud, and digital marketing services.
Ulta Beauty, Inc.
- U.S.-focused specialty beauty retailer with strong brand presence and retail store footprint.
- Concentrated on beauty products, salon services, and private label products driving revenue.
- Limited explicit exposure to technological disruption mentioned; emphasis on physical retail and e-commerce.
Alibaba vs Ulta Positioning
Alibaba pursues a diversified strategy across multiple sectors and technologies, offering resilience but complexity. Ulta focuses intensively on beauty retail and services, providing concentration benefits but potential vulnerability to market shifts.
Which has the best competitive advantage?
Both companies demonstrate very favorable moats with growing ROICs above WACC, indicating durable competitive advantages. Ulta’s higher ROIC spread suggests a stronger value creation relative to cost of capital compared to Alibaba.
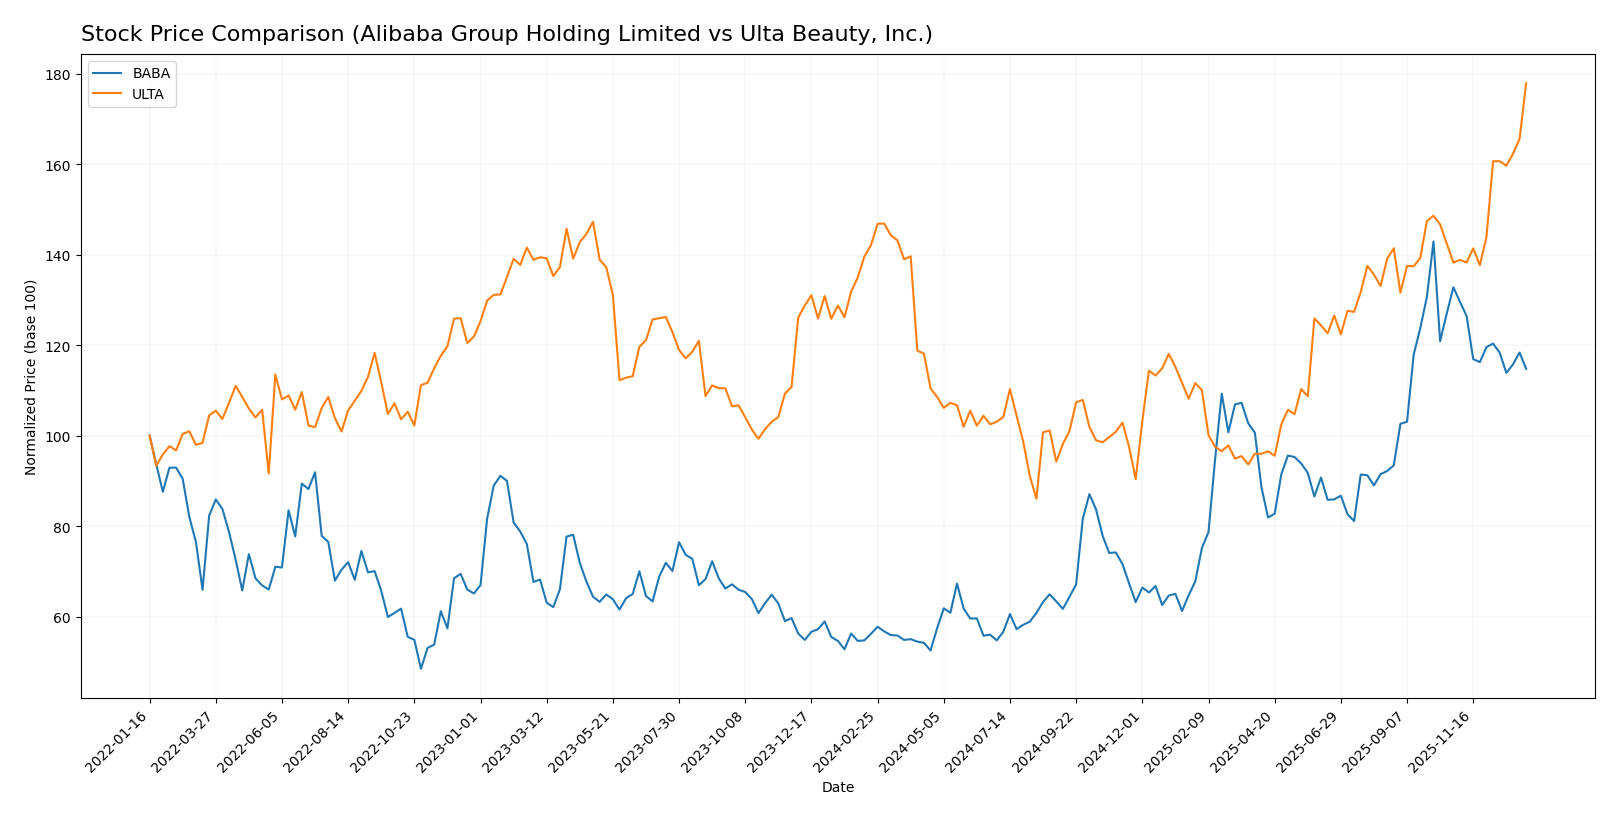
Stock Comparison
Over the past 12 months, Alibaba Group Holding Limited and Ulta Beauty, Inc. exhibited distinct bullish trends with notable price gains and contrasting recent momentum in trading dynamics.
Trend Analysis
Alibaba’s stock price surged 104.25% over the past year, indicating a bullish trend with decelerating momentum and a high volatility level at 31.46. It reached a peak of 188.03 and a low of 69.07.
Ulta’s stock gained 25.2% during the same period, reflecting a bullish trend with accelerating momentum and higher volatility at 78.09. The price ranged between 322.17 and 666.18.
Comparing both, Alibaba delivered the highest market performance over the last year despite recent downward pressure, while Ulta showed strong recent acceleration with buyer dominance.
Target Prices
Here is the current consensus target price overview from verified analysts for Alibaba Group Holding Limited and Ulta Beauty, Inc.
| Company | Target High | Target Low | Consensus |
|---|---|---|---|
| Alibaba Group Holding Limited | 225 | 140 | 186.98 |
| Ulta Beauty, Inc. | 780 | 425 | 648.4 |
Analysts expect Alibaba’s stock to appreciate significantly from its current price of $150.96, while Ulta Beauty’s consensus target slightly exceeds its current trading price of $666.18, indicating moderate upside potential.
Analyst Opinions Comparison
This section compares analysts’ ratings and grades for Alibaba Group Holding Limited and Ulta Beauty, Inc.:
Rating Comparison
Alibaba Group Holding Limited Rating
- Rating: B+, categorized as Very Favorable by analysts.
- Discounted Cash Flow Score: 3, indicating moderate value.
- ROE Score: 4, showing favorable efficiency in equity use.
- ROA Score: 4, indicating favorable asset utilization.
- Debt To Equity Score: 3, reflecting moderate financial risk.
- Overall Score: 3, representing a moderate overall rating.
Ulta Beauty, Inc. Rating
- Rating: A-, categorized as Very Favorable by analysts.
- Discounted Cash Flow Score: 4, indicating favorable value.
- ROE Score: 5, showing very favorable efficiency in equity use.
- ROA Score: 5, indicating very favorable asset utilization.
- Debt To Equity Score: 2, reflecting moderate financial risk but lower than Alibaba.
- Overall Score: 4, representing a favorable overall rating.
Which one is the best rated?
Based strictly on provided data, Ulta Beauty holds a higher overall rating (A- vs. B+) and scores better on discounted cash flow, ROE, and ROA metrics, indicating stronger financial performance compared to Alibaba.
Scores Comparison
The comparison of financial health scores between Alibaba and Ulta is as follows:
Alibaba Scores
- Altman Z-Score: 1.72, indicating financial distress.
- Piotroski Score: 8, showing very strong financial health.
Ulta Scores
- Altman Z-Score: 6.64, indicating a safe zone.
- Piotroski Score: 6, showing average financial health.
Which company has the best scores?
Based on the provided data, Ulta has a significantly higher Altman Z-Score, placing it in a safer financial position, while Alibaba has a stronger Piotroski Score, indicating better overall financial strength.
Grades Comparison
The following section presents the latest reliable grades issued by recognized financial institutions for both companies:
Alibaba Group Holding Limited Grades
This table shows recent grades from major financial grading companies for Alibaba Group Holding Limited.
| Grading Company | Action | New Grade | Date |
|---|---|---|---|
| Jefferies | Maintain | Buy | 2026-01-08 |
| Freedom Capital Markets | Downgrade | Hold | 2026-01-06 |
| Benchmark | Maintain | Buy | 2025-11-26 |
| Bernstein | Maintain | Outperform | 2025-11-26 |
| Citigroup | Maintain | Buy | 2025-11-26 |
| JP Morgan | Maintain | Overweight | 2025-11-26 |
| Barclays | Maintain | Overweight | 2025-11-26 |
| Bernstein | Maintain | Outperform | 2025-10-10 |
| JP Morgan | Maintain | Overweight | 2025-10-09 |
| JP Morgan | Maintain | Overweight | 2025-10-01 |
Alibaba’s grades predominantly indicate a strong buy and outperform stance with one recent hold downgrade, showing overall positive confidence from analysts.
Ulta Beauty, Inc. Grades
This table presents recent ratings from established grading firms for Ulta Beauty, Inc.
| Grading Company | Action | New Grade | Date |
|---|---|---|---|
| B of A Securities | Maintain | Neutral | 2026-01-08 |
| UBS | Maintain | Buy | 2026-01-07 |
| Argus Research | Maintain | Buy | 2026-01-02 |
| Oppenheimer | Maintain | Outperform | 2025-12-10 |
| TD Cowen | Upgrade | Buy | 2025-12-08 |
| Morgan Stanley | Maintain | Overweight | 2025-12-08 |
| Guggenheim | Maintain | Neutral | 2025-12-05 |
| UBS | Maintain | Buy | 2025-12-05 |
| Canaccord Genuity | Maintain | Buy | 2025-12-05 |
| Baird | Maintain | Outperform | 2025-12-05 |
Ulta’s grades predominantly favor buy and outperform ratings, with a few neutral stances, reflecting consistent analyst support.
Which company has the best grades?
Both Alibaba and Ulta display predominantly positive grades, but Alibaba has a higher number of buy, outperform, and overweight ratings from top-tier firms. This stronger consensus may influence investors toward perceiving Alibaba as a more confidently rated option, potentially impacting portfolio decisions based on analyst conviction levels.
Strengths and Weaknesses
Below is a comparison of key strengths and weaknesses of Alibaba Group Holding Limited (BABA) and Ulta Beauty, Inc. (ULTA) based on the most recent data.
| Criterion | Alibaba Group Holding Limited (BABA) | Ulta Beauty, Inc. (ULTA) |
|---|---|---|
| Diversification | Highly diversified with strong segments in Customer Management Services (424B CNY), Logistics (123B CNY), Cloud Services (85B CNY), and Sales of Goods (274B CNY). | Focused primarily on beauty products and salon services, with growing e-commerce sales but less diversified overall. |
| Profitability | Net margin of 13.06%, ROIC 7.87%, ROE 12.86% – profitable with favorable margins but moderate returns on capital. | Net margin 10.63%, ROIC 26.61%, ROE 48.27% – very strong profitability and efficient capital use. |
| Innovation | Strong in cloud services and technology-driven logistics; consistent growth in ROIC (+40.8%) indicates sustained innovation. | Innovation evident in retail experience and digital growth; ROIC growth extremely high (+345.8%), reflecting strong business model evolution. |
| Global presence | Extensive global footprint with large-scale operations in China and international markets. | Primarily US-focused with limited international exposure, concentrating on domestic market leadership. |
| Market Share | Leading player in e-commerce and cloud services in China with large market share in multiple segments. | Leading specialty beauty retailer in the US, strong brand loyalty but niche compared to Alibaba’s scale. |
Key takeaways: Alibaba offers strong diversification and global reach with solid profitability, while Ulta Beauty excels in profitability and innovation within a focused niche. Both companies demonstrate durable competitive advantages but differ in scale and market scope.
Risk Analysis
Below is a comparative table outlining key risk metrics for Alibaba Group Holding Limited (BABA) and Ulta Beauty, Inc. (ULTA) based on the most recent data available:
| Metric | Alibaba Group Holding Limited (BABA) | Ulta Beauty, Inc. (ULTA) |
|---|---|---|
| Market Risk | Low beta (0.36) indicates lower volatility relative to the market | Moderate beta (0.85) suggests moderate market sensitivity |
| Debt level | Low debt-to-equity (0.25), favorable leverage | Moderate debt-to-equity (0.77), neutral leverage risk |
| Regulatory Risk | High, due to Chinese regulatory environment tightening | Moderate, mainly US retail and cosmetic regulations |
| Operational Risk | Moderate, large-scale diverse operations with tech and retail exposure | Moderate, dependent on retail store performance and e-commerce |
| Environmental Risk | Moderate, growing focus on sustainability in China and logistics | Moderate, with increasing pressure on retail sustainability practices |
| Geopolitical Risk | High, tied to US-China tensions and international trade policies | Low to moderate, primarily domestic US exposure |
The most impactful and likely risks are Alibaba’s regulatory and geopolitical challenges stemming from China’s evolving policies and international tensions, which could affect growth and valuation. Ulta faces moderate market and leverage risks but benefits from a stable domestic environment and strong operational metrics. Careful monitoring of regulatory developments and debt management is advised for both.
Which Stock to Choose?
Alibaba Group Holding Limited (BABA) shows a generally favorable income evolution with a 5.86% revenue growth last year and strong profitability metrics, including a 13.06% net margin and 12.86% ROE. Its debt levels are low with a debt-to-equity ratio of 0.25, and it holds a very favorable overall rating of B+.
Ulta Beauty, Inc. (ULTA) presents mixed income growth, with a modest 0.79% revenue increase last year but a strong overall growth period. Profitability is solid, with a 10.63% net margin and an impressive 48.27% ROE. Debt is moderate with a debt-to-equity of 0.77, and it has a very favorable rating of A-.
For investors seeking durable competitive advantage and strong profitability, both companies show very favorable moat evaluations and global financial ratios. Growth-focused investors might see Ulta’s higher ROE and accelerating stock trend as attractive, while those favoring stability and moderate debt could find Alibaba’s solid income and balanced leverage more appealing.
Disclaimer: Investment carries a risk of loss of initial capital. The past performance is not a reliable indicator of future results. Be sure to understand risks before making an investment decision.
Go Further
I encourage you to read the complete analyses of Alibaba Group Holding Limited and Ulta Beauty, Inc. to enhance your investment decisions: