Home > Comparison > Consumer Cyclical > BABA vs TSCO
The strategic rivalry between Alibaba Group Holding Limited and Tractor Supply Company shapes the competitive dynamics within the Consumer Cyclical sector. Alibaba operates as a diversified, technology-driven specialty retailer with a global digital ecosystem, while Tractor Supply focuses on rural lifestyle retail across the U.S. This analysis explores their contrasting operational models and growth strategies to determine which offers a superior risk-adjusted return for a diversified portfolio.

Table of contents
Companies Overview
Alibaba Group Holding Limited and Tractor Supply Company both anchor the specialty retail sector with distinct market footprints and customer bases.
Alibaba Group Holding Limited: Global E-Commerce and Technology Powerhouse
Alibaba dominates the digital retail ecosystem in China and beyond. Its core revenue stems from diverse platforms like Taobao, Tmall, and AliExpress, which connect merchants and consumers through online marketplaces. In 2026, it focuses on expanding cloud computing, logistics, and AI-driven services to deepen its technological moat and sustain competitive edge.
Tractor Supply Company: Leading Rural Lifestyle Retailer in the US
Tractor Supply serves recreational farmers and rural communities with a broad range of agricultural and lifestyle products. Its revenue primarily comes from physical retail stores and e-commerce platforms offering pet supplies, hardware, and seasonal goods. The company emphasizes expanding its store footprint and enhancing e-commerce capabilities to capture rural market growth.
Strategic Collision: Similarities & Divergences
Alibaba pursues a closed, tech-driven ecosystem leveraging digital scale and innovation. Tractor Supply relies on a brick-and-mortar plus e-commerce hybrid, focusing on niche rural customers. Their primary battleground is retail access—Alibaba excels in online reach, Tractor Supply in physical presence. These differences create distinct investment profiles: Alibaba offers tech growth exposure, while Tractor Supply provides steady retail resilience.
Income Statement Comparison
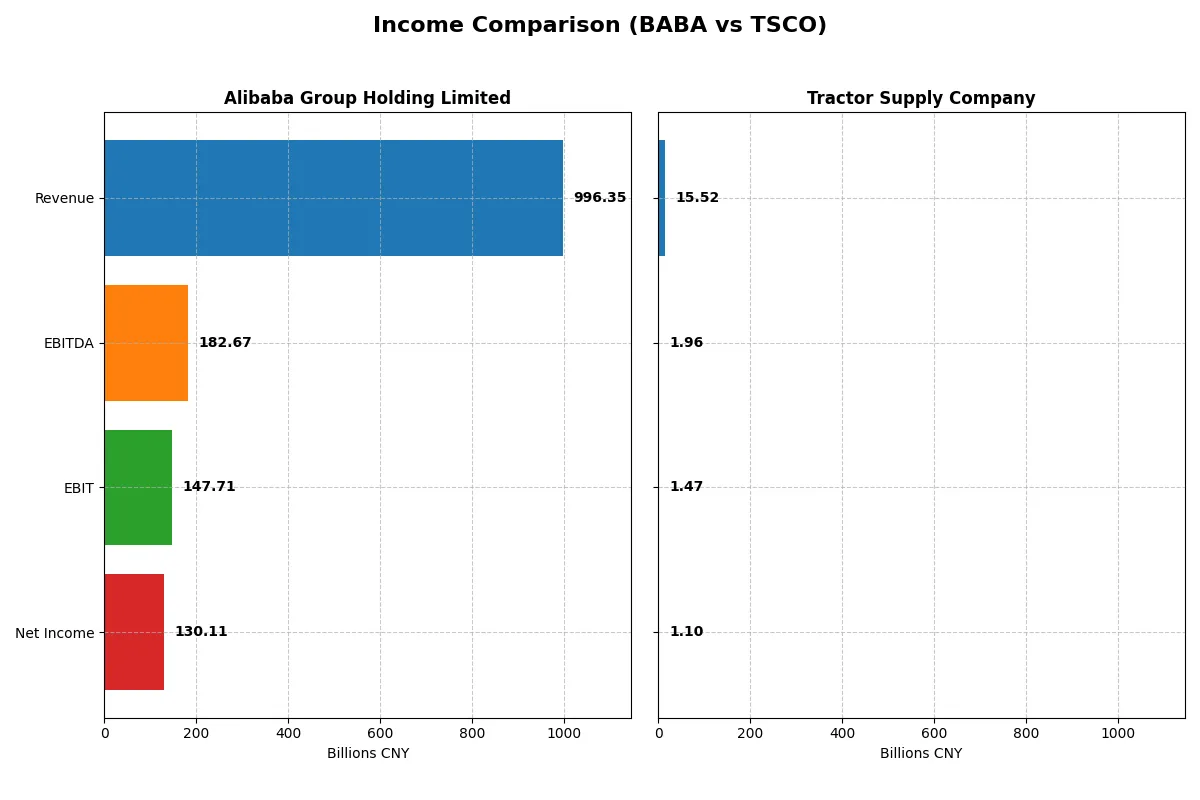
This data dissects the core profitability and scalability of both corporate engines to reveal who dominates the bottom line:
| Metric | Alibaba Group Holding Limited (BABA) | Tractor Supply Company (TSCO) |
|---|---|---|
| Revenue | 996B CNY | 15.5B USD |
| Cost of Revenue | 598B CNY | 10.4B USD |
| Operating Expenses | 257B CNY | 3.7B USD |
| Gross Profit | 398B CNY | 5.2B USD |
| EBITDA | 183B CNY | 2.0B USD |
| EBIT | 148B CNY | 1.5B USD |
| Interest Expense | 9.6B CNY | 69M USD |
| Net Income | 130B CNY | 1.1B USD |
| EPS | 55.12 CNY | 2.07 USD |
| Fiscal Year | 2025 | 2025 |
Income Statement Analysis: The Bottom-Line Duel
This income statement comparison reveals how each company’s financial engine converts revenue into profit and operational strength.
Alibaba Group Holding Limited Analysis
Alibaba’s revenue climbed 6% in 2025 to 996B CNY, while net income surged 63% to 130B CNY, signaling strong profit acceleration. Its gross margin stays robust near 40%, and net margin improved sharply to 13%, reflecting enhanced operational efficiency despite increased expenses. Alibaba’s momentum in expanding earnings per share by 71% stands out.
Tractor Supply Company Analysis
Tractor Supply’s revenue grew 4.3% in 2025 to $15.5B, but net income edged down slightly to $1.1B, indicating margin pressure. The gross margin contracted modestly to 33%, and its net margin sits at 7%, highlighting tighter profitability. Operating expenses aligned well with revenue growth, but EBIT and net margin dips suggest challenges sustaining momentum.
Margin Power vs. Revenue Scale
Alibaba outperforms Tractor Supply with stronger margin expansion and faster net income growth, despite Tractor’s steady revenue gains. Alibaba’s superior profitability and EPS surge position it as the fundamentally stronger engine. Investors seeking robust margin improvement may favor Alibaba’s profile, while Tractor Supply offers steadier but more modest growth.
Financial Ratios Comparison
These vital ratios act as a diagnostic tool to expose the underlying fiscal health, valuation premiums, and capital efficiency of companies:
| Ratios | Alibaba Group Holding Limited (BABA) | Tractor Supply Company (TSCO) |
|---|---|---|
| ROE | 12.9% | 42.5% |
| ROIC | 7.9% | 13.1% |
| P/E | 17.3 | 24.2 |
| P/B | 2.23 | 10.3 |
| Current Ratio | 1.54 | 1.34 |
| Quick Ratio | 1.49 | 0.16 |
| D/E (Debt to Equity) | 0.25 | 3.73 |
| Debt-to-Assets | 13.8% | 88.1% |
| Interest Coverage | 14.7 | 21.2 |
| Asset Turnover | 0.55 | 1.42 |
| Fixed Asset Turnover | 3.99 | 2.23 |
| Payout ratio | 22.5% | 44.5% |
| Dividend yield | 1.30% | 1.84% |
| Fiscal Year | 2025 | 2025 |
Efficiency & Valuation Duel: The Vital Signs
Financial ratios serve as a company’s DNA, unveiling hidden risks and operational strengths that shape investment decisions.
Alibaba Group Holding Limited
Alibaba shows moderate profitability with a 12.9% ROE and 13.1% net margin, signaling solid core earnings. Its P/E of 17.3 and P/B of 2.2 suggest a fairly valued stock, neither cheap nor stretched. The firm supports shareholders with a 1.3% dividend yield, balancing returns with steady reinvestment in growth and R&D.
Tractor Supply Company
Tractor Supply reports a robust 42.5% ROE, reflecting strong profitability, though its net margin is lower at 7.1%. The stock trades at a stretched P/E of 24.2 and an unfavorable P/B of 10.3, indicating premium valuation. It offers a 1.8% dividend yield but carries high leverage, which raises caution on financial stability.
Valuation Discipline vs. Profit Powerhouse
Alibaba strikes a more balanced risk-return profile with reasonable valuation and healthy dividends. Tractor Supply excels in profitability but at a higher valuation and financial risk. Investors seeking operational strength might prefer Tractor Supply, while those prioritizing valuation and steady income may lean toward Alibaba.
Which one offers the Superior Shareholder Reward?
I see Alibaba (BABA) offers a modest 1.3% dividend yield with a payout ratio near 23%, well-covered by free cash flow at 47%. It supplements returns via moderate buybacks, balancing growth reinvestment. Tractor Supply (TSCO) yields about 1.8%, with a higher payout ratio around 44%, supported by solid free cash flow coverage near 45%, and consistent buybacks. TSCO’s distribution leans more on shareholder returns, while BABA prioritizes reinvestment in growth. Considering sustainability and total return, I find TSCO’s higher, well-covered dividends plus buybacks deliver a superior 2026 shareholder reward.
Comparative Score Analysis: The Strategic Profile
The radar chart reveals the fundamental DNA and trade-offs of both firms, highlighting their core financial strengths and weaknesses:
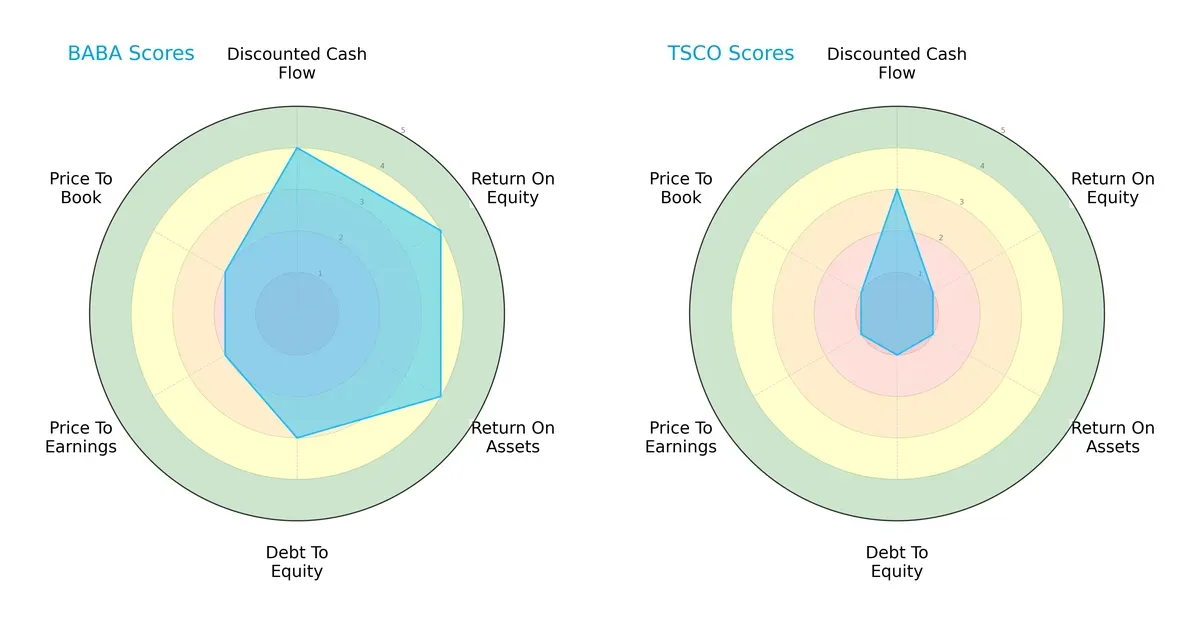
Alibaba dominates in profitability metrics with superior DCF, ROE, and ROA scores, signaling efficient capital use and robust earnings. Tractor Supply lags across all categories, reflecting operational and valuation challenges. Alibaba’s profile is more balanced, while Tractor Supply relies on a weaker financial foundation with no clear competitive edge.
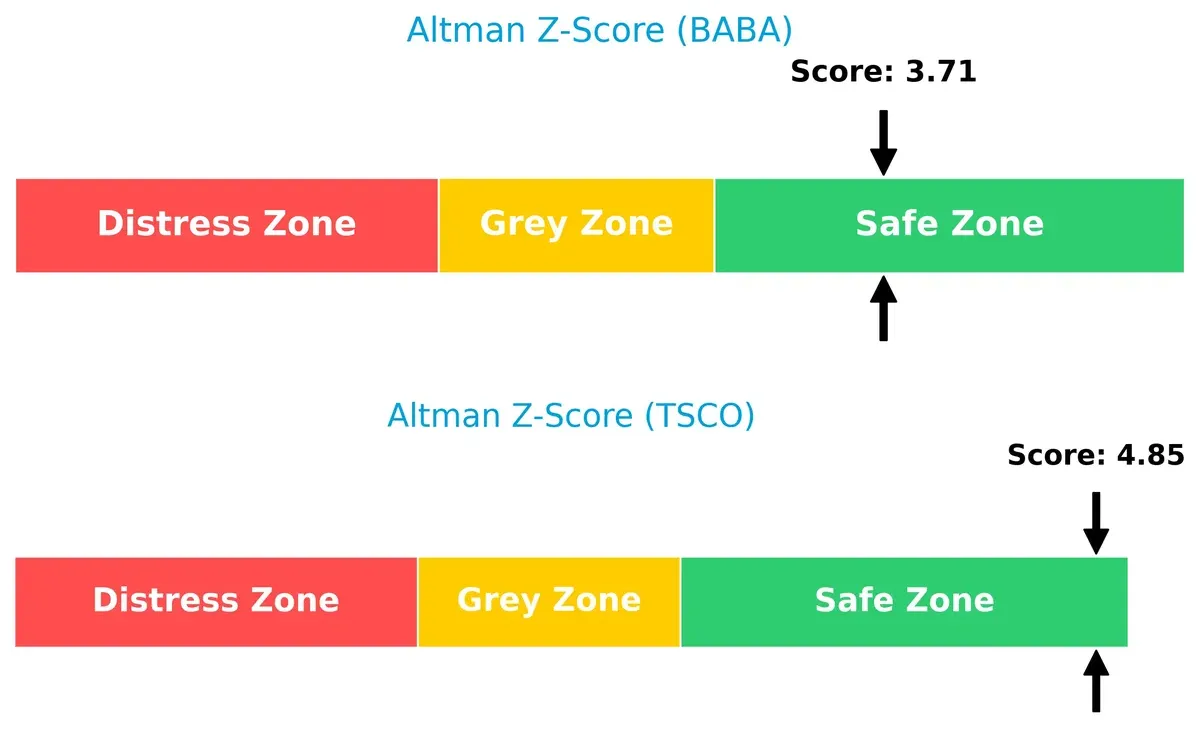
Bankruptcy Risk: Solvency Showdown
Alibaba and Tractor Supply both sit comfortably in the safe zone, with Tractor Supply’s higher Altman Z-Score indicating marginally stronger solvency and lower bankruptcy risk in this cycle:
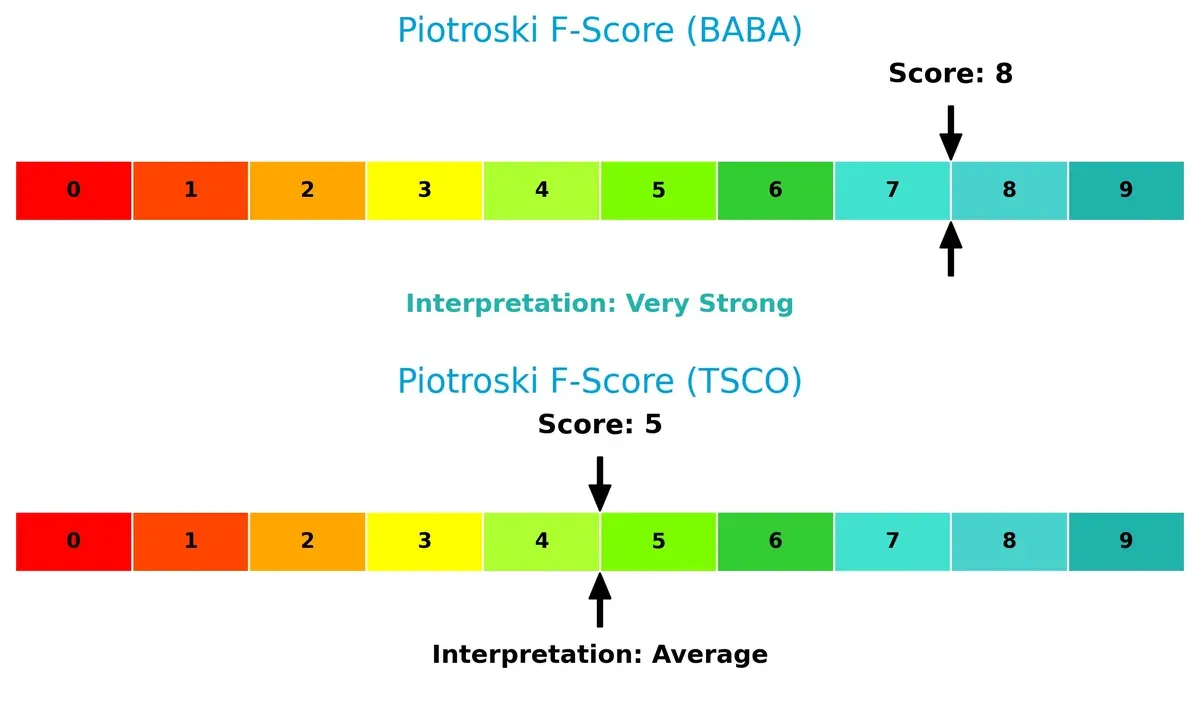
Financial Health: Quality of Operations
Alibaba’s Piotroski F-Score of 8 signals very strong financial health with solid profitability, leverage, and liquidity metrics. Tractor Supply’s score of 5 marks average health, raising red flags on internal operational consistency:
How are the two companies positioned?
This section dissects Alibaba and Tractor Supply’s operational DNA by comparing their revenue distribution and internal dynamics. The goal is to confront their economic moats and identify which model offers the most resilient competitive advantage today.
Revenue Segmentation: The Strategic Mix
This visual comparison dissects how Alibaba Group and Tractor Supply diversify income streams and reveals their primary sector bets:
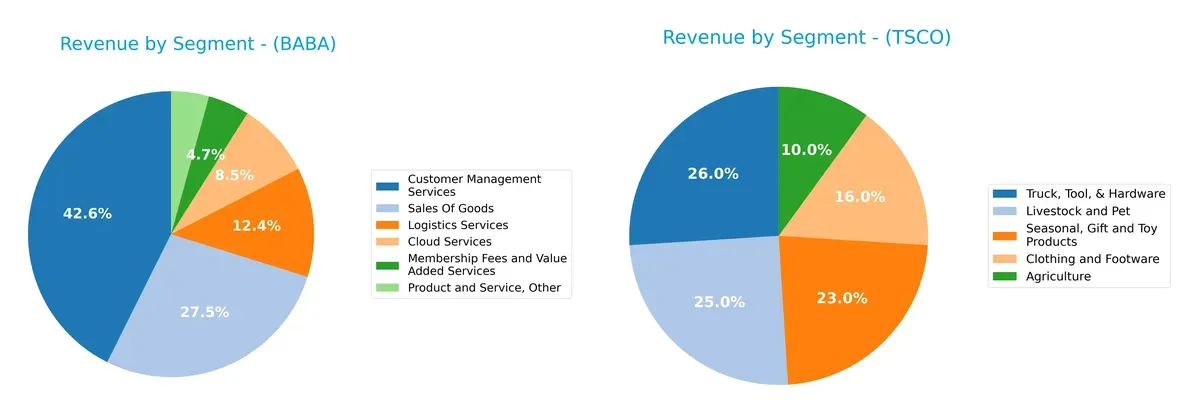
Alibaba’s revenue dwarfs Tractor Supply’s, anchored heavily in Customer Management Services (424B) and Sales Of Goods (274B). Alibaba’s mix spans Cloud (84B), Logistics (123B), and Membership Fees (47B), showing a broad ecosystem. Tractor Supply pivots around Truck, Tool, & Hardware (3.9B) and Livestock and Pet (3.7B), reflecting a focused retail portfolio. Alibaba’s diversification indicates strong ecosystem lock-in; Tractor Supply’s concentration signals higher segment-specific risk.
Strengths and Weaknesses Comparison
This table compares the strengths and weaknesses of Alibaba Group Holding Limited and Tractor Supply Company:
Alibaba Strengths
- Diverse revenue streams spanning cloud, logistics, and customer management services
- Favorable net margin of 13.06%
- Strong liquidity with current and quick ratios above 1.4
- Low debt-to-assets ratio at 13.75%
- High interest coverage at 15.39x
- Favorable weighted average cost of capital at 5.3%
Tractor Supply Strengths
- High return on equity at 42.46% and ROIC at 13.11%
- Favorable interest coverage at 21.22x
- Asset turnover of 1.42 reflects efficient use of assets
- Diversified product segments including agriculture, clothing, and hardware
- Favorable WACC at 6.13%
Alibaba Weaknesses
- Neutral ROE and ROIC indicate moderate capital efficiency
- PE and PB ratios neutral, may imply average market valuation
- Asset turnover at 0.55 is modest compared to retail peers
- No explicit geographic diversification data provided
Tractor Supply Weaknesses
- High debt-to-equity ratio (3.73) and debt-to-assets at 88.12% indicate leverage risk
- Quick ratio at 0.16 signals weak short-term liquidity
- Unfavorable PB ratio at 10.27 suggests overvaluation concerns
- Net margin at 7.06% is lower relative to Alibaba
Alibaba shows robust liquidity and manageable leverage, supporting resilience amid economic cycles. Tractor Supply delivers strong profitability but carries elevated financial risk from high leverage and liquidity constraints. These contrasts reflect distinct strategic priorities and operational models.
The Moat Duel: Analyzing Competitive Defensibility
A structural moat is the only thing protecting long-term profits from the erosion of competition. Let’s dissect the competitive advantages of:
Alibaba Group Holding Limited: Network Effects Powerhouse
Alibaba’s moat rests on powerful network effects across its sprawling e-commerce and cloud platforms. This manifests in a high ROIC exceeding WACC by 2.6%, signaling value creation. In 2026, expansion into AI and international markets could deepen its moat.
Tractor Supply Company: Cost Advantage in Rural Retail
Tractor Supply’s moat derives from cost advantages and strong brand loyalty in niche rural retail. It sustains ROIC well above WACC but faces a declining ROIC trend. Opportunities lie in expanding digital sales and product lines to reverse this 2026 challenge.
Ecosystem Scale vs. Cost Leadership: The Moat Face-Off
Alibaba’s growing ROIC and vast ecosystem deliver a wider moat than Tractor Supply’s cost-focused but eroding profitability. Alibaba stands better equipped to defend and expand market share amid intensifying competition.
Which stock offers better returns?
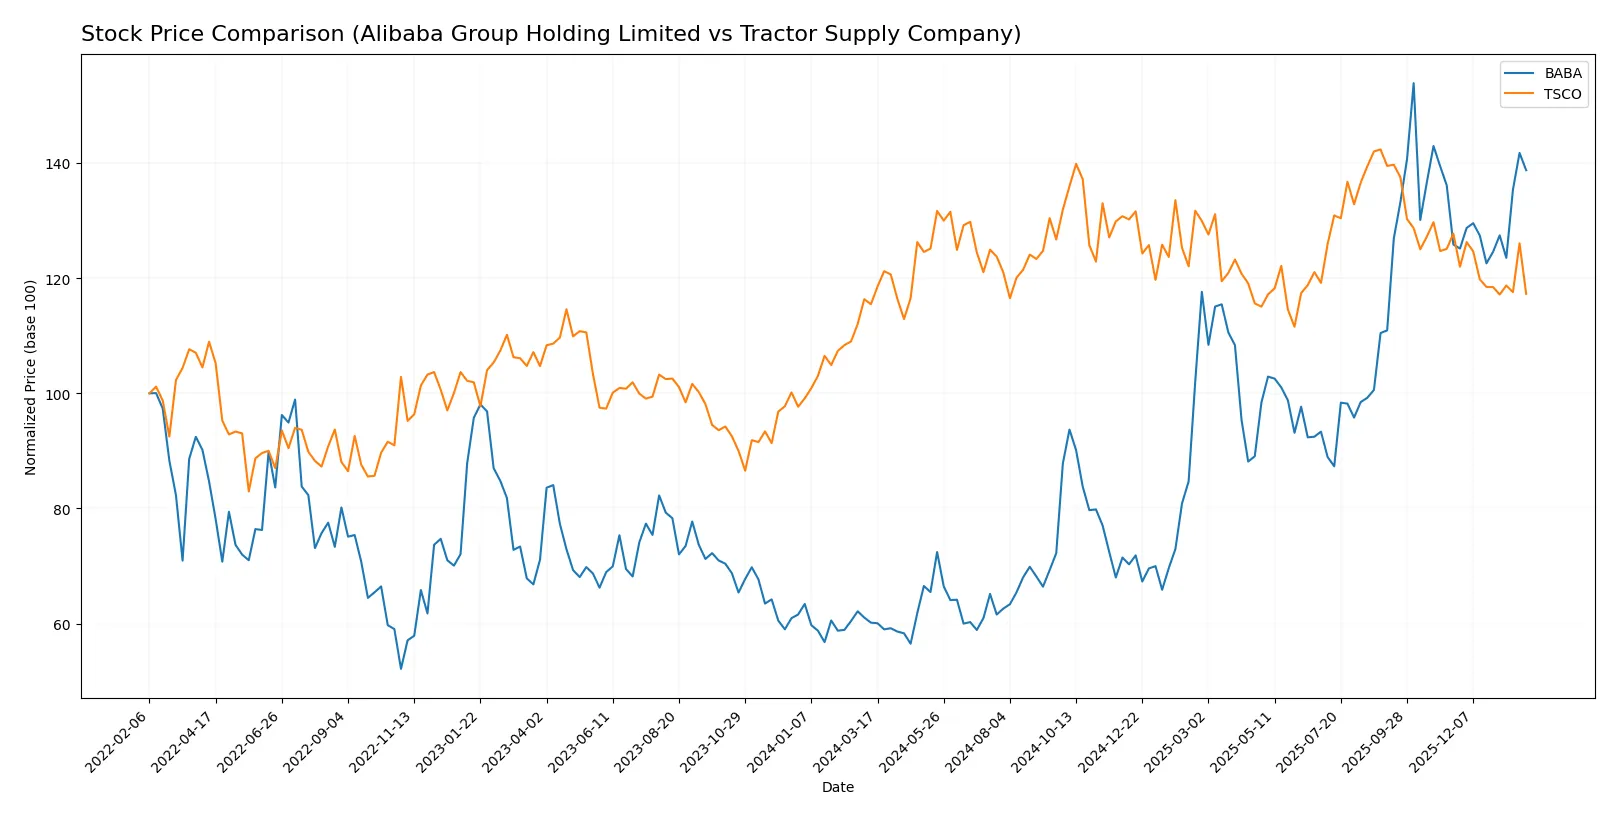
The past year shows contrasting price dynamics: Alibaba surges with strong acceleration, while Tractor Supply stays nearly flat, ending with a modest deceleration in recent months.
Trend Comparison
Alibaba’s stock rose 130.54% over the last 12 months, marking a clear bullish trend with accelerating momentum and wide price swings between 69.07 and 188.03.
Tractor Supply’s price barely changed, gaining 1.56% over 12 months, signaling a neutral trend with decelerating momentum and a tighter range of 48.4 to 61.76.
Alibaba outperformed Tractor Supply strongly in market returns, driven by sustained acceleration, while Tractor Supply’s trend remained essentially flat with recent weakness.
Target Prices
The consensus target prices indicate moderate upside potential for Alibaba Group Holding Limited and Tractor Supply Company.
| Company | Target Low | Target High | Consensus |
|---|---|---|---|
| Alibaba Group Holding Limited | 140 | 225 | 188.62 |
| Tractor Supply Company | 50 | 67 | 59 |
Analysts expect Alibaba’s stock to rise from its current 170 level toward a consensus near 189, suggesting moderate growth. Tractor Supply trades near 51 with a consensus at 59, indicating modest upside.

Don’t Let Luck Decide Your Entry Point
Optimize your entry points with our advanced ProRealTime indicators. You’ll get efficient buy signals with precise price targets for maximum performance. Start outperforming now!
How do institutions grade them?
Below is a summary of institutional grades for Alibaba Group Holding Limited and Tractor Supply Company:
Alibaba Group Holding Limited Grades
The table below shows recent grades assigned by reputable financial institutions to Alibaba:
| Grading Company | Action | New Grade | Date |
|---|---|---|---|
| Jefferies | Maintain | Buy | 2026-01-08 |
| Freedom Capital Markets | Downgrade | Hold | 2026-01-06 |
| Bernstein | Maintain | Outperform | 2025-11-26 |
| Benchmark | Maintain | Buy | 2025-11-26 |
| JP Morgan | Maintain | Overweight | 2025-11-26 |
| Barclays | Maintain | Overweight | 2025-11-26 |
| Citigroup | Maintain | Buy | 2025-11-26 |
| Bernstein | Maintain | Outperform | 2025-10-10 |
| JP Morgan | Maintain | Overweight | 2025-10-09 |
| JP Morgan | Maintain | Overweight | 2025-10-01 |
Tractor Supply Company Grades
The following table lists recent grades from established firms on Tractor Supply Company:
| Grading Company | Action | New Grade | Date |
|---|---|---|---|
| TD Cowen | Maintain | Hold | 2026-01-30 |
| Mizuho | Maintain | Outperform | 2026-01-30 |
| Piper Sandler | Maintain | Overweight | 2026-01-30 |
| Morgan Stanley | Maintain | Equal Weight | 2026-01-30 |
| Goldman Sachs | Maintain | Buy | 2026-01-30 |
| Telsey Advisory Group | Maintain | Outperform | 2026-01-30 |
| DA Davidson | Maintain | Buy | 2026-01-30 |
| Jefferies | Maintain | Buy | 2026-01-30 |
| JP Morgan | Maintain | Neutral | 2026-01-30 |
| Telsey Advisory Group | Maintain | Outperform | 2026-01-29 |
Which company has the best grades?
Alibaba consistently receives strong buy and outperform ratings from multiple top-tier firms, reflecting broad institutional confidence. Tractor Supply’s grades are also positive but slightly more mixed, with some hold and neutral positions, indicating more cautious sentiment. Investors may interpret Alibaba’s higher consensus grades as a sign of stronger market endorsement.
Risks specific to each company
The following categories identify the critical pressure points and systemic threats facing both firms in the 2026 market environment:
1. Market & Competition
Alibaba Group Holding Limited
- Faces intense competition in global e-commerce and cloud; must innovate to maintain market share amid international rivals.
Tractor Supply Company
- Competes in U.S. rural retail, with pressure from e-commerce and big-box retailers; niche focus helps but limits growth.
2. Capital Structure & Debt
Alibaba Group Holding Limited
- Maintains a conservative capital structure with low debt-to-equity (0.25) and strong interest coverage (15.39).
Tractor Supply Company
- High leverage with debt-to-equity of 3.73 and debt-to-assets at 88.12% poses substantial financial risk.
3. Stock Volatility
Alibaba Group Holding Limited
- Exhibits low beta (0.36), indicating lower volatility and defensive characteristics in turbulent markets.
Tractor Supply Company
- Beta of 0.74 suggests moderate stock volatility, increasing risk during market downturns.
4. Regulatory & Legal
Alibaba Group Holding Limited
- Exposed to tightening regulations in China and international scrutiny on data privacy and trade practices.
Tractor Supply Company
- Primarily subject to U.S. retail regulations with lower systemic regulatory risks but some exposure to labor laws.
5. Supply Chain & Operations
Alibaba Group Holding Limited
- Complex global supply chain vulnerable to geopolitical tensions and logistic disruptions.
Tractor Supply Company
- More localized supply chain but exposed to inflationary pressures and distribution challenges in rural areas.
6. ESG & Climate Transition
Alibaba Group Holding Limited
- Faces pressure to improve ESG metrics amid global investor scrutiny and climate transition demands.
Tractor Supply Company
- Increasing focus on sustainable products and energy efficiency, but slower pace on ESG integration.
7. Geopolitical Exposure
Alibaba Group Holding Limited
- High geopolitical risk due to China-U.S. tensions affecting trade, technology access, and regulatory environment.
Tractor Supply Company
- Minimal direct geopolitical exposure, mostly insulated by domestic U.S. operations.
Which company shows a better risk-adjusted profile?
Alibaba’s biggest risk is geopolitical exposure and regulatory uncertainty in China, which could impact growth and valuations. Tractor Supply’s primary risk is its heavy debt burden, threatening financial stability despite strong operational performance. Alibaba’s lower leverage, favorable financial ratios, and safer Altman Z-score (3.7 vs. 4.85 for TSCO but with much lighter debt load) signal a better risk-adjusted profile. The stark contrast in debt-to-assets—13.75% for Alibaba vs. 88.12% for Tractor Supply—justifies my concern about TSCO’s balance sheet risk.
Final Verdict: Which stock to choose?
Alibaba’s superpower lies in its durable competitive advantage, demonstrated by a growing ROIC well above its cost of capital. It operates as a cash-generating machine with robust profitability and a favorable liquidity profile. A point of vigilance remains its exposure to regulatory and geopolitical risks that could disrupt growth. It fits well in aggressive growth portfolios seeking long-term value creation in dynamic markets.
Tractor Supply Company’s moat is its commanding return on equity and solid operational efficiency in a niche retail segment with recurring customer demand. It offers better stability than Alibaba, but its heavy leverage and declining ROIC trend signal caution. This stock suits investors focused on growth at a reasonable price (GARP) who value steady cash flow over rapid expansion.
If you prioritize durable value creation and growth potential, Alibaba outshines with its strong profitability and balance sheet quality. However, if you seek stability combined with high ROE in a defensive retail niche, Tractor Supply offers better stability despite elevated financial risks. Both present distinct analytical scenarios depending on your risk tolerance and portfolio strategy.
Disclaimer: Investment carries a risk of loss of initial capital. The past performance is not a reliable indicator of future results. Be sure to understand risks before making an investment decision.
Go Further
I encourage you to read the complete analyses of Alibaba Group Holding Limited and Tractor Supply Company to enhance your investment decisions: