Alibaba Group Holding Limited and PDD Holdings Inc. are two major players in the specialty retail sector, both revolutionizing e-commerce with innovative platforms and digital marketplaces. Alibaba, a well-established giant, and PDD, a rapidly growing newcomer, compete intensely in overlapping markets, especially in China and expanding international segments. In this article, I will help you analyze which company presents the most compelling investment opportunity in 2026.
Table of contents
Companies Overview
I will begin the comparison between Alibaba Group Holding Limited and PDD Holdings Inc. by providing an overview of these two companies and their main differences.
Alibaba Overview
Alibaba Group Holding Limited operates as a technology infrastructure and marketing services provider, helping merchants, brands, and retailers engage customers in China and internationally. Founded in 1999 and based in Hangzhou, China, Alibaba manages diverse segments including e-commerce platforms like Taobao and Tmall, logistics through Cainiao, cloud computing, and digital media. The company holds a market cap of 350B USD and employs over 124K people.
PDD Overview
PDD Holdings Inc., incorporated in 2015 and headquartered in Dublin, Ireland, operates a multinational commerce group focused on digital economy inclusion. Its primary assets include the Pinduoduo e-commerce platform and Temu marketplace, offering products across numerous categories from agricultural goods to electronics. With a market cap of approximately 169B USD and about 23K employees, PDD emphasizes connecting businesses and consumers via its online platforms.
Key similarities and differences
Both Alibaba and PDD operate in the specialty retail sector with a focus on e-commerce platforms connecting merchants and consumers. Alibaba has a broader business model encompassing cloud services, logistics, and digital media, while PDD concentrates primarily on its e-commerce marketplaces. Alibaba’s scale and employee base are significantly larger, reflecting its diversified operations and longer market presence compared to PDD’s more recent and focused digital commerce approach.
Income Statement Comparison
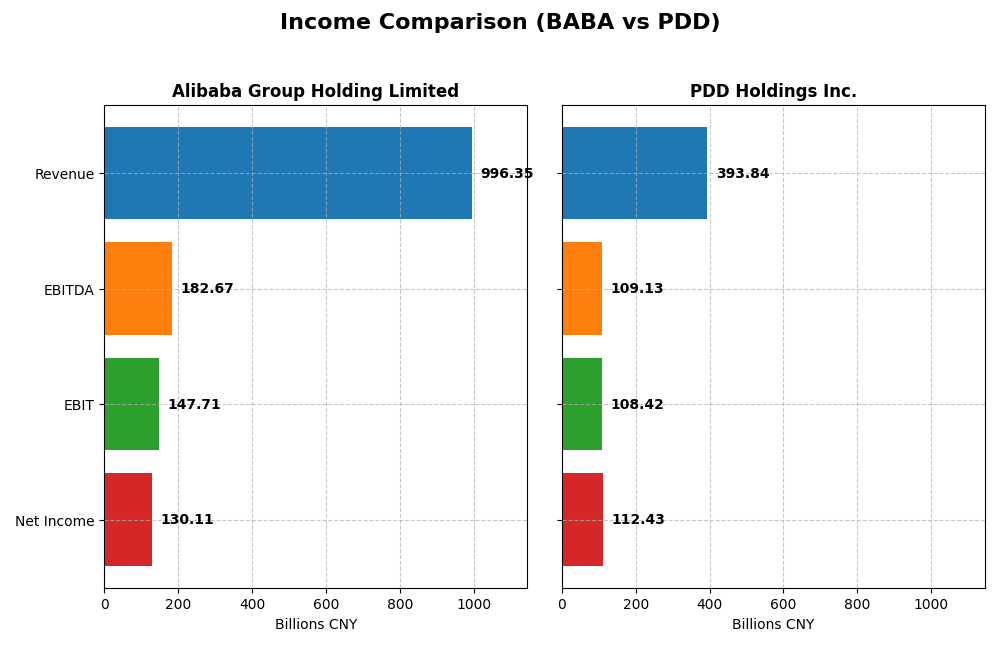
Below is the latest fiscal year income statement comparison between Alibaba Group Holding Limited and PDD Holdings Inc., showing key financial metrics.
| Metric | Alibaba Group Holding Limited | PDD Holdings Inc. |
|---|---|---|
| Market Cap | 350B | 169B |
| Revenue | 996B | 394B |
| EBITDA | 183B | 109B |
| EBIT | 148B | 108B |
| Net Income | 130B | 112B |
| EPS | 55.12 | 81.24 |
| Fiscal Year | 2025 | 2024 |
Income Statement Interpretations
Alibaba Group Holding Limited
Alibaba’s revenue increased steadily from 717B CNY in 2021 to 996B CNY in 2025, reflecting a 38.9% growth over five years. Net income, however, declined by 13.59% overall, with margins weakening. In 2025, gross profit and EBIT margins improved, supporting a 5.86% revenue growth and a strong net margin increase of 53.61%, indicating operational improvements despite rising expenses.
PDD Holdings Inc.
PDD demonstrated exceptional growth, with revenue surging from 59B CNY in 2020 to 394B CNY in 2024, a 562% increase. Net income expanded dramatically by 1666%, accompanied by robust margin improvements. The most recent year showed a 59% revenue growth and a net margin increase of 17.78%, with consistently favorable margins, highlighting rapid scaling and efficient cost management.
Which one has the stronger fundamentals?
PDD exhibits stronger fundamentals, with consistently favorable growth rates and margins, including a remarkable five-year revenue and net income surge. Alibaba shows stable revenue growth but declining net income and margin contraction over the same period. While Alibaba improved margins in 2025, PDD’s uniform favorable performance across all metrics suggests more robust income statement fundamentals.
Financial Ratios Comparison
The table below presents a side-by-side comparison of key financial ratios for Alibaba Group Holding Limited and PDD Holdings Inc. for their most recent fiscal years.
| Ratios | Alibaba Group Holding Limited (2025) | PDD Holdings Inc. (2024) |
|---|---|---|
| ROE | 12.9% | 35.9% |
| ROIC | 7.9% | 28.4% |
| P/E | 17.3 | 8.7 |
| P/B | 2.23 | 3.13 |
| Current Ratio | 1.54 | 2.21 |
| Quick Ratio | 1.49 | 2.20 |
| D/E (Debt-to-Equity) | 0.25 | 0.03 |
| Debt-to-Assets | 13.8% | 2.1% |
| Interest Coverage | 14.7 | 0 (not available) |
| Asset Turnover | 0.55 | 0.78 |
| Fixed Asset Turnover | 3.99 | 66.3 |
| Payout Ratio | 22.3% | 0% |
| Dividend Yield | 1.29% | 0% |
Interpretation of the Ratios
Alibaba Group Holding Limited
Alibaba’s financial ratios reveal a generally favorable profile, with strong liquidity, low debt levels, and a solid interest coverage ratio indicating financial stability. Net margin is favorable, but return on equity and invested capital remain neutral, suggesting moderate efficiency. The company pays dividends with a 1.29% yield, reflecting a stable payout without aggressive repurchases, reducing sustainability risks.
PDD Holdings Inc.
PDD exhibits very favorable ratios with high profitability, exceptional returns on equity and invested capital, and excellent liquidity. Its low debt and infinite interest coverage highlight financial strength. However, a high price-to-book ratio is less attractive and the zero dividend yield indicates no shareholder distributions, consistent with a growth-focused reinvestment strategy typical in expanding companies.
Which one has the best ratios?
PDD Holdings shows the strongest overall financial ratios, outperforming Alibaba in profitability, returns, and liquidity, despite a less attractive price-to-book ratio and no dividends. Alibaba maintains solid fundamentals and dividend payments but has more neutral returns. Thus, PDD’s metrics suggest superior financial health and growth potential relative to Alibaba.
Strategic Positioning
This section compares the strategic positioning of Alibaba and PDD, focusing on Market position, Key segments, and Exposure to technological disruption:
Alibaba
- Leading e-commerce and tech infrastructure provider facing intense competitive pressure in China and globally.
- Diverse segments: retail platforms, cloud, logistics, digital media, local services, and AI initiatives.
- Invests heavily in AI, cloud computing, logistics, and digital services to counter disruption and innovate.
PDD
- Growing multinational commerce group with competitive presence in e-commerce and digital economy sectors.
- Concentrated on e-commerce platforms including Pinduoduo and Temu, focusing on diverse product categories.
- Primarily e-commerce focused with digital marketplace models, limited explicit exposure to broader tech disruption.
Alibaba vs PDD Positioning
Alibaba’s diversified business spans multiple segments including cloud and logistics, providing multiple revenue streams but facing broad competitive pressures. PDD’s concentrated e-commerce focus offers growth potential but may limit resilience against sector-specific risks.
Which has the best competitive advantage?
Both companies demonstrate a very favorable moat with growing ROIC trends, indicating durable competitive advantages; however, PDD shows a higher ROIC relative to WACC and sharper growth, suggesting a stronger recent value creation.
Stock Comparison
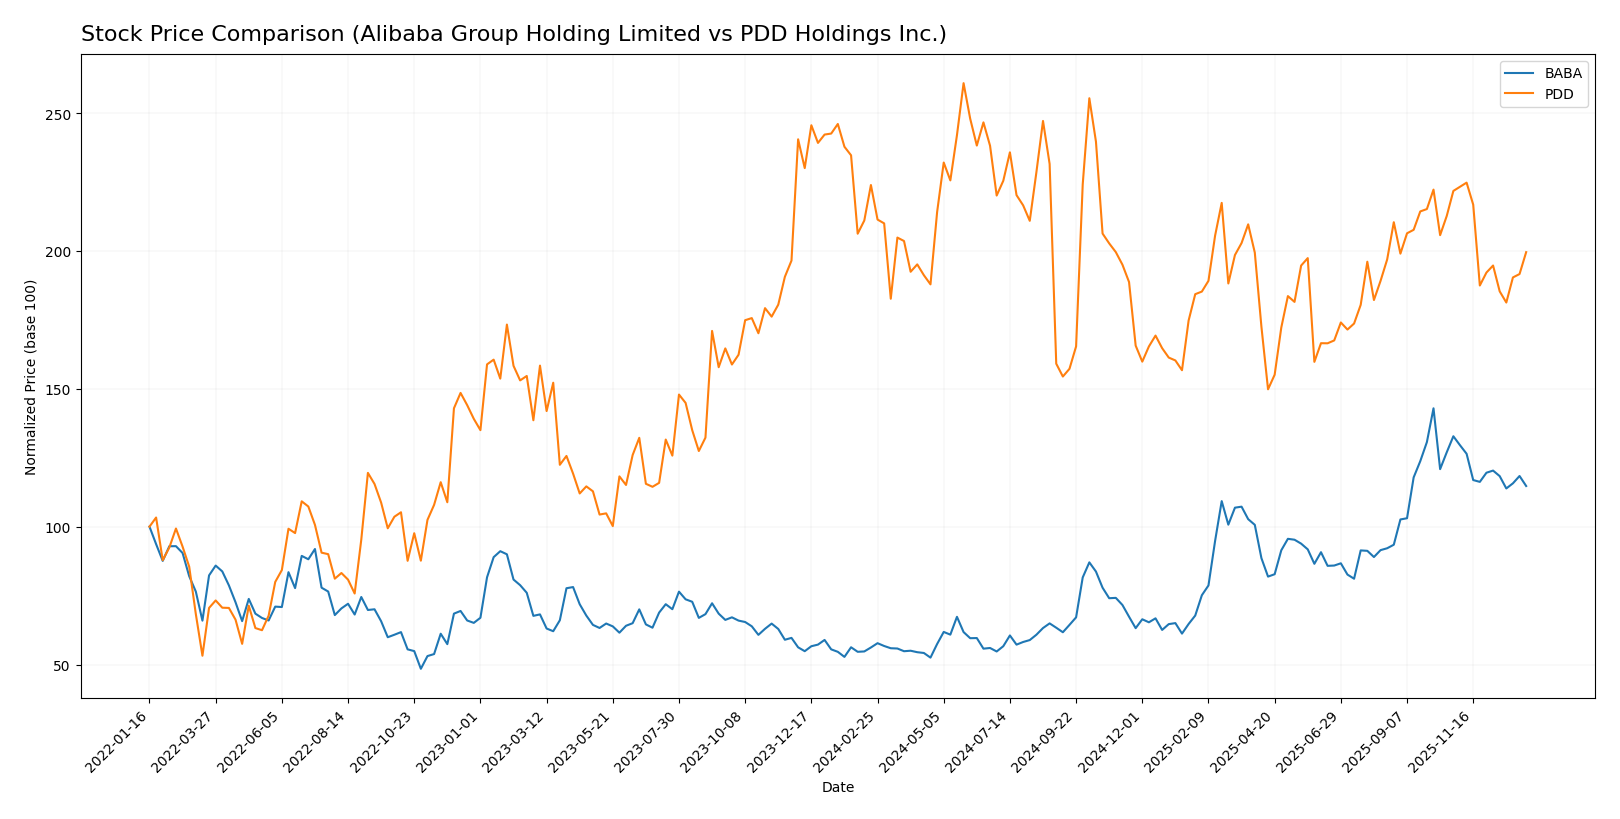
The past year saw contrasting stock movements between Alibaba Group Holding Limited and PDD Holdings Inc., with Alibaba exhibiting strong gains despite recent deceleration, while PDD experienced a consistent decline in price and volume dynamics.
Trend Analysis
Alibaba’s stock showed a bullish trend over the past 12 months with a 104.25% price increase, though the trend decelerated. The price ranged from a low of 69.07 to a high of 188.03, with notable volatility (std deviation 31.46).
PDD Holdings displayed a bearish trend over the same period, with a 10.88% price decline and decelerating momentum. Its price fluctuated between 90.5 and 157.57, with a moderate volatility of 15.64.
Comparing both, Alibaba outperformed PDD significantly in market performance, delivering strong positive returns versus PDD’s declining stock price.
Target Prices
The consensus target prices for Alibaba Group Holding Limited and PDD Holdings Inc. reflect moderate upside potential according to analysts.
| Company | Target High | Target Low | Consensus |
|---|---|---|---|
| Alibaba Group Holding Limited | 225 | 140 | 186.98 |
| PDD Holdings Inc. | 170 | 120 | 147.29 |
Analysts expect Alibaba’s stock to appreciate from its current price of 150.96 USD toward the consensus target near 187 USD, signaling a positive outlook. PDD’s target consensus of 147.29 USD also suggests upside from its current price of 120.55 USD, indicating growth potential.
Analyst Opinions Comparison
This section compares analysts’ ratings and grades for Alibaba Group Holding Limited and PDD Holdings Inc.:
Rating Comparison
Alibaba Group Holding Limited Rating
- Rating: B+ with a very favorable status
- Discounted Cash Flow Score: 3, moderate
- ROE Score: 4, favorable
- ROA Score: 4, favorable
- Debt To Equity Score: 3, moderate
- Overall Score: 3, moderate
PDD Holdings Inc. Rating
- Rating: A+ with a very favorable status
- Discounted Cash Flow Score: 4, favorable
- ROE Score: 5, very favorable
- ROA Score: 5, very favorable
- Debt To Equity Score: 5, very favorable
- Overall Score: 4, favorable
Which one is the best rated?
Based strictly on the provided data, PDD is better rated than Alibaba, with higher overall and individual financial scores, reflecting stronger cash flow, profitability, and balance sheet metrics.
Scores Comparison
Below is a comparison of the Altman Z-Score and Piotroski Score for Alibaba and PDD:
Alibaba Scores
- Altman Z-Score: 1.72, in distress zone indicating high bankruptcy risk.
- Piotroski Score: 8, very strong financial health suggesting good investment value.
PDD Scores
- Altman Z-Score: 2.84, in grey zone indicating moderate bankruptcy risk.
- Piotroski Score: 6, average financial health indicating moderate strength.
Which company has the best scores?
Alibaba shows a higher Piotroski Score at 8 versus PDD’s 6, indicating stronger financial health. However, Alibaba’s Altman Z-Score is lower at 1.72 (distress zone) compared to PDD’s 2.84 (grey zone), suggesting higher bankruptcy risk for Alibaba.
Grades Comparison
Here is a detailed comparison of the latest grades assigned to Alibaba Group Holding Limited and PDD Holdings Inc.:
Alibaba Group Holding Limited Grades
This table summarizes recent grades from reputable financial institutions for Alibaba:
| Grading Company | Action | New Grade | Date |
|---|---|---|---|
| Jefferies | Maintain | Buy | 2026-01-08 |
| Freedom Capital Markets | Downgrade | Hold | 2026-01-06 |
| Benchmark | Maintain | Buy | 2025-11-26 |
| Bernstein | Maintain | Outperform | 2025-11-26 |
| Citigroup | Maintain | Buy | 2025-11-26 |
| JP Morgan | Maintain | Overweight | 2025-11-26 |
| Barclays | Maintain | Overweight | 2025-11-26 |
| Bernstein | Maintain | Outperform | 2025-10-10 |
| JP Morgan | Maintain | Overweight | 2025-10-09 |
| JP Morgan | Maintain | Overweight | 2025-10-01 |
Alibaba’s grades consistently reflect a positive outlook, with multiple firms maintaining Buy, Outperform, or Overweight ratings, indicating general confidence in the stock.
PDD Holdings Inc. Grades
This table presents recent grades from verified grading companies for PDD Holdings:
| Grading Company | Action | New Grade | Date |
|---|---|---|---|
| Freedom Capital Markets | Maintain | Buy | 2026-01-06 |
| B of A Securities | Maintain | Neutral | 2025-11-19 |
| B of A Securities | Maintain | Neutral | 2025-08-26 |
| Barclays | Maintain | Overweight | 2025-08-26 |
| Benchmark | Maintain | Buy | 2025-08-26 |
| New Street Research | Downgrade | Neutral | 2025-08-26 |
| China Renaissance | Downgrade | Hold | 2025-05-28 |
| Benchmark | Maintain | Buy | 2025-05-28 |
| JP Morgan | Maintain | Neutral | 2025-05-28 |
| Jefferies | Maintain | Buy | 2025-05-27 |
PDD shows a more mixed rating profile, with a balance of Buy, Neutral, and Hold grades, suggesting a more cautious or varied consensus among analysts.
Which company has the best grades?
Alibaba Group Holding Limited generally holds stronger and more consistent Buy and Outperform ratings compared to PDD Holdings Inc., which has a notable number of Neutral and Hold grades. This difference may signal greater analyst confidence in Alibaba’s prospects, potentially influencing investor sentiment towards stability and growth expectations.
Strengths and Weaknesses
Below is a comparison of key strengths and weaknesses for Alibaba Group Holding Limited (BABA) and PDD Holdings Inc. (PDD) based on their latest financial and operational data.
| Criterion | Alibaba Group Holding Limited (BABA) | PDD Holdings Inc. (PDD) |
|---|---|---|
| Diversification | Highly diversified with strong segments in cloud (84.5B CNY), logistics (123.4B CNY), and customer management services (425B CNY) | Focused mainly on online marketing services (198B CNY) and transaction services (196B CNY) |
| Profitability | Moderate net margin (13.1%), neutral ROIC (7.9%), favorable WACC (4.5%) | High net margin (28.6%), very strong ROIC (28.4%), favorable WACC (4.7%) |
| Innovation | Consistent investment in cloud and tech services; moderate asset turnover (0.55) | Rapid growth and innovation evident in extremely high fixed asset turnover (66.3) |
| Global presence | Large global footprint with extensive logistics and cloud infrastructure | Primarily focused on China and selected Asian markets, growing global footprint |
| Market Share | Leading in e-commerce and cloud services in China with stable revenue streams | Rapidly increasing market share in e-commerce with strong revenue growth |
Key takeaways: Alibaba offers robust diversification and a stable, profitable business with a durable moat and growing ROIC. PDD excels in profitability and operational efficiency, showing a very favorable moat with rapid expansion, though with less diversification than Alibaba. Investors should weigh Alibaba’s stability against PDD’s impressive growth potential and higher risk exposure.
Risk Analysis
Below is a comparative risk table for Alibaba Group Holding Limited (BABA) and PDD Holdings Inc. (PDD) based on the latest available data for 2025 and 2024 respectively.
| Metric | Alibaba Group Holding Limited (BABA) | PDD Holdings Inc. (PDD) |
|---|---|---|
| Market Risk | Moderate (Beta 0.36, NYSE listed) | Low (Beta 0.01, NASDAQ listed) |
| Debt Level | Low (Debt-to-Equity 0.25, favorable) | Very Low (Debt-to-Equity 0.03) |
| Regulatory Risk | High (Chinese market scrutiny) | High (Chinese e-commerce regulation) |
| Operational Risk | Moderate (Large scale, diverse ops) | Moderate (Growing but smaller scale) |
| Environmental Risk | Moderate (Retail and cloud services) | Low to Moderate (Mainly e-commerce) |
| Geopolitical Risk | High (China-US tensions impact) | High (China and international exposure) |
Alibaba faces significant regulatory and geopolitical risks due to ongoing scrutiny from Chinese authorities and global trade tensions. PDD’s regulatory risk is similarly elevated given its Chinese base and international expansion, but its very low debt level and extremely low market beta reduce financial vulnerability. Alibaba’s Altman Z-Score indicates financial distress risk, while PDD is in the grey zone, suggesting more resilience. Investors should weigh regulatory and geopolitical risks heavily when considering these stocks.
Which Stock to Choose?
Alibaba Group Holding Limited (BABA) shows a generally favorable income evolution, with gross and EBIT margins around 40% and 15%, and a recent 1-year net margin growth of 53.61%. Its financial ratios are mostly favorable with a 13.06% net margin and a solid balance sheet reflected in low debt and strong interest coverage. The company’s profitability is moderate, with a return on equity of 12.86%, and it holds a very favorable overall rating of B+.
PDD Holdings Inc. (PDD) exhibits robust income growth, with a 59.04% revenue increase last year and a net margin of 28.55%. Its financial ratios are very favorable, highlighted by a high return on equity of 35.89%, very low debt levels, and strong liquidity ratios. PDD’s profitability and capital efficiency are excellent, supported by a very favorable rating of A+ and consistent growth in ROIC far above its WACC.
Considering the ratings and comprehensive financial evaluations, PDD might appear more attractive for investors seeking high growth and profitability due to its very favorable ratios and strong income statement. Conversely, BABA could be preferred by investors prioritizing stability and a balanced risk profile given its solid but more moderate financial metrics and favorable rating.
Disclaimer: Investment carries a risk of loss of initial capital. The past performance is not a reliable indicator of future results. Be sure to understand risks before making an investment decision.
Go Further
I encourage you to read the complete analyses of Alibaba Group Holding Limited and PDD Holdings Inc. to enhance your investment decisions: