Investors seeking opportunities in the dynamic specialty retail sector often consider Alibaba Group Holding Limited and eBay Inc., two giants with overlapping marketplaces and distinct innovation approaches. Alibaba boasts a vast ecosystem spanning e-commerce, cloud computing, and AI, primarily in Asia, while eBay focuses on streamlined global peer-to-peer commerce. This comparison will reveal which company offers the most compelling investment potential in today’s evolving digital landscape. Let’s explore which stock deserves a spot in your portfolio.

Table of contents
Companies Overview
I will begin the comparison between Alibaba Group Holding Limited and eBay Inc. by providing an overview of these two companies and their main differences.
Alibaba Group Holding Limited Overview
Alibaba Group Holding Limited, based in Hangzhou, China, provides technology infrastructure and marketing reach primarily to merchants, brands, and retailers both domestically and internationally. Its diverse operations span digital retail platforms like Taobao and Tmall, online wholesale marketplaces, logistics services, cloud computing, digital media, and AI initiatives. Founded in 1999, Alibaba’s mission focuses on empowering businesses through its extensive e-commerce ecosystem and technology services.
eBay Inc. Overview
eBay Inc., headquartered in San Jose, California, operates marketplace platforms connecting buyers and sellers globally. Established in 1995, eBay’s core business is its online marketplace and suite of mobile apps that facilitate listing, buying, selling, and payment for various items. The company serves a broad range of commerce participants, including retailers, distributors, and auctioneers, emphasizing a decentralized platform model within the specialty retail sector.
Key similarities and differences
Both Alibaba and eBay operate in the specialty retail sector focusing on e-commerce platforms that connect buyers and sellers worldwide. Alibaba’s model is broader, integrating multiple segments such as logistics, cloud services, and digital media, while eBay focuses mainly on its marketplace platform and facilitating transactions. Alibaba has a significantly larger workforce and market cap, reflecting its diverse business lines and scale compared to eBay’s more focused marketplace approach.
Income Statement Comparison
Below is a side-by-side comparison of the most recent full fiscal year income statements for Alibaba Group Holding Limited and eBay Inc., illustrating key financial metrics.

| Metric | Alibaba Group Holding Limited | eBay Inc. |
|---|---|---|
| Market Cap | 350B | 41B |
| Revenue | 996B CNY | 10.3B USD |
| EBITDA | 183B CNY | 2.86B USD |
| EBIT | 148B CNY | 2.54B USD |
| Net Income | 130B CNY | 1.98B USD |
| EPS | 55.12 CNY | 3.98 USD |
| Fiscal Year | 2025 | 2024 |
Income Statement Interpretations
Alibaba Group Holding Limited
Alibaba’s revenue displayed steady growth from 717B CNY in 2021 to nearly 1T CNY in 2025, reflecting a 38.9% increase over five years. Net income fluctuated, peaking in 2021 before declining overall. Margins showed mixed trends, with gross and EBIT margins favorable at nearly 40% and 14.8%, respectively, while operating expenses grew slightly faster than revenue in 2025. The latest year showed a 5.9% revenue rise with strong improvements in profitability metrics, including a 53.6% net margin growth and a 70.9% EPS increase.
eBay Inc.
eBay’s revenue grew moderately from 8.9B USD in 2020 to 10.3B USD in 2024, a 15.6% increase. However, net income declined sharply, with a significant loss recorded in 2022 followed by partial recovery but still down 65% overall. Margins were generally strong, with a gross margin near 72% and an EBIT margin of 24.7%, but recent year results weakened, showing a 1.7% revenue increase but notable declines in EBIT (-36.1%) and net margin (-29.8%). EPS also fell by 24.1% in the latest year.
Which one has the stronger fundamentals?
Alibaba presents stronger fundamentals with more robust revenue growth, improved profitability, and favorable margin trends, despite some margin volatility over the period. eBay, while maintaining higher margins, faced significant net income declines and less stable earnings growth. Alibaba’s overall positive income statement evaluation contrasts with eBay’s unfavorable income growth and margin contraction, indicating a stronger financial foundation for Alibaba based on the provided data.
Financial Ratios Comparison
The table below presents the most recent key financial ratios for Alibaba Group Holding Limited and eBay Inc. to facilitate a clear side-by-side comparison.
| Ratios | Alibaba Group Holding Limited (2025 FY) | eBay Inc. (2024 FY) |
|---|---|---|
| ROE | 12.9% | 38.3% |
| ROIC | 7.9% | 13.4% |
| P/E | 17.3 | 15.6 |
| P/B | 2.23 | 5.96 |
| Current Ratio | 1.54 | 1.24 |
| Quick Ratio | 1.49 | 1.24 |
| D/E (Debt-to-Equity) | 0.25 | 1.52 |
| Debt-to-Assets | 13.8% | 40.6% |
| Interest Coverage | 14.7 | 8.95 |
| Asset Turnover | 0.55 | 0.53 |
| Fixed Asset Turnover | 3.99 | 6.08 |
| Payout Ratio | 22.3% | 27.0% |
| Dividend Yield | 1.29% | 1.73% |
Interpretation of the Ratios
Alibaba Group Holding Limited
Alibaba shows a generally favorable financial profile with strong liquidity, low debt levels, and good interest coverage. Its net margin is favorable at 13.06%, while return on equity and invested capital are neutral, suggesting stable but moderate profitability. The dividend yield is 1.29%, reflecting a balanced payout supported by consistent free cash flow, with no signs of unsustainable distributions or excessive buybacks.
eBay Inc.
eBay’s ratios indicate strong profitability with a favorable net margin of 19.21% and a high return on equity at 38.29%. However, leverage ratios such as debt-to-equity at 1.52 are unfavorable, signaling higher financial risk. The dividend yield of 1.73% is supported by solid earnings, although some valuation multiples and debt levels warrant cautious consideration given their mixed status.
Which one has the best ratios?
Alibaba’s ratios lean more favorably overall, with 57.14% favorable measures and no unfavorable flags, highlighting stable financial health and moderate risk. eBay, while showing robust profitability, has 14.29% unfavorable ratios, primarily due to higher leverage and valuation concerns. Thus, Alibaba presents a more balanced ratio profile compared to eBay’s slightly favorable but riskier stance.
Strategic Positioning
This section compares the strategic positioning of Alibaba and eBay, focusing on their market position, key segments, and exposure to disruption:
Alibaba
- Market position and competitive pressure
- Key segments and business drivers
- Exposure to technological disruption
eBay
- Large market cap (350B USD), operates multiple retail and tech platforms with broad competitive scope.
- Diverse segments: commerce, logistics, cloud, digital media, and innovation initiatives drive growth.
- Extensive cloud, AI, and digital platform initiatives suggest adaptation to tech disruption.
Alibaba vs eBay Positioning
Alibaba pursues a diversified strategy across commerce, cloud, logistics, and digital media, offering multiple growth drivers but facing complexity. eBay focuses on marketplace platforms, providing a more concentrated but potentially less varied business model.
Which has the best competitive advantage?
Both companies exhibit very favorable moats with ROIC above WACC and growing profitability. eBay shows a slightly higher ROIC but Alibaba’s broader segment diversification supports a durable competitive advantage.
Stock Comparison
The stock price performance of Alibaba Group Holding Limited (BABA) and eBay Inc. (EBAY) over the past 12 months reveals significant bullish trends with strong gains, followed by recent declines indicating contrasting short-term dynamics.
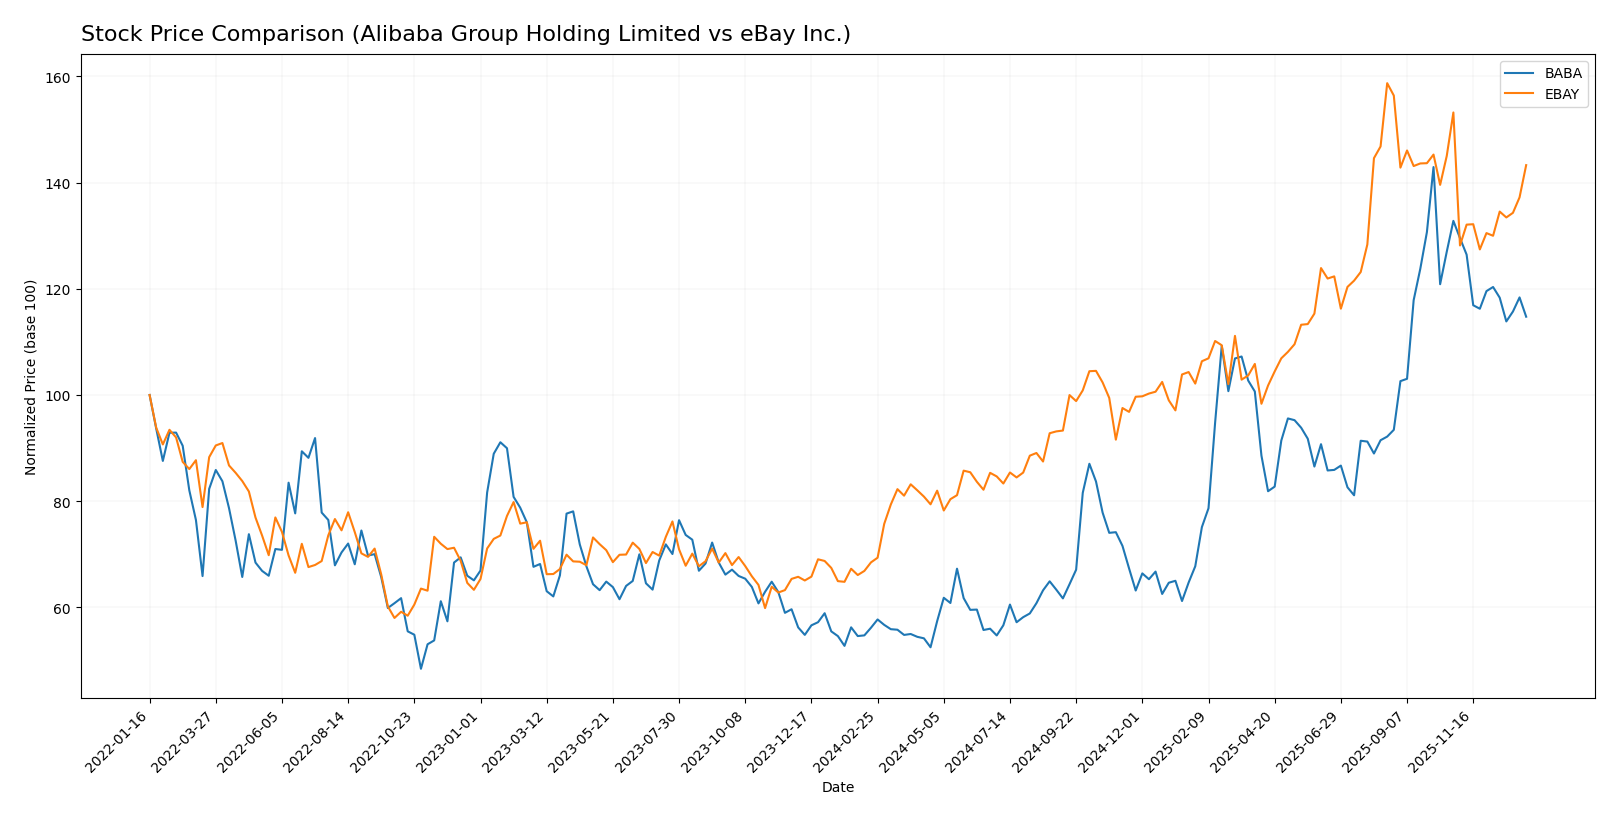
Trend Analysis
Alibaba’s stock gained 104.25% over the past year, showing a bullish trend with decelerating momentum. It reached a high of 188.03 and a low of 69.07, with recent weeks marking a -13.59% pullback.
eBay’s stock rose 109.23% over the same period, also bullish but with deceleration. The price fluctuated between 43.45 and 100.7, and recent changes show a mild -6.47% decline with near-neutral trend slope.
Comparing the two, eBay delivered a slightly higher annual price increase, but Alibaba experienced a sharper recent decline. Both exhibit decelerating bullish trends overall.
Target Prices
The current analyst consensus for target prices indicates moderate upside potential for both Alibaba Group Holding Limited and eBay Inc.
| Company | Target High | Target Low | Consensus |
|---|---|---|---|
| Alibaba Group Holding Limited | 225 | 140 | 186.98 |
| eBay Inc. | 115 | 65 | 96.69 |
Analysts expect Alibaba’s price to rise from 150.96 USD to an average target near 187 USD, suggesting a 23.7% upside. eBay’s consensus target of 96.69 USD also implies a 6.4% potential gain from the current 90.91 USD price.
Analyst Opinions Comparison
This section compares analysts’ ratings and grades for Alibaba Group Holding Limited (BABA) and eBay Inc. (EBAY):
Rating Comparison
BABA Rating
- Rating: B+, considered Very Favorable overall.
- Discounted Cash Flow Score: 3, indicating a moderate valuation based on future cash flow projections.
- ROE Score: 4, showing favorable efficiency in generating profit from equity.
- ROA Score: 4, demonstrating favorable asset utilization to generate earnings.
- Debt To Equity Score: 3, reflecting moderate financial risk with balanced debt levels.
- Overall Score: 3, a moderate summary financial standing.
EBAY Rating
- Rating: B+, considered Very Favorable overall.
- Discounted Cash Flow Score: 3, indicating a moderate valuation based on future cash flow projections.
- ROE Score: 5, showing very favorable efficiency in generating profit from equity.
- ROA Score: 5, demonstrating very favorable asset utilization to generate earnings.
- Debt To Equity Score: 1, reflecting very unfavorable high financial risk due to debt.
- Overall Score: 3, a moderate summary financial standing.
Which one is the best rated?
Both BABA and EBAY share the same overall rating of B+ and an overall score of 3, indicating moderate financial health. However, EBAY scores higher on ROE and ROA but has a significantly lower debt-to-equity score, suggesting higher financial risk compared to BABA.
Scores Comparison
Here is a comparison of the Altman Z-Score and Piotroski Score for Alibaba and eBay:
Alibaba Scores
- Altman Z-Score: 1.72, in the distress zone indicating high bankruptcy risk.
- Piotroski Score: 8, classified as very strong financial health.
eBay Scores
- Altman Z-Score: 5.84, in the safe zone indicating low bankruptcy risk.
- Piotroski Score: 6, considered average financial strength.
Which company has the best scores?
Based strictly on the provided scores, eBay shows stronger financial stability with a safe zone Altman Z-Score, while Alibaba has a higher Piotroski Score indicating stronger financial health. Both have strengths in different score categories.
Grades Comparison
The following tables present recent grades from recognized grading companies for Alibaba Group Holding Limited and eBay Inc.:
Alibaba Group Holding Limited Grades
This table summarizes Alibaba’s latest grades from established financial analysts.
| Grading Company | Action | New Grade | Date |
|---|---|---|---|
| Jefferies | Maintain | Buy | 2026-01-08 |
| Freedom Capital Markets | Downgrade | Hold | 2026-01-06 |
| Benchmark | Maintain | Buy | 2025-11-26 |
| Bernstein | Maintain | Outperform | 2025-11-26 |
| Citigroup | Maintain | Buy | 2025-11-26 |
| JP Morgan | Maintain | Overweight | 2025-11-26 |
| Barclays | Maintain | Overweight | 2025-11-26 |
| Bernstein | Maintain | Outperform | 2025-10-10 |
| JP Morgan | Maintain | Overweight | 2025-10-09 |
| JP Morgan | Maintain | Overweight | 2025-10-01 |
Alibaba’s grades show a strong buy consensus with mostly positive ratings maintained over recent months, indicating analyst confidence.
eBay Inc. Grades
This table displays eBay’s recent grades from credible grading companies.
| Grading Company | Action | New Grade | Date |
|---|---|---|---|
| Wells Fargo | Maintain | Equal Weight | 2026-01-08 |
| Truist Securities | Maintain | Hold | 2025-11-03 |
| Piper Sandler | Maintain | Overweight | 2025-10-30 |
| Barclays | Maintain | Overweight | 2025-10-30 |
| Wells Fargo | Maintain | Equal Weight | 2025-10-30 |
| Benchmark | Maintain | Buy | 2025-10-30 |
| UBS | Maintain | Neutral | 2025-10-30 |
| Needham | Maintain | Buy | 2025-10-30 |
| Cantor Fitzgerald | Maintain | Neutral | 2025-10-30 |
| Evercore ISI Group | Maintain | In Line | 2025-10-30 |
eBay’s grades reflect a mixed consensus, with several hold and neutral ratings alongside some overweight and buy recommendations.
Which company has the best grades?
Alibaba has received stronger and more consistent buy and outperform ratings compared to eBay’s mixed hold, neutral, and buy grades. This stronger analyst consensus for Alibaba may influence investor sentiment towards a more favorable outlook.
Strengths and Weaknesses
Below is a comparative table highlighting the key strengths and weaknesses of Alibaba Group Holding Limited (BABA) and eBay Inc. (EBAY) based on their recent financial and market data.
| Criterion | Alibaba Group Holding Limited (BABA) | eBay Inc. (EBAY) |
|---|---|---|
| Diversification | Highly diversified with strong segments in Customer Management (424B CNY), Logistics (123B CNY), and Cloud Services (85B CNY) | More focused, primarily on Marketplaces ($8.65B in 2024) and Advertising ($1.64B in 2024) |
| Profitability | Moderate net margin of 13.06%, ROIC 7.87% (neutral), consistent value creation (ROIC > WACC by 3.37%) | Higher net margin at 19.21%, stronger ROIC 13.39%, value creation with ROIC > WACC by 4.28% |
| Innovation | Growing investment in Cloud Services and value-added services suggests active innovation | Stable innovation reflected in steady revenue growth in Marketplaces and Advertising |
| Global presence | Strong presence particularly in Asia with expanding cloud and logistics infrastructure | Established global marketplace platform, primarily in North America and Europe |
| Market Share | Large market share in e-commerce and cloud sectors in China, leveraging logistics | Significant player in online marketplaces but smaller scale and less diversified than Alibaba |
Key takeaways: Alibaba exhibits robust diversification and a strong competitive moat with sustained growth in cloud and logistics, though profitability margins are moderate. eBay delivers higher profitability and focused market dominance but faces challenges with higher debt and less diversification. Both companies demonstrate durable competitive advantages, suitable for investors prioritizing different risk-return profiles.
Risk Analysis
Below is a comparative table highlighting key risks for Alibaba Group Holding Limited (BABA) and eBay Inc. (EBAY) as of the most recent fiscal years:
| Metric | Alibaba Group Holding Limited (BABA) | eBay Inc. (EBAY) |
|---|---|---|
| Market Risk | Low beta 0.36; moderate volatility | Higher beta 1.35; more volatile |
| Debt level | Low debt-to-equity 0.25; favorable | High debt-to-equity 1.52; unfavorable |
| Regulatory Risk | High; Chinese regulatory scrutiny | Moderate; US regulations stable |
| Operational Risk | Moderate; diverse segments complexity | Low; focused marketplace model |
| Environmental Risk | Moderate; increasing ESG focus | Low to moderate; less exposed |
| Geopolitical Risk | High; China-US tensions impact | Moderate; primarily US-based |
The most impactful risks are Alibaba’s regulatory and geopolitical exposures, given intensified Chinese government oversight and ongoing US-China tensions. eBay faces higher financial risk due to its elevated debt level but benefits from a stable regulatory environment. Investors should weigh Alibaba’s growth opportunities against regulatory uncertainties, while eBay’s leverage demands cautious risk management.
Which Stock to Choose?
Alibaba Group Holding Limited (BABA) shows a favorable income evolution with a 5.86% revenue growth last year and strong profitability metrics, including a 13.06% net margin and a very favorable global income statement opinion. Its financial ratios are largely favorable, featuring a solid current ratio of 1.54 and low debt levels, complemented by a “Very Favorable” rating of B+ and a “Very Favorable” moat status indicating durable competitive advantage despite some distress zone signals in the Altman Z-Score.
eBay Inc. (EBAY) presents a mixed income evolution, with a slight 1.69% revenue growth last year but unfavorable trends in net margin and earnings per share. Its financial ratios are slightly favorable overall but show concerns such as a high debt-to-equity ratio and an unfavorable price-to-book score. The company holds a “Very Favorable” rating of B+ and maintains a “Very Favorable” moat, supported by a safe zone Altman Z-Score and average Piotroski score, reflecting stability amid some operational challenges.
From a rating and financial health perspective, Alibaba’s stronger income statement growth and more favorable debt profile might appear suitable for investors seeking growth with moderate risk, while eBay’s stable moat and safe financial scores could appeal to more risk-averse investors prioritizing quality and financial safety. The choice could therefore depend on whether an investor values growth potential or financial stability more strongly.
Disclaimer: Investment carries a risk of loss of initial capital. The past performance is not a reliable indicator of future results. Be sure to understand risks before making an investment decision.
Go Further
I encourage you to read the complete analyses of Alibaba Group Holding Limited and eBay Inc. to enhance your investment decisions: