Alibaba Group Holding Limited (BABA) and Best Buy Co., Inc. (BBY) both operate in the specialty retail sector but serve vastly different markets and customer bases. Alibaba is a global e-commerce and technology powerhouse with a diverse portfolio spanning digital retail, cloud computing, and logistics, primarily in China and internationally. Best Buy focuses on consumer electronics retail in North America, emphasizing in-store and online customer experiences. This article will help you decide which company aligns best with your investment goals.

Table of contents
Companies Overview
I will begin the comparison between Alibaba and Best Buy by providing an overview of these two companies and their main differences.
Alibaba Overview
Alibaba Group Holding Limited, based in Hangzhou, China, provides technology infrastructure and marketing reach to help merchants and brands engage with customers domestically and internationally. The company operates across multiple segments, including e-commerce platforms like Taobao and Tmall, logistics via Cainiao, cloud computing, digital media, and local consumer services. Established in 1999, Alibaba has positioned itself as a leading specialty retail and technology provider with a global footprint.
Best Buy Overview
Best Buy Co., Inc., headquartered in Richfield, Minnesota, retails technology products primarily in the United States and Canada. It operates through Domestic and International segments, offering a wide range of electronics, appliances, entertainment products, and related services. Founded in 1966, Best Buy has established a strong physical and digital retail presence with over 1,100 stores and a diverse product portfolio including computing, mobile, smart home, and health technology.
Key similarities and differences
Both Alibaba and Best Buy operate in the specialty retail sector but differ significantly in their business models. Alibaba focuses on digital commerce, technology infrastructure, and services with a broad international reach, leveraging multiple online platforms and cloud services. Best Buy emphasizes physical retail combined with e-commerce, focusing on consumer electronics and appliances mainly in North America. While Alibaba integrates logistics and digital media, Best Buy supplements product sales with services like installation and technical support.
Income Statement Comparison
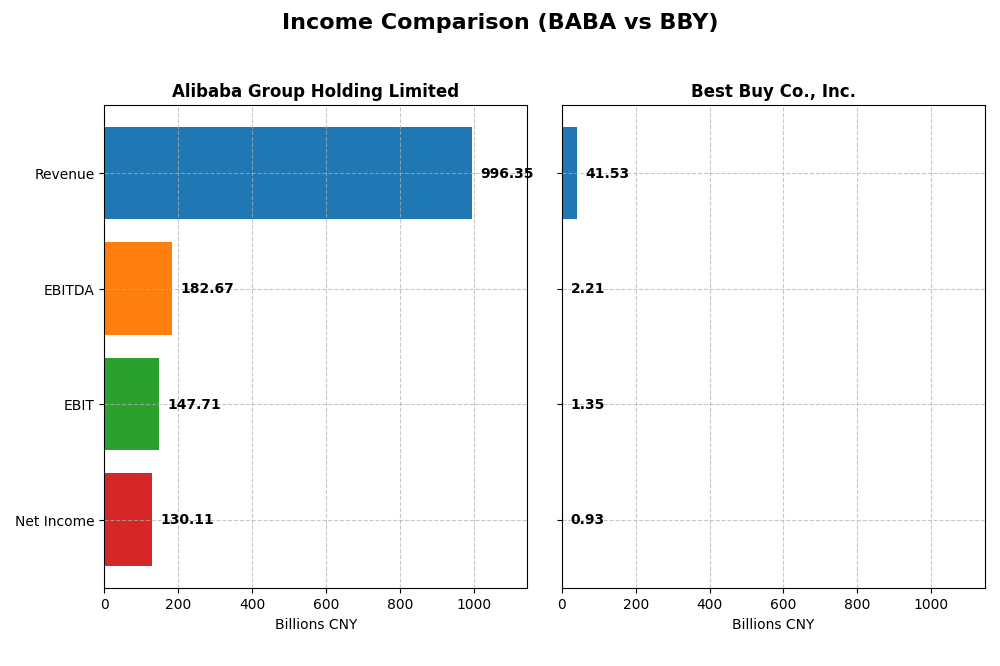
This table presents a side-by-side comparison of key income statement metrics for Alibaba Group Holding Limited and Best Buy Co., Inc. for the most recent fiscal year available.
| Metric | Alibaba Group Holding Limited | Best Buy Co., Inc. |
|---|---|---|
| Market Cap | 350B CNY | 14.8B USD |
| Revenue | 996B CNY | 41.5B USD |
| EBITDA | 183B CNY | 2.21B USD |
| EBIT | 148B CNY | 1.35B USD |
| Net Income | 130B CNY | 927M USD |
| EPS | 55.12 | 4.31 |
| Fiscal Year | 2025 | 2025 |
Income Statement Interpretations
Alibaba Group Holding Limited
Alibaba’s revenue increased by 38.9% from 2021 to 2025, demonstrating solid growth, although net income declined by 13.6% over the same period. Margins show mixed trends; gross margin is favorable at 39.95%, and net margin improved significantly in 2025 with a 53.6% increase year-over-year. The latest year saw moderate revenue growth of 5.86%, but operating expenses grew at the same rate, slightly pressuring margins despite a 23.6% EBIT growth.
Best Buy Co., Inc.
Best Buy experienced a 12.13% revenue decline from 2021 to 2025, with net income falling sharply by 48.44%. Margins remained weak, with a gross margin of 22.6% but only a 2.23% net margin, both showing unfavorable trends overall. The most recent fiscal year saw a 4.43% revenue decrease, coupled with declines across gross profit, EBIT, and net margin, reflecting operational and profitability challenges.
Which one has the stronger fundamentals?
Alibaba’s fundamentals appear stronger, supported by favorable gross and net margins and positive EBIT growth despite some increases in operating expenses. Its revenue growth and margin improvements in the latest year contrast with Best Buy’s declining revenue and deteriorating profitability. Conversely, Best Buy faces persistent unfavorable trends in income growth and margins, signaling weaker income statement fundamentals.
Financial Ratios Comparison
The table below presents the most recent financial ratios for Alibaba Group Holding Limited (BABA) and Best Buy Co., Inc. (BBY), reflecting their fiscal year 2025 performance.
| Ratios | Alibaba Group Holding Limited (BABA) | Best Buy Co., Inc. (BBY) |
|---|---|---|
| ROE | 12.9% | 33.0% |
| ROIC | 7.9% | 16.6% |
| P/E | 17.3 | 19.9 |
| P/B | 2.23 | 6.58 |
| Current Ratio | 1.54 | 1.03 |
| Quick Ratio | 1.49 | 0.39 |
| D/E (Debt-to-Equity) | 0.25 | 1.44 |
| Debt-to-Assets | 13.8% | 27.4% |
| Interest Coverage | 14.7 | 33.7 |
| Asset Turnover | 0.55 | 2.81 |
| Fixed Asset Turnover | 3.99 | 8.38 |
| Payout Ratio | 22.3% | 87.1% |
| Dividend Yield | 1.29% | 4.37% |
Interpretation of the Ratios
Alibaba Group Holding Limited
Alibaba displays a mix of favorable and neutral ratios, with a particularly strong current and quick ratio indicating solid short-term liquidity. Its debt-to-equity and interest coverage ratios also suggest prudent financial management. The dividend yield is moderate at 1.29%, reflecting a stable payout, supported by consistent free cash flow, with no significant risk of unsustainable distributions or excessive buybacks.
Best Buy Co., Inc.
Best Buy shows favorable returns on equity and invested capital, and strong asset turnover ratios, but suffers from weak profitability indicated by a low net margin and a high debt-to-equity ratio, which may raise financial risk concerns. The company offers a robust dividend yield of 4.37%, supported by healthy coverage ratios, but its quick ratio below 0.4 signals potential liquidity constraints.
Which one has the best ratios?
Alibaba’s ratios are globally favorable with strong liquidity and moderate leverage, while Best Buy exhibits higher returns but with notable weaknesses in profitability and liquidity. Alibaba’s balanced financial structure contrasts with Best Buy’s elevated financial risk, making Alibaba’s overall ratio profile more stable and less risky by comparison.
Strategic Positioning
This section compares the strategic positioning of Alibaba and Best Buy, focusing on market position, key segments, and exposure to technological disruption:
Alibaba Group Holding Limited
- Leading e-commerce and cloud services giant facing global competition.
- Diverse segments including e-commerce platforms, logistics, cloud, digital media, and AI services.
- High technological exposure with AI, cloud, digital media, and innovative platforms integration.
Best Buy Co., Inc.
- Major US and Canada retailer in technology products with strong local presence.
- Concentrated on consumer electronics, computing, appliances, entertainment, and services.
- Moderate exposure focused on retail technology and related service innovations.
Alibaba vs Best Buy Positioning
Alibaba pursues a diversified strategy across e-commerce, cloud, logistics, and digital services, offering broad market reach. Best Buy focuses mainly on consumer electronics and retail services, concentrating its business. Diversification provides Alibaba varied revenue sources; Best Buy’s focus may limit growth scope but enhances specialization.
Which has the best competitive advantage?
Alibaba shows a very favorable moat with growing ROIC above WACC, indicating durable competitive advantage and increasing profitability. Best Buy creates value but has a declining ROIC trend, suggesting a less sustainable competitive advantage.
Stock Comparison
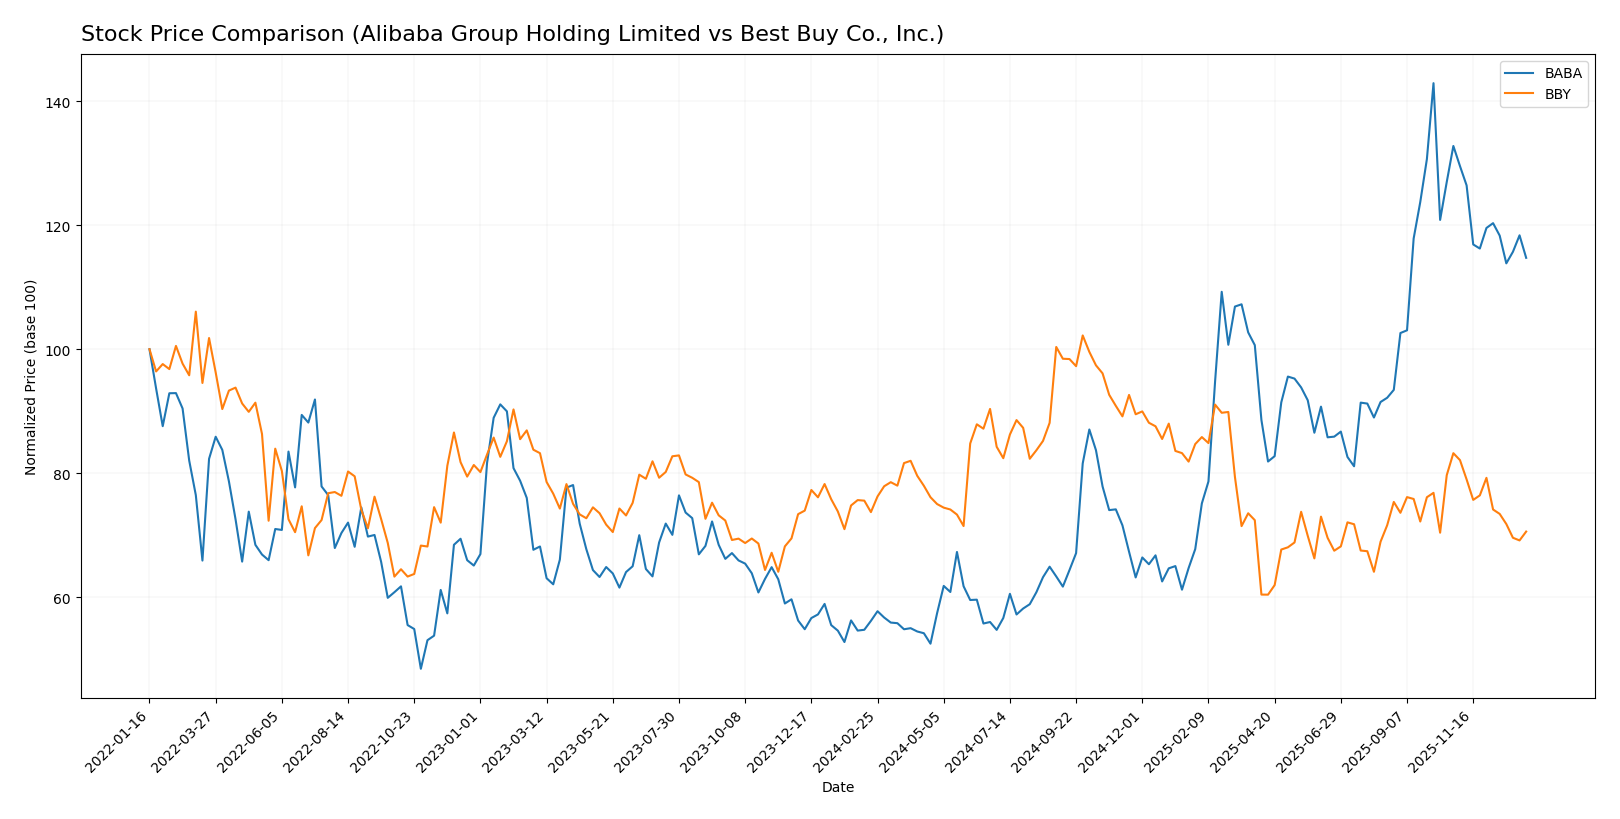
The stock price movements of Alibaba Group Holding Limited and Best Buy Co., Inc. over the past 12 months reveal contrasting trading dynamics, with Alibaba showing strong gains overall but recent weakness, while Best Buy demonstrates a steady downward trend with decelerating declines.
Trend Analysis
Alibaba’s stock price increased by 104.25% over the past year, indicating a bullish trend with decelerating momentum and a high volatility level (31.46 std deviation). The stock peaked at 188.03 and bottomed at 69.07.
Best Buy’s stock price declined by 4.26% over the past year, reflecting a bearish trend with deceleration and moderate volatility (9.57 std deviation). The highest price reached 102.26 and the lowest was 60.43.
Comparing the two, Alibaba delivered the highest market performance with a substantial bullish gain, while Best Buy experienced a modest bearish decline over the same period.
Target Prices
Analysts show a moderately bullish consensus for Alibaba Group Holding Limited and Best Buy Co., Inc.
| Company | Target High | Target Low | Consensus |
|---|---|---|---|
| Alibaba Group Holding Limited | 225 | 140 | 186.98 |
| Best Buy Co., Inc. | 96 | 75 | 82.13 |
The target consensus for Alibaba at 186.98 USD suggests upside potential from the current price of 150.96 USD. Best Buy’s consensus target of 82.13 USD also indicates expected gains versus the current price near 70.61 USD. Both stocks reflect positive analyst outlooks within their trading ranges.
Analyst Opinions Comparison
This section compares analysts’ ratings and grades for Alibaba Group Holding Limited and Best Buy Co., Inc.:
Rating Comparison
Alibaba Group Holding Limited Rating
- Rating: B+, considered very favorable overall.
- Discounted Cash Flow Score: Moderate at 3, indicating average valuation.
- ROE Score: Favorable at 4, showing efficient use of equity.
- ROA Score: Favorable at 4, effective asset utilization.
- Debt To Equity Score: Moderate at 3, balanced financial risk.
Best Buy Co., Inc. Rating
- Rating: B-, also considered very favorable overall.
- Discounted Cash Flow Score: Moderate at 3, similar valuation view.
- ROE Score: Very favorable at 5, indicating excellent equity use.
- ROA Score: Moderate at 3, average asset utilization.
- Debt To Equity Score: Very unfavorable at 1, higher financial risk.
Which one is the best rated?
Based on the data, Alibaba holds a better overall rating (B+) with more balanced financial risk, while Best Buy excels in ROE but scores poorly on debt-to-equity, indicating higher risk. Overall ratings are equal at a moderate level.
Scores Comparison
Here is a comparison of the financial scores for Alibaba and Best Buy:
Alibaba Scores
- Altman Z-Score: 1.72, indicating financial distress and high bankruptcy risk.
- Piotroski Score: 8, considered very strong financial health.
Best Buy Scores
- Altman Z-Score: 3.57, indicating a safe zone with low bankruptcy risk.
- Piotroski Score: 7, considered strong financial health.
Which company has the best scores?
Best Buy has a higher Altman Z-Score in the safe zone, indicating lower bankruptcy risk, while Alibaba has a stronger Piotroski Score. Overall, Best Buy’s financial stability appears more secure based on these scores.
Grades Comparison
The following is a detailed comparison of the latest reliable grades for Alibaba Group Holding Limited and Best Buy Co., Inc.:
Alibaba Group Holding Limited Grades
This table summarizes recent grades assigned by reputable financial institutions:
| Grading Company | Action | New Grade | Date |
|---|---|---|---|
| Jefferies | Maintain | Buy | 2026-01-08 |
| Freedom Capital Markets | Downgrade | Hold | 2026-01-06 |
| Benchmark | Maintain | Buy | 2025-11-26 |
| Bernstein | Maintain | Outperform | 2025-11-26 |
| Citigroup | Maintain | Buy | 2025-11-26 |
| JP Morgan | Maintain | Overweight | 2025-11-26 |
| Barclays | Maintain | Overweight | 2025-11-26 |
| Bernstein | Maintain | Outperform | 2025-10-10 |
| JP Morgan | Maintain | Overweight | 2025-10-09 |
| JP Morgan | Maintain | Overweight | 2025-10-01 |
Alibaba’s grades mostly reflect strong buy and outperform sentiments, with a single recent downgrade to hold. The consensus remains positive overall.
Best Buy Co., Inc. Grades
This table provides a summary of recent grades from established grading firms:
| Grading Company | Action | New Grade | Date |
|---|---|---|---|
| Barclays | Maintain | Equal Weight | 2026-01-08 |
| Evercore ISI Group | Maintain | In Line | 2025-12-09 |
| UBS | Maintain | Buy | 2025-11-26 |
| Guggenheim | Maintain | Buy | 2025-11-26 |
| Barclays | Maintain | Equal Weight | 2025-11-26 |
| Morgan Stanley | Maintain | Equal Weight | 2025-11-26 |
| Truist Securities | Maintain | Hold | 2025-11-26 |
| Evercore ISI Group | Maintain | In Line | 2025-11-26 |
| Telsey Advisory Group | Maintain | Outperform | 2025-11-26 |
| Jefferies | Maintain | Buy | 2025-11-25 |
Best Buy’s grades show a mix of buy, hold, and equal weight ratings, indicating a more cautious outlook compared to Alibaba.
Which company has the best grades?
Alibaba Group Holding Limited has received comparatively stronger grades, predominantly buy and outperform ratings, suggesting more bullish analyst sentiment. Best Buy Co., Inc. shows a more balanced mix of buy, hold, and equal weight ratings, reflecting a more moderate view that may affect investor confidence differently.
Strengths and Weaknesses
Below is a comparative overview of key strengths and weaknesses for Alibaba Group Holding Limited (BABA) and Best Buy Co., Inc. (BBY) based on the most recent financial and operational data.
| Criterion | Alibaba Group Holding Limited (BABA) | Best Buy Co., Inc. (BBY) |
|---|---|---|
| Diversification | Highly diversified with strong segments in Customer Management (424B CNY), Logistics (123B CNY), and Cloud Services (85B CNY). | Broad product range including Computing & Mobile Phones (18.7B USD) and Consumer Electronics (12.1B USD), but less diversified globally. |
| Profitability | Solid net margin at 13.06%, ROIC of 7.87%, and growing profitability. | Lower net margin at 2.23%, but high ROIC of 16.61%; profitability is declining. |
| Innovation | Strong investment in cloud and digital services, showing growing ROIC and competitive advantage. | Moderate innovation focused on consumer electronics; ROIC declining suggests innovation impact is weakening. |
| Global presence | Extensive global footprint, especially dominant in Asia with scalable cloud and logistics infrastructure. | Primarily North American presence with limited global expansion. |
| Market Share | Leading e-commerce and cloud services player in China and expanding internationally. | Significant market share in U.S. consumer electronics retail but faces intense competition and margin pressure. |
Key takeaways: Alibaba demonstrates strong and growing profitability with excellent diversification and global reach, underpinning a durable competitive advantage. Best Buy remains profitable with a strong ROIC, but its declining profitability and less diversified global presence present risks investors should monitor carefully.
Risk Analysis
Below is a comparative table summarizing key risks for Alibaba Group Holding Limited (BABA) and Best Buy Co., Inc. (BBY) based on the latest 2025 data and 2026 market context:
| Metric | Alibaba Group Holding Limited (BABA) | Best Buy Co., Inc. (BBY) |
|---|---|---|
| Market Risk | Low beta (0.36) implies lower volatility but sensitive to China market dynamics and e-commerce competition | Higher beta (1.43) indicates more volatility, exposed to US consumer spending cycles |
| Debt Level | Low debt-to-equity (0.25), favorable debt metrics and interest coverage | High debt-to-equity (1.44), unfavorable leverage though interest coverage remains strong |
| Regulatory Risk | Significant due to China’s evolving tech and data policies | Moderate, mainly US consumer protection and import/export regulations |
| Operational Risk | Complex global operations across multiple platforms; risks from supply chain and tech innovation | Retail supply chain and inventory management risks; fewer segments but exposed to tech product cycles |
| Environmental Risk | Moderate; growing pressure on sustainability in China and global logistics | Moderate; corporate responsibility initiatives but retail footprint impact remains steady |
| Geopolitical Risk | High risk due to US-China tensions affecting trade and technology access | Moderate risk; mainly related to global supply chain disruptions and tariffs |
Synthesis: Alibaba faces the most impactful risks from regulatory and geopolitical tensions, amplified by its large exposure to China’s market environment. Best Buy’s primary concerns revolve around high leverage and market volatility linked to US consumer trends. Alibaba’s low debt and favorable liquidity mitigate financial distress risk despite an Altman Z-Score in the distress zone, suggesting caution. Best Buy’s safer Altman Z-Score and strong Piotroski score reflect stable financial health but watch for leverage risks.
Which Stock to Choose?
Alibaba Group Holding Limited (BABA) shows favorable income growth with a 5.86% revenue increase over one year, strong profitability, and a solid debt profile. Its financial ratios are mostly favorable, supported by a very favorable moat rating and a B+ overall rating, despite some neutral indicators.
Best Buy Co., Inc. (BBY) exhibits an unfavorable income trend with declining revenue and profitability metrics. Its financial ratios are slightly favorable, but debt and valuation ratios appear unfavorable. The company has a slightly favorable moat and a B- overall rating, reflecting mixed financial health and risk concerns.
For investors prioritizing durable competitive advantages and consistent profitability, Alibaba’s profile might appear more favorable. Conversely, those focused on high return on equity and capital efficiency, despite recent income challenges, could find Best Buy’s metrics suggestive of potential value, depending on risk tolerance and investment strategy.
Disclaimer: Investment carries a risk of loss of initial capital. The past performance is not a reliable indicator of future results. Be sure to understand risks before making an investment decision.
Go Further
I encourage you to read the complete analyses of Alibaba Group Holding Limited and Best Buy Co., Inc. to enhance your investment decisions: