Home > Comparison > Consumer Cyclical > AMZN vs BABA
The strategic rivalry between Amazon.com, Inc. and Alibaba Group Holding Limited shapes the global specialty retail sector. Amazon operates as a capital-intensive, diversified e-commerce and cloud computing powerhouse, while Alibaba excels as a high-margin, technology-driven digital marketplace with vast Chinese market reach. This head-to-head pits scale and innovation against regional dominance and platform monetization. This analysis aims to identify which corporate trajectory offers the superior risk-adjusted outlook for diversified investors in 2026.

Table of contents
Companies Overview
Amazon.com, Inc. and Alibaba Group Holding Limited are two powerhouses shaping global specialty retail and technology infrastructure markets.
Amazon.com, Inc.: Global E-Commerce and Cloud Giant
Amazon dominates specialty retail through its diverse revenue streams including North America, International sales, and Amazon Web Services (AWS). It generates income by retailing consumer products, third-party seller programs, and cloud computing services. In 2026, Amazon’s strategic focus sharpens on expanding AWS capabilities and enhancing its Amazon Prime ecosystem to maintain market leadership.
Alibaba Group Holding Limited: China’s E-Commerce and Tech Infrastructure Leader
Alibaba excels in providing technology infrastructure and e-commerce platforms across China and beyond. It drives revenue through multiple segments like China Commerce, Cloud services, and local consumer platforms such as Taobao and Tmall. In 2026, Alibaba prioritizes integrating AI innovations and expanding logistic services to deepen market penetration and improve user engagement.
Strategic Collision: Similarities & Divergences
Both companies leverage platform-based ecosystems but diverge in geographic focus and business models. Amazon combines retail with cloud dominance globally; Alibaba emphasizes tech infrastructure and local service integration mainly in China. Their primary battleground is digital commerce and cloud computing. Amazon offers broad market exposure; Alibaba’s profile is more regional with a technology-driven growth strategy.
Income Statement Comparison
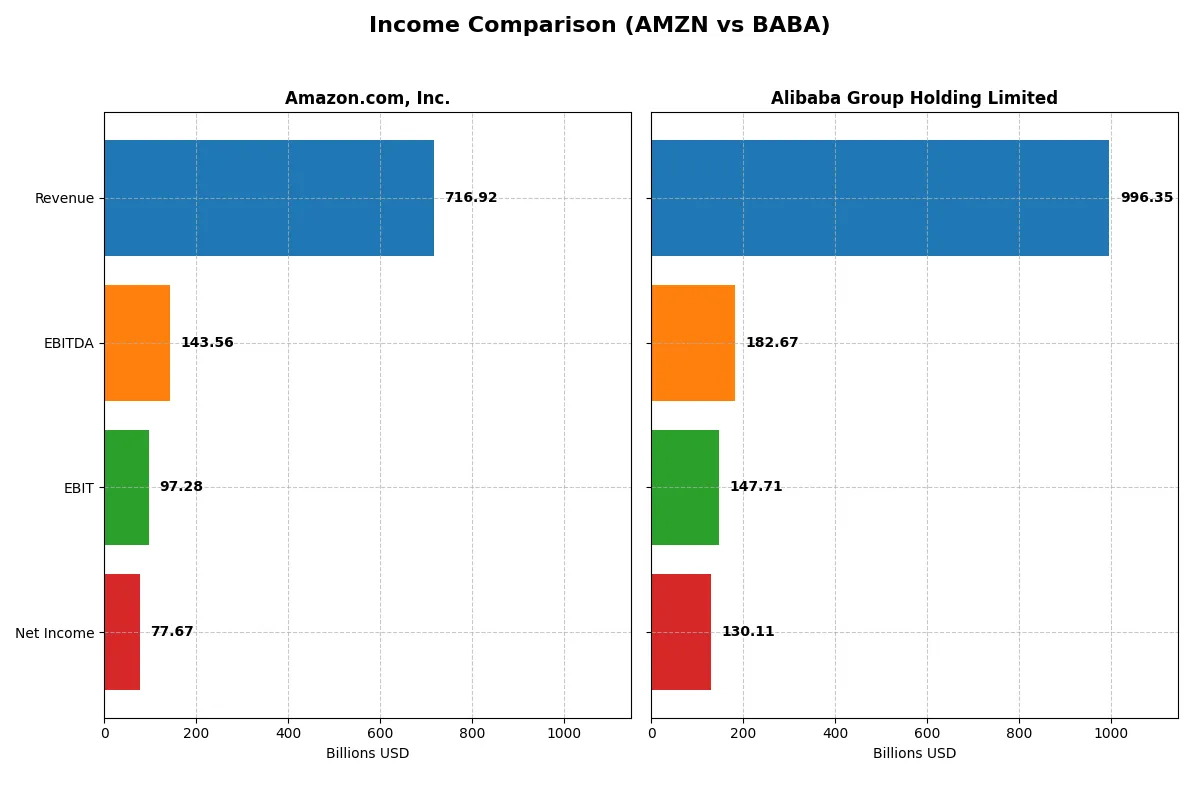
This data dissects the core profitability and scalability of both corporate engines to reveal who dominates the bottom line:
| Metric | Amazon.com, Inc. (AMZN) | Alibaba Group Holding Limited (BABA) |
|---|---|---|
| Revenue | 717B | 996B |
| Cost of Revenue | 356B | 598B |
| Operating Expenses | 281B | 257B |
| Gross Profit | 361B | 398B |
| EBITDA | 144B | 183B |
| EBIT | 97.3B | 148B |
| Interest Expense | 2.3B | 9.6B |
| Net Income | 77.7B | 129B |
| EPS | 7.29 | 55.12 |
| Fiscal Year | 2025 | 2025 |
Income Statement Analysis: The Bottom-Line Duel
This income statement comparison reveals which company operates with stronger efficiency and profitability under current market conditions.
Amazon.com, Inc. Analysis
Amazon’s revenue surged from $470B in 2021 to $717B in 2025, with net income soaring from $33B to $78B. Its gross margin consistently held above 50%, signaling robust cost control. The 2025 net margin of 10.8% and a 37% EBIT growth demonstrate Amazon’s accelerating profitability and operational momentum.
Alibaba Group Holding Limited Analysis
Alibaba grew revenue from CNY 717B in 2021 to CNY 996B in 2025, but net income declined from CNY 150B to CNY 129B over the same period. Gross margin at 40% trails Amazon’s, though its EBIT margin at 14.8% remains strong. Alibaba’s 2025 net margin improved to 13.1%, reflecting efficiency gains despite slower revenue growth.
Verdict: Margin Expansion vs. Revenue Acceleration
Amazon outpaces Alibaba in revenue growth and net income expansion, demonstrating superior scale and margin improvement. Alibaba shows higher EBIT and net margins but faces net income headwinds over five years. For investors, Amazon’s growth-driven profitability contrasts with Alibaba’s margin-focused but less dynamic profile.
Financial Ratios Comparison
These vital ratios act as a diagnostic tool to expose the underlying fiscal health, valuation premiums, and capital efficiency of the companies compared below:
| Ratios | Amazon.com, Inc. (AMZN) | Alibaba Group Holding Limited (BABA) |
|---|---|---|
| ROE | 18.9% | 12.9% |
| ROIC | 10.7% | 7.9% |
| P/E | 31.8 | 17.3 |
| P/B | 6.0 | 2.2 |
| Current Ratio | 1.05 | 1.54 |
| Quick Ratio | 0.88 | 1.49 |
| D/E (Debt-to-Equity) | 0.37 | 0.25 |
| Debt-to-Assets | 18.7% | 13.8% |
| Interest Coverage | 35.2 | 14.7 |
| Asset Turnover | 0.88 | 0.55 |
| Fixed Asset Turnover | 2.01 | 3.99 |
| Payout ratio | 0% | 22.5% |
| Dividend yield | 0% | 1.30% |
| Fiscal Year | 2025 | 2025 |
Efficiency & Valuation Duel: The Vital Signs
Ratios act as a company’s DNA, revealing hidden risks and operational excellence behind headline figures.
Amazon.com, Inc.
Amazon posts a strong 18.9% ROE and favorable 10.8% net margin, demonstrating robust profitability. However, its P/E of 31.8 signals an expensive valuation, stretched beyond sector averages. The company reinvests heavily in R&D (15% of revenue), foregoing dividends to fuel growth, reflecting a long-term capital allocation focus.
Alibaba Group Holding Limited
Alibaba shows a solid 13.1% net margin but a more moderate 12.9% ROE, indicating steady profit generation. Its P/E of 17.3 suggests a reasonably valued stock. Alibaba maintains a 1.3% dividend yield and strong liquidity ratios, balancing shareholder returns with operational stability and measured capital deployment.
Premium Valuation vs. Operational Stability
Amazon commands higher profitability but at a premium valuation, carrying reinvestment risk without dividends. Alibaba offers a more balanced risk-reward with solid margins, dividends, and favorable liquidity. Investors favoring growth may lean Amazon; those seeking income and stability might prefer Alibaba.
Which one offers the Superior Shareholder Reward?
I observe Amazon (AMZN) opts for zero dividends but minimal buybacks, focusing on reinvestment in growth and capex, yielding a slim 0.7 FCF per share in 2025. Alibaba (BABA) pays a moderate 1.3% dividend yield with a 22-23% payout ratio and executes robust buybacks, supported by strong free cash flow (33B CNY). Alibaba’s consistent dividend and buyback mix offers a more balanced, sustainable shareholder reward in 2026. I find Alibaba the superior total return pick given its income plus capital return strategy, contrasting Amazon’s growth-centric approach with negligible direct payouts.
Comparative Score Analysis: The Strategic Profile
The radar chart reveals the fundamental DNA and trade-offs of Amazon.com, Inc. and Alibaba Group Holding Limited:
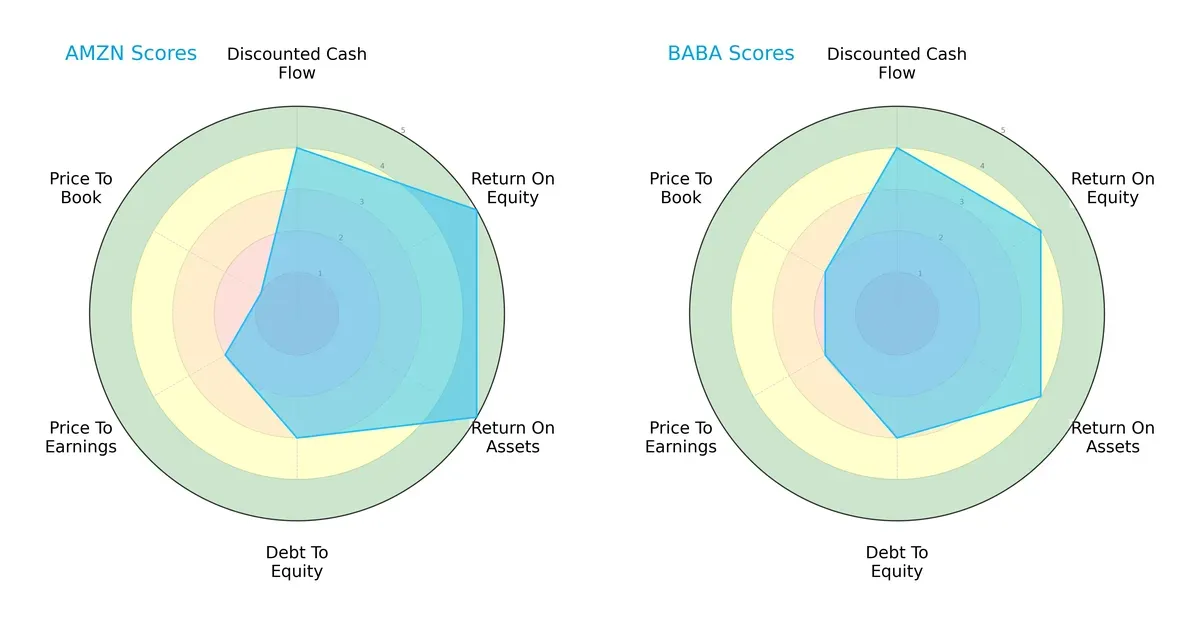
Amazon exhibits superior efficiency, leading in ROE and ROA with top scores of 5 each, indicating robust profit generation and asset use. Alibaba holds a solid but slightly lower efficiency profile with scores of 4 in these categories. Both firms share moderate financial risk with equal debt-to-equity scores of 3. Valuation metrics reveal Amazon’s riskier positioning, scoring very low in price-to-book at 1 versus Alibaba’s 2, signaling Amazon may be overvalued relative to book value. Alibaba’s more balanced valuation contrasts with Amazon’s reliance on operational excellence to justify its premium.
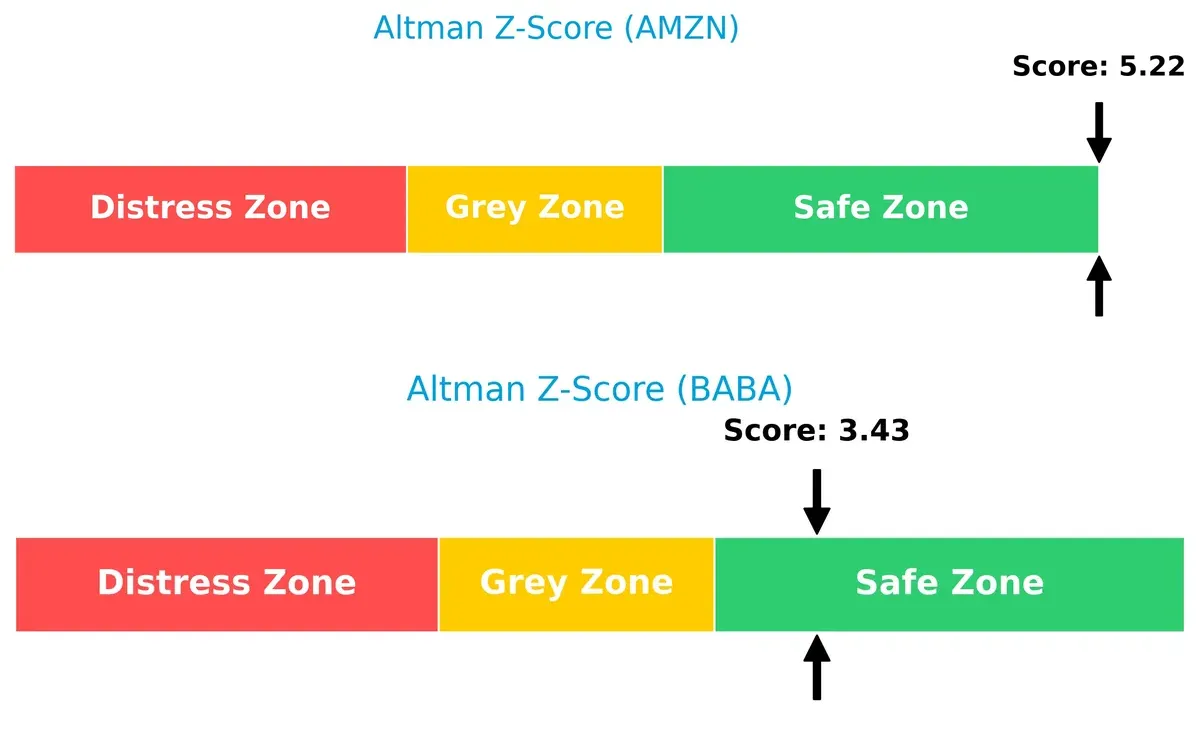
Bankruptcy Risk: Solvency Showdown
Amazon’s Altman Z-Score of 5.22 versus Alibaba’s 3.43 places both firms comfortably in the safe zone, but Amazon’s higher score implies stronger solvency and a more secure long-term outlook in this cycle:
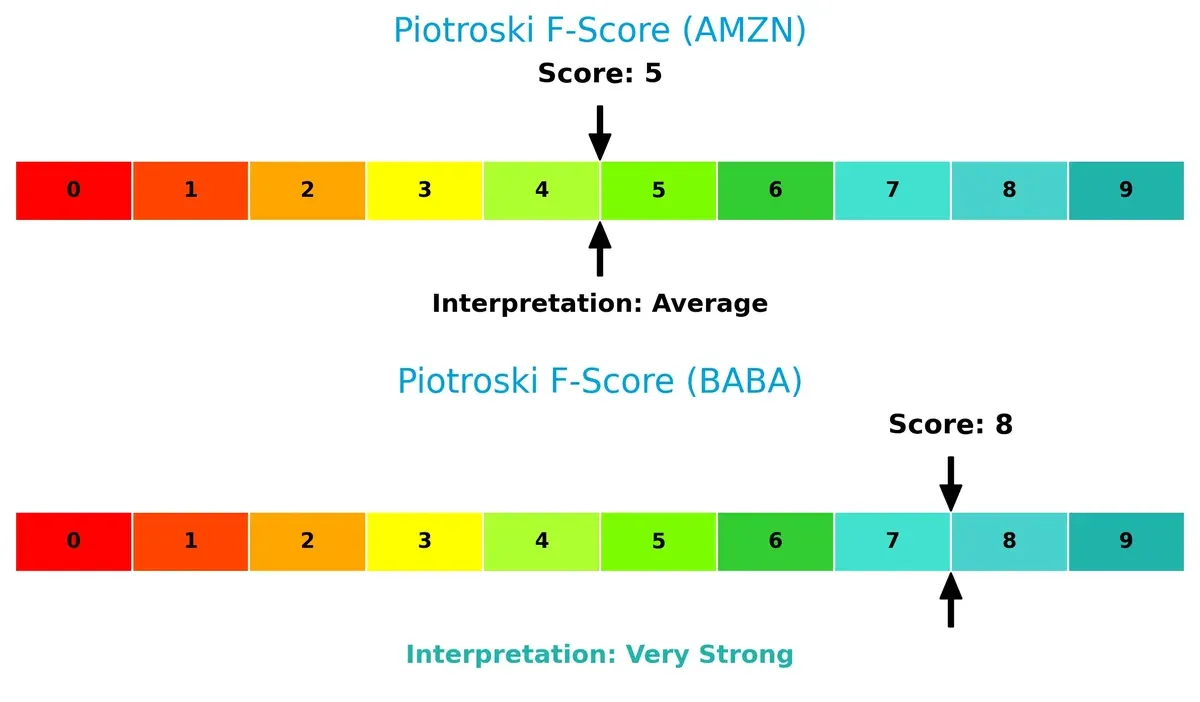
Financial Health: Quality of Operations
Alibaba’s Piotroski F-Score of 8 vastly outperforms Amazon’s 5, signaling Alibaba’s superior financial health and operational quality. This suggests Amazon shows moderate internal weaknesses relative to Alibaba’s robust fundamentals:
How are the two companies positioned?
This section dissects Amazon and Alibaba’s operational DNA by comparing their revenue distribution and internal strengths and weaknesses. The goal is to confront their economic moats to identify which model offers the most resilient, sustainable advantage today.
Revenue Segmentation: The Strategic Mix
This visual comparison dissects how Amazon.com, Inc. and Alibaba Group Holding Limited diversify their income streams and reveals where their primary sector bets lie:
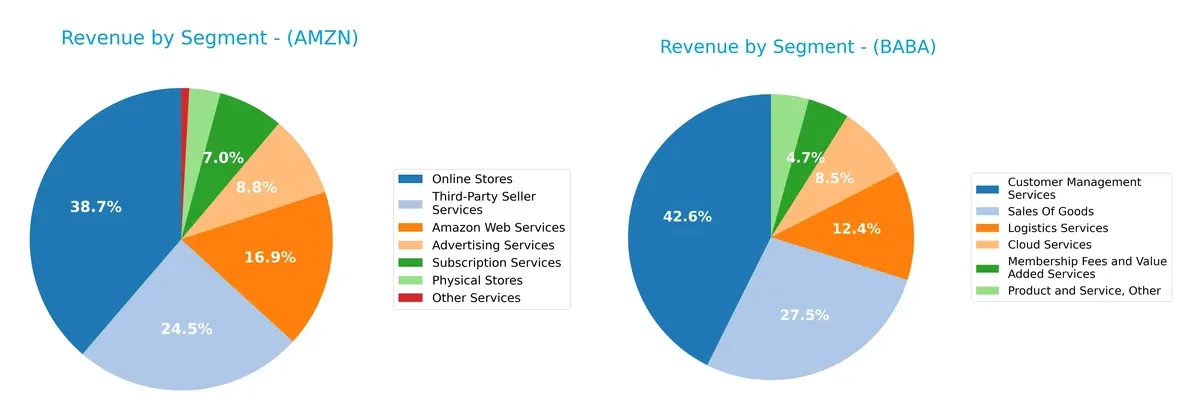
Amazon shows a highly diversified portfolio with major streams from Online Stores ($247B), Third-Party Seller Services ($156B), and AWS ($108B). Alibaba leans heavily on Customer Management Services ($425B) and Sales of Goods ($274B), with Cloud Services ($85B) as a significant but smaller contributor. Amazon’s mix anchors on ecosystem lock-in, while Alibaba’s concentration signals dominant marketplace infrastructure with notable exposure to retail cycles.
Strengths and Weaknesses Comparison
This table compares the strengths and weaknesses of Amazon.com, Inc. and Alibaba Group Holding Limited:
Amazon Strengths
- Diverse revenue streams including AWS, online stores, ads, subscriptions
- Strong profitability with 10.83% net margin and 18.89% ROE
- Favorable leverage with 0.37 debt/equity and high interest coverage
- Significant global presence with large North America and Europe sales
- Leading market share in cloud and e-commerce sectors
Alibaba Strengths
- Higher net margin at 13.06% and favorable WACC at 5.41%
- Strong liquidity with current ratio 1.54 and quick ratio 1.49
- Low leverage with 0.25 debt/equity and solid interest coverage
- Innovation focus with high fixed asset turnover of 3.99
- Large scale in customer management and logistics services
Amazon Weaknesses
- Elevated valuation metrics with PE 31.83 and PB 6.01 considered unfavorable
- Lower quick ratio at 0.88, indicating tighter liquidity
- No dividend yield, which may deter income investors
- Neutral asset turnover at 0.88 suggests room for efficiency gains
Alibaba Weaknesses
- Moderate ROE of 12.86% and ROIC of 7.87% only neutral
- Neutral PE 17.32 and PB 2.23 imply average market valuation
- Asset turnover at 0.55 is neutral, suggesting less operational efficiency
- No detailed geographic revenue segmentation limits global presence insight
Amazon excels in diversified revenue and strong profitability but carries high valuation and liquidity constraints. Alibaba shows stronger liquidity and cost of capital advantages but faces neutral profitability and operational efficiency. Both companies reflect distinct strategic strengths aligned with their market environments.
The Moat Duel: Analyzing Competitive Defensibility
A structural moat is the only true shield protecting long-term profits from relentless competitive erosion. Let’s dissect how Amazon and Alibaba defend their turf:
Amazon.com, Inc.: Scale and Integration Advantage
Amazon’s primary moat stems from its vast logistics network and integrated ecosystem, creating strong switching costs. This drives stable margins and rising ROIC, although it currently trails its WACC. In 2026, AWS growth and global retail expansions could deepen this advantage, but margin pressure remains a risk.
Alibaba Group Holding Limited: Platform Dominance and Network Effects
Alibaba’s moat centers on powerful network effects across its diversified e-commerce and cloud platforms, yielding an ROIC well above WACC. Unlike Amazon, Alibaba’s profitability shows stronger value creation. Expansion into AI-driven services and international markets could further fortify its position.
Moat Strength Showdown: Logistics Scale vs. Network Effects
Alibaba’s wider moat, evidenced by superior ROIC relative to WACC and accelerating profitability, outpaces Amazon’s slightly favorable moat. Alibaba appears better equipped to defend market share amid intensifying competition in 2026.
Which stock offers better returns?
Over the past 12 months, Amazon and Alibaba displayed markedly different price dynamics, with Alibaba accelerating its gains and Amazon showing a decelerating uptrend.
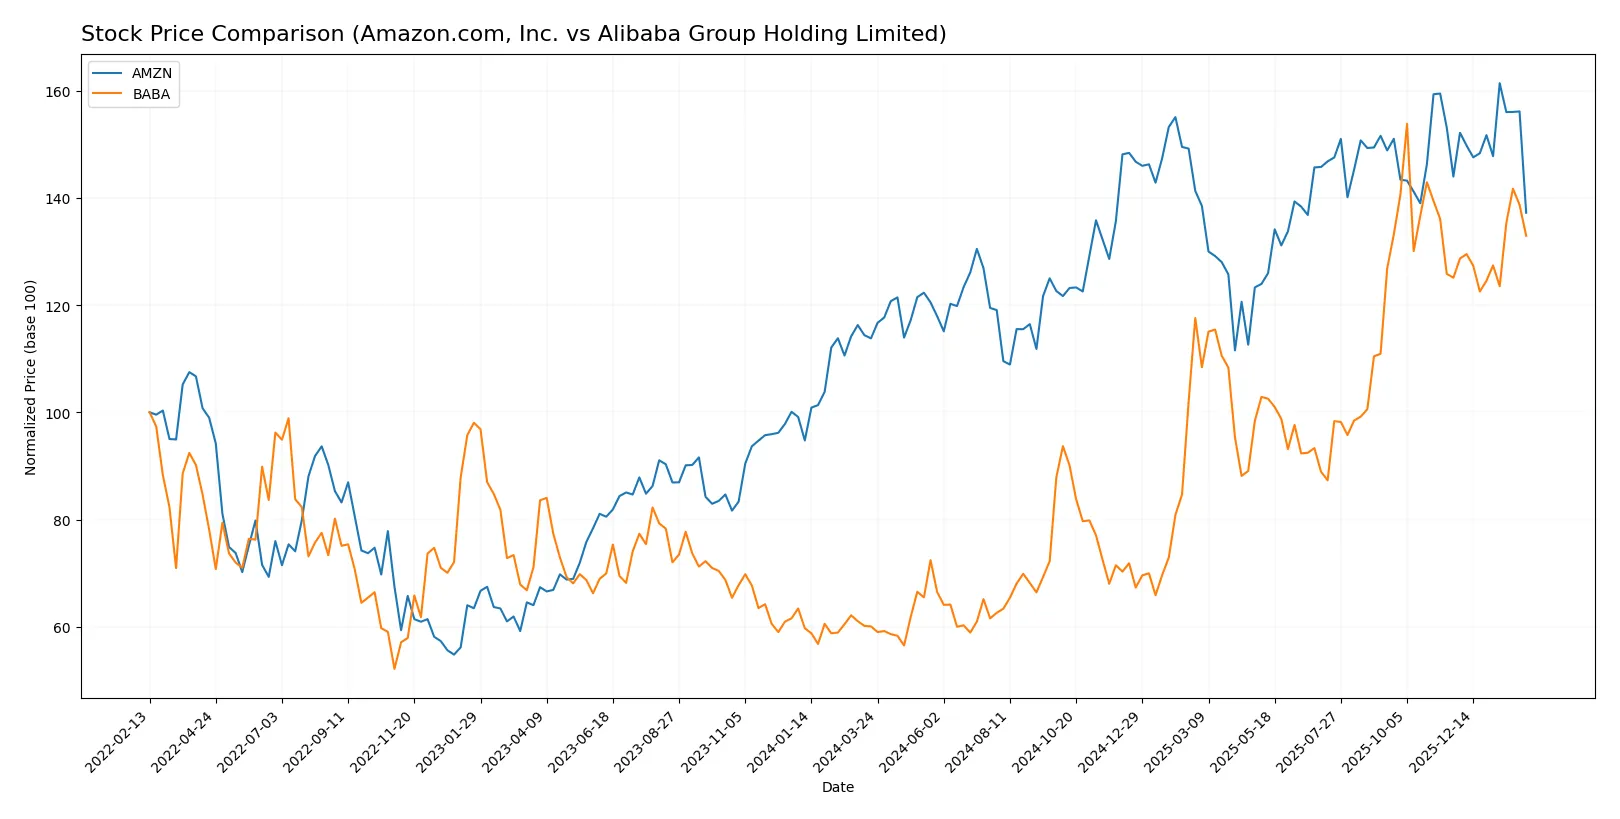
Trend Comparison
Amazon’s stock rose 20.58% over the last year, maintaining a bullish trend despite decelerating momentum. The price ranged between 167 and 247, with notable volatility (std dev 21.86%).
Alibaba’s stock surged 121.34%, sustaining a bullish trend with accelerating momentum. It hit a low of 69 and a high of 188, showing higher volatility (std dev 32.62%).
Alibaba outperformed Amazon significantly, delivering the highest market returns over the past year with stronger acceleration.
Target Prices
Analyst consensus suggests moderate upside potential for both Amazon.com, Inc. and Alibaba Group Holding Limited.
| Company | Target Low | Target High | Consensus |
|---|---|---|---|
| Amazon.com, Inc. | 175 | 315 | 283.86 |
| Alibaba Group Holding Limited | 140 | 225 | 188.62 |
Amazon’s consensus target of $283.86 stands well above its current $210.32 price, indicating analyst optimism. Alibaba’s $188.62 target also exceeds its current $162.49, reflecting positive growth expectations.

Don’t Let Luck Decide Your Entry Point
Optimize your entry points with our advanced ProRealTime indicators. You’ll get efficient buy signals with precise price targets for maximum performance. Start outperforming now!
How do institutions grade them?
Amazon.com, Inc. Grades
The following table summarizes recent institutional grades for Amazon.com, Inc.:
| Grading Company | Action | New Grade | Date |
|---|---|---|---|
| BMO Capital | Maintain | Outperform | 2026-02-06 |
| Oppenheimer | Maintain | Outperform | 2026-02-06 |
| Wedbush | Maintain | Outperform | 2026-02-06 |
| Evercore ISI Group | Maintain | Outperform | 2026-02-06 |
| Argus Research | Maintain | Buy | 2026-02-06 |
| Telsey Advisory Group | Maintain | Outperform | 2026-02-06 |
| Piper Sandler | Maintain | Overweight | 2026-02-06 |
| Citizens | Maintain | Market Outperform | 2026-02-06 |
| RBC Capital | Maintain | Outperform | 2026-02-06 |
| Wells Fargo | Maintain | Overweight | 2026-02-06 |
Alibaba Group Holding Limited Grades
The following table summarizes recent institutional grades for Alibaba Group Holding Limited:
| Grading Company | Action | New Grade | Date |
|---|---|---|---|
| Jefferies | Maintain | Buy | 2026-01-08 |
| Freedom Capital Markets | Downgrade | Hold | 2026-01-06 |
| Bernstein | Maintain | Outperform | 2025-11-26 |
| JP Morgan | Maintain | Overweight | 2025-11-26 |
| Barclays | Maintain | Overweight | 2025-11-26 |
| Citigroup | Maintain | Buy | 2025-11-26 |
| Benchmark | Maintain | Buy | 2025-11-26 |
| Bernstein | Maintain | Outperform | 2025-10-10 |
| JP Morgan | Maintain | Overweight | 2025-10-09 |
| JP Morgan | Maintain | Overweight | 2025-10-01 |
Which company has the best grades?
Amazon.com, Inc. consistently receives high grades, mostly “Outperform” and “Buy,” indicating strong institutional confidence. Alibaba’s grades are generally positive but include a recent downgrade to “Hold,” suggesting some caution. Investors might view Amazon’s grade consistency as a stronger endorsement.
Risks specific to each company
The following categories identify the critical pressure points and systemic threats facing both firms in the 2026 market environment:
1. Market & Competition
Amazon.com, Inc.
- Faces intense competition globally, especially in cloud and retail sectors with high market saturation.
Alibaba Group Holding Limited
- Operates primarily in China with strong domestic competition and growing international challenges.
2. Capital Structure & Debt
Amazon.com, Inc.
- Maintains moderate debt levels with a debt-to-equity ratio of 0.37 and strong interest coverage at 42.78.
Alibaba Group Holding Limited
- Exhibits lower leverage, debt-to-equity at 0.25, and solid interest coverage of 15.39, reflecting prudent financial management.
3. Stock Volatility
Amazon.com, Inc.
- High beta of 1.385 indicates greater stock price sensitivity to market swings and higher volatility risk.
Alibaba Group Holding Limited
- Low beta of 0.39 signals less price volatility and relatively stable stock performance amid market fluctuations.
4. Regulatory & Legal
Amazon.com, Inc.
- Faces regulatory scrutiny in multiple jurisdictions, especially regarding antitrust and data privacy laws.
Alibaba Group Holding Limited
- Confronts significant regulatory pressure from Chinese authorities and ongoing geopolitical tensions impacting compliance.
5. Supply Chain & Operations
Amazon.com, Inc.
- Global supply chain complexity exposes it to disruptions but benefits from robust logistics infrastructure.
Alibaba Group Holding Limited
- Supply chain risks are heightened by regional constraints and dependency on Chinese manufacturing and logistics.
6. ESG & Climate Transition
Amazon.com, Inc.
- Increasing ESG commitments but faces challenges in reducing carbon footprint due to vast operations.
Alibaba Group Holding Limited
- Progressing on ESG fronts with focus on sustainability but transparency and regulatory expectations remain concerns.
7. Geopolitical Exposure
Amazon.com, Inc.
- Exposure to US-China tensions and international trade policies affecting global operations.
Alibaba Group Holding Limited
- High geopolitical risk from Chinese government policies and international trade restrictions impacting business expansion.
Which company shows a better risk-adjusted profile?
Alibaba’s strongest risk is geopolitical exposure, given its reliance on China’s regulatory and political landscape. Amazon’s primary risk lies in stock volatility and regulatory scrutiny across diverse markets. Alibaba’s lower leverage and favorable liquidity ratios improve its risk profile. However, Amazon’s global scale and stronger market position provide resilience despite higher volatility. Recent data show Alibaba’s very strong Piotroski score versus Amazon’s average, reinforcing Alibaba’s superior financial health. Overall, Alibaba offers a better risk-adjusted profile, balancing solid financials against geopolitical pressures.
Final Verdict: Which stock to choose?
Amazon’s superpower lies in its relentless innovation and expanding ecosystem, driving robust profitability and strong returns. However, its valuation multiples demand caution and could pressure future upside. It fits well in aggressive growth portfolios seeking market leaders with expanding margins amid evolving sectors.
Alibaba boasts a sustainable moat through its dominant e-commerce platform and improving capital efficiency. It offers a safer financial profile with solid liquidity and lower leverage than Amazon. Alibaba suits GARP investors targeting steady growth combined with reasonable valuation and improving profitability.
If you prioritize dynamic innovation and margin expansion, Amazon is the compelling choice due to its accelerating ROIC and strong income growth. However, if you seek stability and a proven economic moat with favorable valuation, Alibaba offers better resilience and value creation. Both present distinct strategic scenarios depending on your risk tolerance and growth horizon.
Disclaimer: Investment carries a risk of loss of initial capital. The past performance is not a reliable indicator of future results. Be sure to understand risks before making an investment decision.
Go Further
I encourage you to read the complete analyses of Amazon.com, Inc. and Alibaba Group Holding Limited to enhance your investment decisions: