Home > Comparison > Real Estate > BXP vs ARE
The strategic rivalry between BXP, Inc. and Alexandria Real Estate Equities, Inc. shapes the U.S. office REIT landscape. BXP operates as a fully integrated developer and owner of Class A office properties in major urban centers. In contrast, Alexandria specializes in life science and technology-focused urban campuses, blending real estate with venture capital. This analysis evaluates which business model delivers superior risk-adjusted returns for a diversified portfolio amid evolving market dynamics.

Table of contents
Companies Overview
BXP, Inc. and Alexandria Real Estate Equities, Inc. both command significant positions in the office REIT sector, shaping urban commercial real estate landscapes.
BXP, Inc.: Largest Class A Office Developer
BXP stands as the largest publicly-held developer and owner of Class A office properties in the U.S., focused on five prime markets. Its core revenue derives from leasing and managing 51.2M square feet across 196 properties. In 2026, BXP emphasizes integrated property development and redevelopment to sustain its dominant market position.
Alexandria Real Estate Equities, Inc.: Pioneer in Innovation Campuses
Alexandria specializes in life science, technology, and agtech office campuses clustered in AAA innovation hubs across North America. Its revenue streams come from leasing dynamic Class A spaces and strategic capital investments. The firm’s 2026 strategy centers on expanding its footprint in key urban clusters while enhancing tenant productivity through collaborative environments.
Strategic Collision: Similarities & Divergences
Both firms operate as office REITs with a focus on Class A properties, yet BXP targets broad urban centers while Alexandria specializes in niche innovation ecosystems. Their primary battleground is attracting high-quality tenants in competitive metropolitan markets. Alexandria offers a more specialized investment profile, while BXP provides diversified exposure to premier office real estate.
Income Statement Comparison
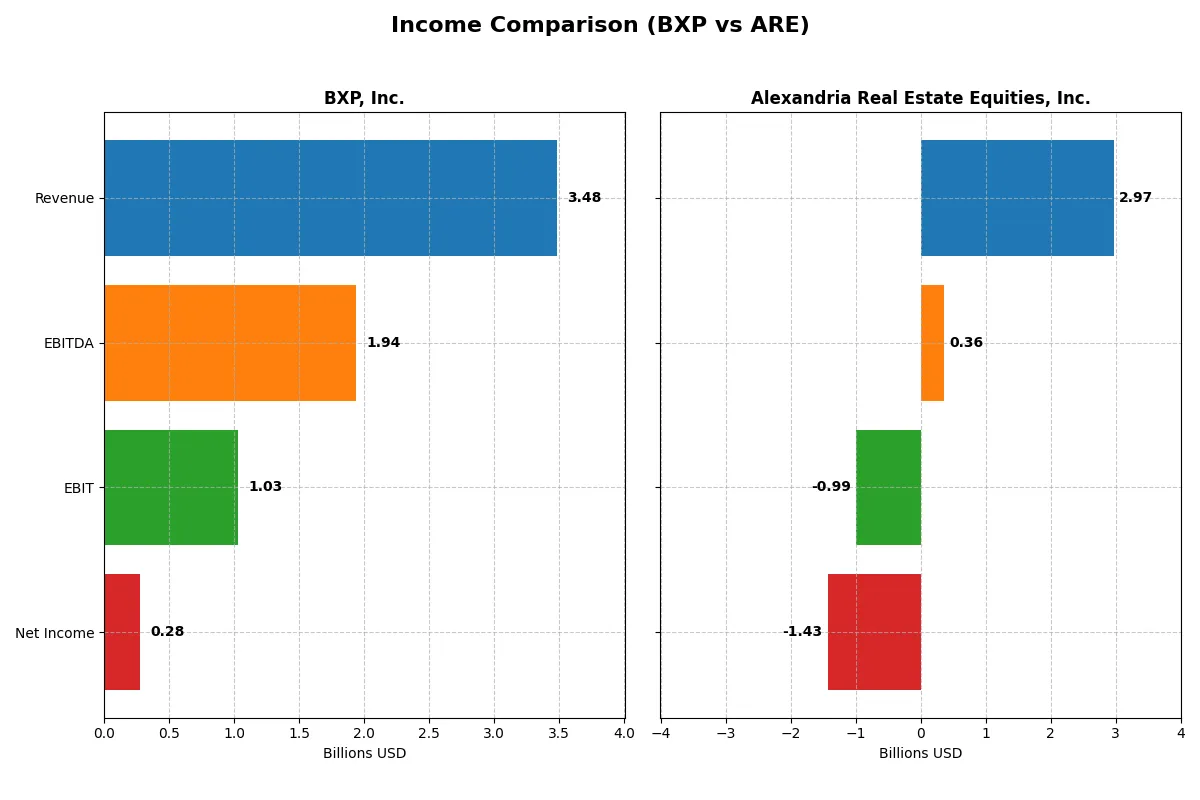
This data dissects the core profitability and scalability of both corporate engines to reveal who dominates the bottom line in the most recent fiscal year:
| Metric | BXP, Inc. (BXP) | Alexandria Real Estate Equities, Inc. (ARE) |
|---|---|---|
| Revenue | 3.48B | 2.97B |
| Cost of Revenue | 1.37B | 923M |
| Operating Expenses | 169M | 3.25B |
| Gross Profit | 2.11B | 2.05B |
| EBITDA | 1.94B | 360M |
| EBIT | 1.03B | -990M |
| Interest Expense | 648M | 227M |
| Net Income | 277M | -1.43B |
| EPS | 1.75 | -8.44 |
| Fiscal Year | 2025 | 2025 |
Income Statement Analysis: The Bottom-Line Duel
This income statement comparison reveals which company operates its core business with superior profitability and efficiency.
BXP, Inc. Analysis
BXP’s revenue grew steadily from 2.9B in 2021 to 3.48B in 2025, showing solid top-line momentum. Net income fluctuated, peaking at 848M in 2022 but dropping sharply to 277M in 2025. Gross margins hold firm around 60.5%, while net margins improved to 7.95%, reflecting enhanced operational efficiency despite rising interest expenses.
Alexandria Real Estate Equities, Inc. Analysis
ARE’s revenue increased from 2.1B in 2021 to a 2025 peak of 3B but declined slightly in the latest year. Gross margin remains strong at 68.9%, yet EBIT and net margins turned sharply negative in 2025, with net income plunging to -1.43B. This signals significant operational and profitability challenges despite healthy top-line scale.
Margin Resilience vs. Profitability Collapse
BXP demonstrates stronger profitability with positive EBIT and net margins, while ARE struggles with heavy losses despite superior gross margins. BXP’s ability to sustain earnings amid rising costs marks it as the fundamental winner. Investors seeking stable profit generation will find BXP’s profile more attractive than ARE’s volatile bottom line.
Financial Ratios Comparison
These vital ratios act as a diagnostic tool to expose the underlying fiscal health, valuation premiums, and capital efficiency of the companies analyzed:
| Ratios | BXP, Inc. (BXP) | Alexandria Real Estate Equities, Inc. (ARE) |
|---|---|---|
| ROE | 0.26% | -9.25% |
| ROIC | 4.01% | -3.73% |
| P/E | 820.4 | -5.83 |
| P/B | 2.16 | 0.54 |
| Current Ratio | 2.56 | 0.43 |
| Quick Ratio | 2.56 | 0.43 |
| D/E | 3.20 | 0.82 |
| Debt-to-Assets | 66.4% | 37.4% |
| Interest Coverage | 1.58 | -5.30 |
| Asset Turnover | 0.13 | 0.09 |
| Fixed Asset Turnover | 4.82 | 2.69 |
| Payout ratio | 48.3% | -63.7% |
| Dividend yield | 5.89% | 10.93% |
| Fiscal Year | 2024 | 2025 |
Efficiency & Valuation Duel: The Vital Signs
Ratios act as a company’s DNA, exposing hidden risks and operational excellence behind headline numbers.
BXP, Inc.
BXP’s profitability remains weak, with ROE at 0.26% and net margin at 0.42%, signaling operational challenges. The stock trades at a stretched P/E of 820, suggesting overvaluation. However, a solid 5.89% dividend yield provides shareholder returns, balancing modest growth reinvestment against a cautious capital allocation stance.
Alexandria Real Estate Equities, Inc.
ARE posts negative profitability metrics: ROE at -9.25% and a -48.15% net margin, reflecting distress. The valuation appears attractive with a negative P/E and low P/B of 0.54, implying market skepticism. Despite poor earnings, ARE offers a high 10.93% dividend yield, signaling reliance on income over growth reinvestment.
Premium Valuation vs. Income Reliance
BXP’s expensive valuation contrasts with weak profitability, while ARE’s cheap valuation masks operational losses. BXP balances risk with steady dividends, suiting income-focused investors. ARE’s profile fits those seeking high yield amid financial uncertainty, accepting elevated risk for income potential.
Which one offers the Superior Shareholder Reward?
I compare BXP, Inc. and Alexandria Real Estate Equities, Inc. based on their dividend yields, payout ratios, and share buybacks. BXP yields 5.9% with a 48% payout ratio, showing solid free cash flow coverage and consistent dividends. Its buybacks support total returns sustainably. ARE offers a higher 10.9% yield but shows negative net margins and volatile earnings, with a negative payout ratio indicating dividend risks. ARE lacks capital expenditure, relying heavily on free cash flow; buyback data is limited. Historically, BXP’s balanced payout and buybacks align better with long-term value creation. I judge BXP superior for sustainable shareholder rewards in 2026.
Comparative Score Analysis: The Strategic Profile
The radar chart reveals the fundamental DNA and trade-offs of both firms, illustrating their core financial strengths and weaknesses:
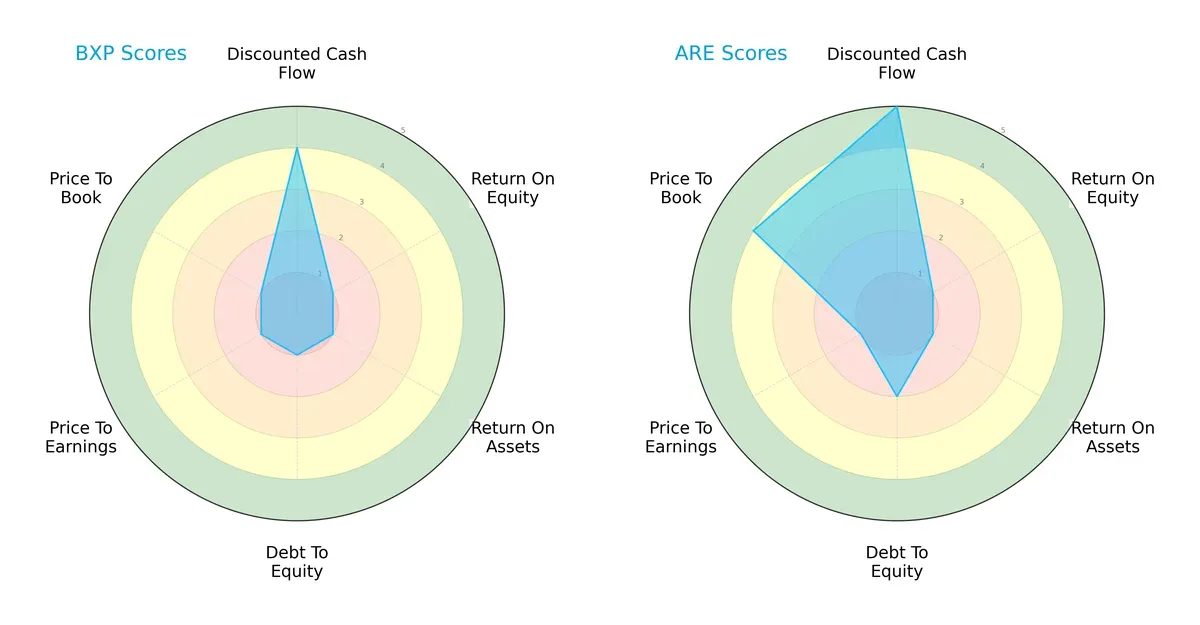
BXP leans heavily on discounted cash flow, scoring a 4, but lags severely in ROE, ROA, leverage, and valuation metrics, all rated very unfavorable at 1. ARE shows a more balanced profile, excelling in DCF with a perfect 5 and price-to-book at 4, while maintaining moderate debt-to-equity discipline. ARE’s diversified strengths contrast with BXP’s reliance on cash flow projections.
Bankruptcy Risk: Solvency Showdown
Both companies reside in the distress zone by Altman Z-Score standards, signaling heightened bankruptcy risk in this cycle:
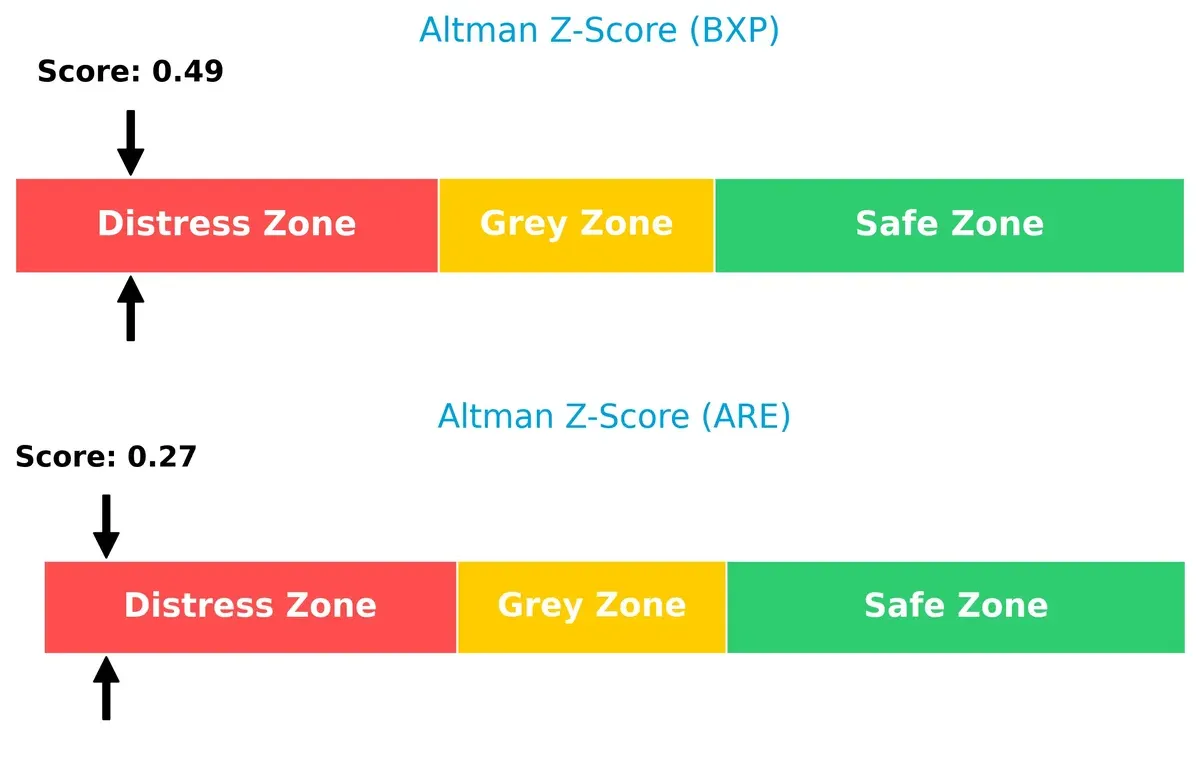
BXP posts a 0.49, slightly outperforming ARE’s 0.27, but neither score approaches the safe zone threshold of 3. This implies both face serious solvency challenges amid current market headwinds.
Financial Health: Quality of Operations
ARE demonstrates stronger operational health with a Piotroski F-Score of 7, surpassing BXP’s average score of 5, indicating superior internal financial quality:
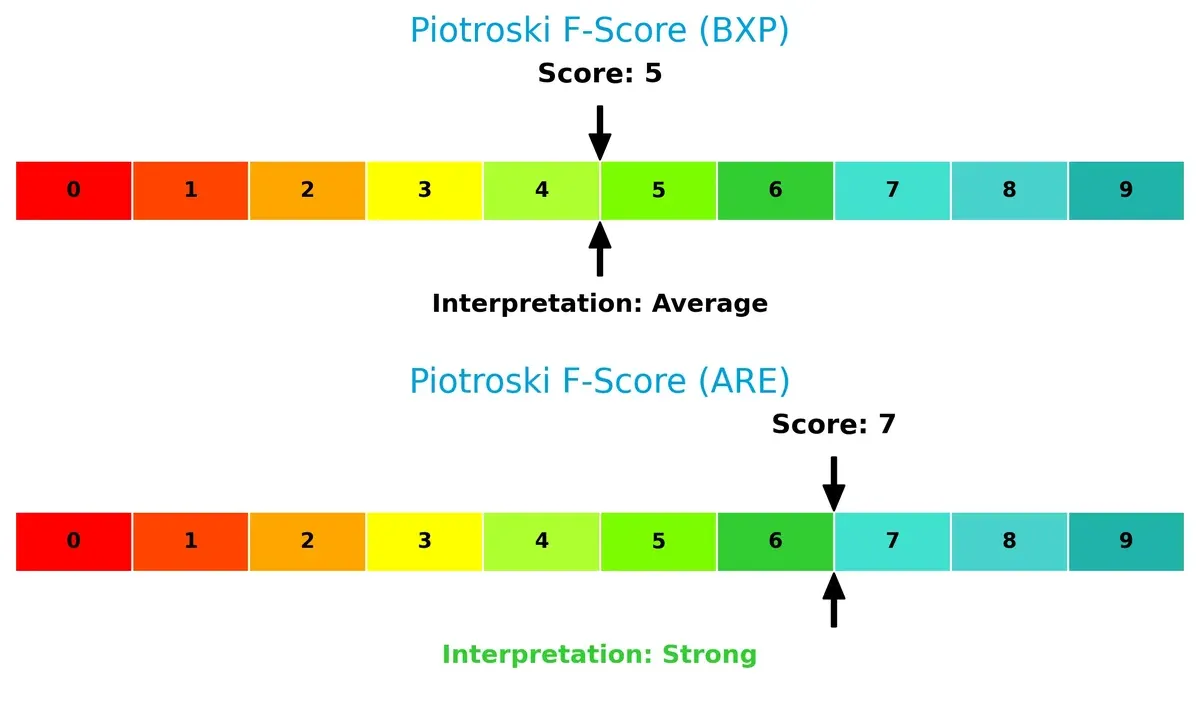
ARE’s higher score reflects better profitability, liquidity, and efficiency metrics. BXP’s middling score raises caution flags on its internal fundamentals compared to ARE’s robust profile.
How are the two companies positioned?
This section dissects BXP and ARE’s operational DNA by comparing their revenue distribution and internal dynamics. The goal is to confront their economic moats and identify which model offers a more resilient, sustainable competitive advantage today.
Revenue Segmentation: The Strategic Mix
This comparison dissects how BXP, Inc. and Alexandria Real Estate Equities, Inc. diversify their income streams and reveals where their primary sector bets lie:
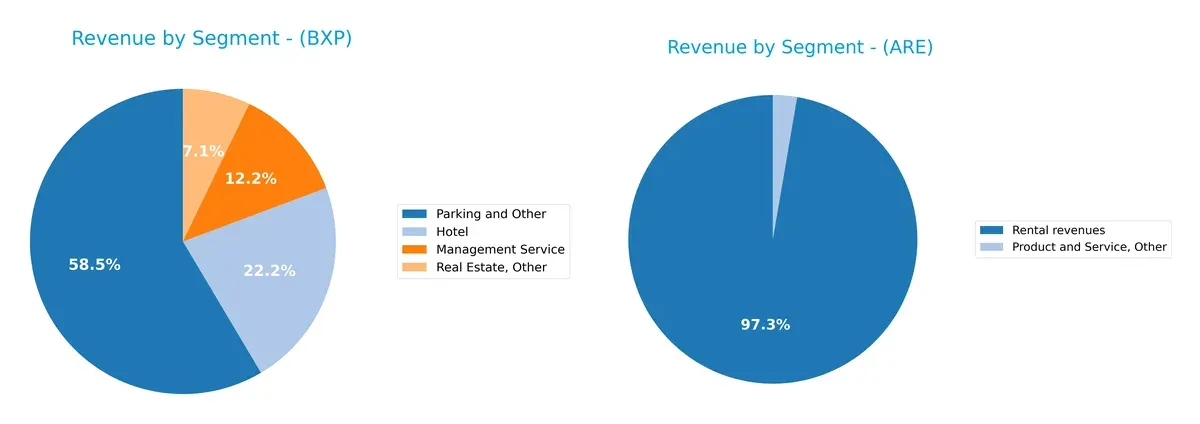
BXP’s 2024 revenue centers on Parking and Other at $135M, dwarfing its Hotel ($51M) and Management Service ($28M) segments, signaling a moderate mix with concentration risk in ancillary services. Alexandria Real Estate Equities anchors its revenue at $3B in Rental revenues, with Product and Service, Other at just $67M, showing a highly concentrated model focused on core real estate leasing dominance.
Strengths and Weaknesses Comparison
This table compares the Strengths and Weaknesses of BXP and ARE based on diversification, profitability, financials, innovation, global presence, and market share:
BXP Strengths
- Diverse revenue streams across management services, hotel, parking, and real estate
- Strong current and quick ratios at 2.56 indicating liquidity
- Favorable WACC at 4.72% supports capital efficiency
- High fixed asset turnover of 4.82 shows asset use efficiency
ARE Strengths
- Favorable WACC at 5.83% reflects cost-effective capital
- Low price-to-book ratio at 0.54 suggests undervaluation
- Broad rental revenue base at 2.95B USD supports scale
- Neutral debt-to-assets ratio at 37.44% indicates moderate leverage
BXP Weaknesses
- Unfavorable net margin (0.42%) and ROE (0.26%) highlight weak profitability
- High debt-to-equity of 3.2 and debt-to-assets at 66.41% imply high leverage risk
- Low interest coverage of 1.59 signals potential difficulty servicing debt
- Extremely high P/E of 820.44 questions valuation
- Low asset turnover at 0.13 indicates inefficient asset use
ARE Weaknesses
- Negative net margin (-48.15%) and ROE (-9.25%) show significant losses
- Negative ROIC (-3.73%) implies capital destruction
- Poor liquidity with current and quick ratios at 0.43 raise solvency concerns
- Negative interest coverage (-4.37) warns of financial distress
- Low asset turnover at 0.09 reflects operational inefficiency
BXP shows strength in liquidity and asset turnover but faces profitability and leverage challenges. ARE’s capital cost is favorable, but profitability and liquidity are weak. Both companies must address operational efficiency and financial risks to improve competitiveness.
The Moat Duel: Analyzing Competitive Defensibility
A structural moat shields long-term profits from relentless competition erosion. Without it, market share and margins quickly erode:
BXP, Inc.: Location-Based Scale Moat
BXP leverages its dominant presence in top U.S. office markets like Boston and New York. This scale delivers margin stability, yet declining ROIC signals weakening value creation in 2026.
Alexandria Real Estate Equities, Inc.: Niche Innovation Ecosystem Moat
ARE’s moat stems from its focus on life science and tech campuses, creating a unique tenant ecosystem. However, a steep ROIC decline limits its capacity to sustain premium returns this year.
Scale Footprint vs. Specialized Ecosystem: The Moat Showdown
Both firms suffer value destruction with negative ROIC spreads versus WACC. BXP’s broad urban footprint offers a wider moat, while ARE’s niche focus yields a deeper but currently vulnerable moat. BXP stands better poised to defend market share amid sector headwinds.
Which stock offers better returns?
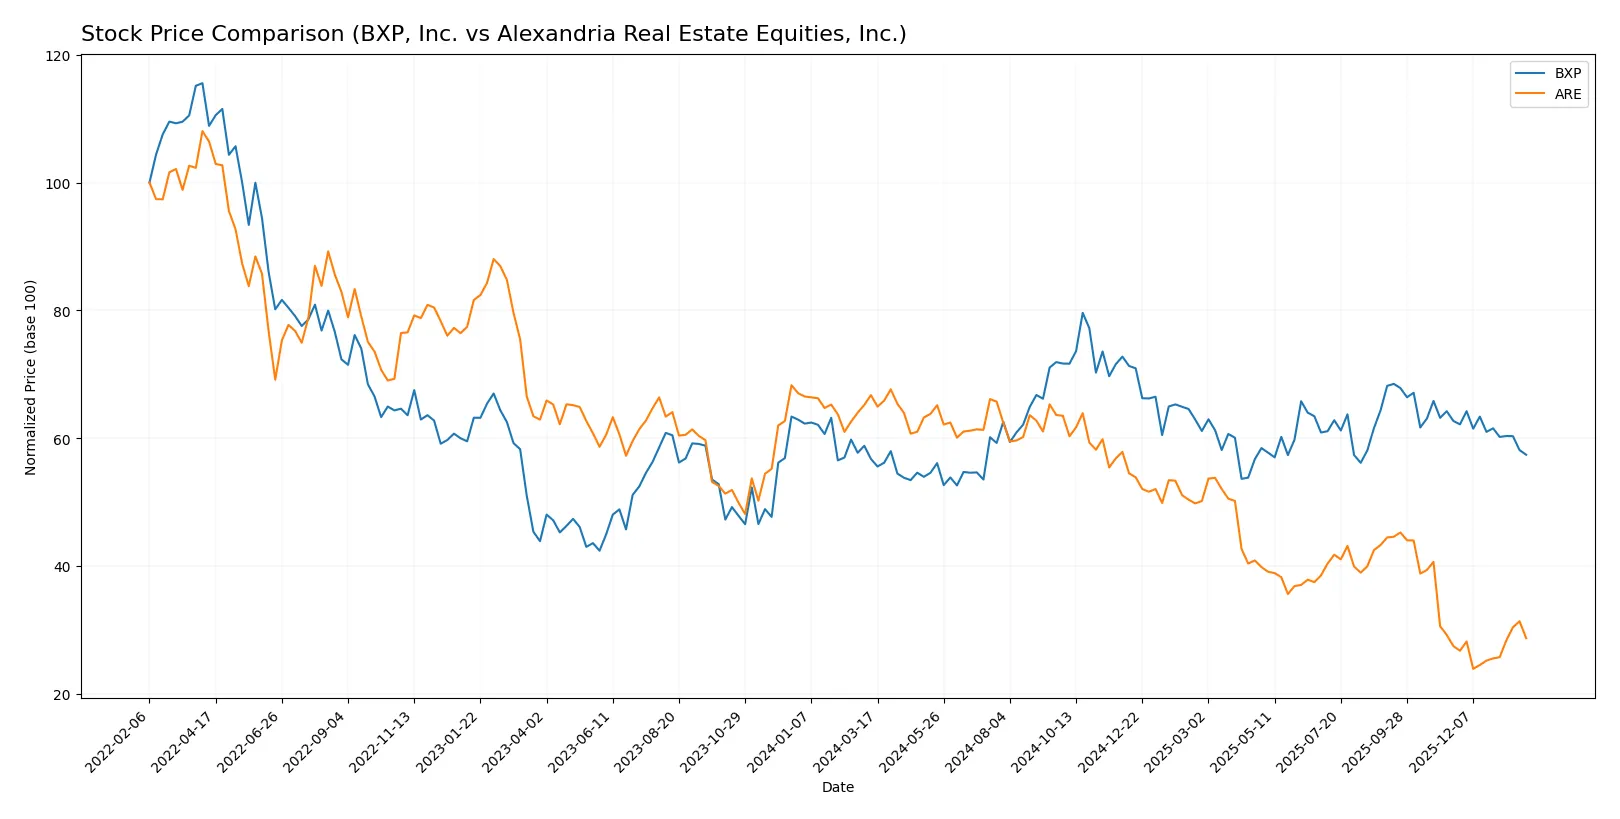
Over the past 12 months, BXP, Inc. showed moderate upward pressure with a slight deceleration, while Alexandria Real Estate Equities, Inc. experienced a sharp decline followed by recent signs of recovery.
Trend Comparison
BXP’s stock price increased by 1.14% over the last year, indicating a mild bullish trend with decelerating momentum and a high-low range from 59.26 to 89.72.
ARE’s stock price fell 57.03% in the same period, marking a strong bearish trend but with accelerating downward momentum and recent upward movement of 4.49%.
Comparing both, BXP delivered the highest market performance over the past year despite ARE’s recent partial rebound.
Target Prices
Analysts provide a mixed but generally positive outlook for these REITs, with upside potential from current prices.
| Company | Target Low | Target High | Consensus |
|---|---|---|---|
| BXP, Inc. | 70 | 85 | 78 |
| Alexandria Real Estate Equities, Inc. | 45 | 82 | 58.25 |
BXP’s consensus target of $78 suggests roughly 20% upside from its current $64.67 price. Alexandria’s $58.25 target implies modest gains above its $54.64 market price.

Don’t Let Luck Decide Your Entry Point
Optimize your entry points with our advanced ProRealTime indicators. You’ll get efficient buy signals with precise price targets for maximum performance. Start outperforming now!
How do institutions grade them?
The institutional grades for BXP, Inc. and Alexandria Real Estate Equities, Inc. are summarized below:
BXP, Inc. Grades
The following table lists recent grades from reputable grading companies for BXP, Inc.:
| Grading Company | Action | New Grade | Date |
|---|---|---|---|
| Cantor Fitzgerald | Maintain | Overweight | 2026-01-29 |
| Evercore ISI Group | Maintain | In Line | 2026-01-29 |
| Barclays | Maintain | Overweight | 2026-01-23 |
| Scotiabank | Maintain | Sector Perform | 2026-01-14 |
| JP Morgan | Maintain | Overweight | 2026-01-13 |
| Barclays | Upgrade | Overweight | 2026-01-13 |
| UBS | Maintain | Neutral | 2026-01-08 |
| Citigroup | Maintain | Neutral | 2026-01-07 |
| Mizuho | Maintain | Outperform | 2025-12-12 |
| Keybanc | Upgrade | Overweight | 2025-12-04 |
Alexandria Real Estate Equities, Inc. Grades
The following table lists recent grades from reputable grading companies for Alexandria Real Estate Equities, Inc.:
| Grading Company | Action | New Grade | Date |
|---|---|---|---|
| JP Morgan | Maintain | Neutral | 2026-01-14 |
| Jefferies | Maintain | Hold | 2025-12-16 |
| Evercore ISI Group | Maintain | Outperform | 2025-12-04 |
| Citigroup | Maintain | Neutral | 2025-12-04 |
| BMO Capital | Maintain | Outperform | 2025-12-04 |
| Baird | Maintain | Outperform | 2025-12-04 |
| Evercore ISI Group | Maintain | Outperform | 2025-11-28 |
| Baird | Maintain | Outperform | 2025-11-26 |
| Citizens | Downgrade | Market Perform | 2025-11-13 |
| Citigroup | Maintain | Neutral | 2025-11-03 |
Which company has the best grades?
BXP, Inc. holds a higher concentration of “Overweight” and “Outperform” ratings, often coupled with upgrades. Alexandria Real Estate Equities, Inc. has mainly “Outperform” and “Neutral” grades, with one notable downgrade. This suggests BXP currently attracts stronger institutional confidence, potentially indicating better perceived growth or risk profiles.
Risks specific to each company
The following categories identify critical pressure points and systemic threats facing BXP, Inc. and Alexandria Real Estate Equities, Inc. in the 2026 market environment:
1. Market & Competition
BXP, Inc.
- Largest publicly-held Class A office REIT, focused on five major U.S. markets; faces intense competition in traditional office space.
Alexandria Real Estate Equities, Inc.
- Pioneer in urban life science and technology campuses; niche focus creates competitive moat but limits diversification.
2. Capital Structure & Debt
BXP, Inc.
- High debt-to-equity ratio of 3.2 signals elevated leverage risk; interest coverage at 1.59 is weak, raising default concerns.
Alexandria Real Estate Equities, Inc.
- Moderate leverage with debt-to-equity at 0.82; however, negative interest coverage (-4.37) indicates distress servicing debt.
3. Stock Volatility
BXP, Inc.
- Beta near 1.03 suggests stock moves roughly in line with market; price range between $54.22–$79.33 shows moderate volatility.
Alexandria Real Estate Equities, Inc.
- Higher beta of 1.32 signals above-market volatility; wide price range $44.10–$105.14 reflects significant investor uncertainty.
4. Regulatory & Legal
BXP, Inc.
- Operates in heavily regulated office real estate markets; possible exposure to zoning and environmental compliance risks.
Alexandria Real Estate Equities, Inc.
- Faces complex regulations in biotech and tech campuses; increased scrutiny on tenant operations may elevate legal risks.
5. Supply Chain & Operations
BXP, Inc.
- Relies on established markets and ongoing construction projects; operational efficiency challenged by asset turnover below industry average.
Alexandria Real Estate Equities, Inc.
- Development-heavy portfolio in innovation clusters demands sophisticated supply chain management; fixed asset turnover moderate.
6. ESG & Climate Transition
BXP, Inc.
- Pressure to modernize aging office buildings for energy efficiency; climate risks in coastal markets could impact asset values.
Alexandria Real Estate Equities, Inc.
- Strong ESG focus aligning with innovation sectors; potential advantage but ongoing investment needed to meet evolving standards.
7. Geopolitical Exposure
BXP, Inc.
- Concentrated in U.S. urban centers; geopolitical risks limited but subject to domestic policy shifts affecting commercial real estate.
Alexandria Real Estate Equities, Inc.
- Also U.S.-focused but with tenants in sensitive biotech fields; regulatory changes and trade policies could indirectly impact operations.
Which company shows a better risk-adjusted profile?
BXP’s most impactful risk lies in its high leverage and weak interest coverage, raising solvency concerns amid low returns. Alexandria’s critical vulnerability is its negative profitability and interest coverage, signaling operational distress despite niche leadership. Alexandria’s stronger Piotroski score and moderate leverage imply a marginally better risk-adjusted profile, yet both companies remain in financial distress zones. Notably, BXP’s debt load at 3.2x equity contrasts sharply with Alexandria’s 0.82x, underscoring my concern over BXP’s balance sheet fragility despite its larger market cap.
Final Verdict: Which stock to choose?
BXP, Inc. stands out for its robust liquidity and disciplined capital allocation, showcasing a resilient cash conversion machine. Its key point of vigilance is the high leverage and declining profitability, signaling pressure on long-term value creation. BXP suits investors targeting aggressive growth with a tolerance for operational risks.
Alexandria Real Estate Equities, Inc. benefits from a strategic moat rooted in its specialized life sciences real estate niche, providing recurring revenue stability. Despite a weaker short-term liquidity profile and profitability challenges, it offers better financial conservatism relative to BXP. ARE fits portfolios focused on growth at a reasonable price with moderate risk appetite.
If you prioritize resilient cash flow and operational efficiency, BXP is the compelling choice due to its superior liquidity and growth trajectory. However, if you seek sector-specific moat and more conservative balance sheet dynamics, ARE offers better stability despite recent earnings setbacks. Both require careful risk management given their value-destroying ROIC trends.
Disclaimer: Investment carries a risk of loss of initial capital. The past performance is not a reliable indicator of future results. Be sure to understand risks before making an investment decision.
Go Further
I encourage you to read the complete analyses of BXP, Inc. and Alexandria Real Estate Equities, Inc. to enhance your investment decisions: