Home > Comparison > Consumer Defensive > KR vs ACI
The strategic rivalry between The Kroger Co. and Albertsons Companies, Inc. shapes the U.S. grocery sector’s competitive landscape. Kroger operates as a sprawling retailer with diverse store formats, including food, drug, and multi-department stores, while Albertsons focuses on a broad grocery and pharmacy network with extensive manufacturing and distribution. This analysis explores their contrasting operational models and growth strategies to identify which company offers a superior risk-adjusted return for a diversified portfolio.
Table of contents
Companies Overview
The Kroger Co. and Albertsons Companies, Inc. stand as major players in the U.S. grocery retail sector, shaping consumer access and preferences.
The Kroger Co.: Leading Multiformat Retailer
The Kroger Co. dominates as a multi-format grocer with 2,726 stores across 35 states. Its core revenue derives from diverse store types—food and drug, multi-department, marketplaces, and price impact warehouses—offering everything from organic produce to apparel. In 2022, Kroger emphasized expanding its fuel centers and food manufacturing, reinforcing its vertical integration and broad customer reach.
Albertsons Companies, Inc.: Expansive Food and Drug Retailer
Albertsons operates 2,276 stores nationwide, focusing on grocery, pharmacy, fuel, and in-store services like branded coffee shops. Its revenue engine hinges on retail sales complemented by manufacturing and digital platforms. In 2022, Albertsons prioritized scaling its pharmacy network and enhancing digital engagement, aiming to deepen customer loyalty and convenience.
Strategic Collision: Similarities & Divergences
Both companies commit to integrated food retailing with manufacturing arms, but Kroger leverages a wider store format variety and fuel retailing, contrasting Albertsons’ emphasis on pharmacy and digital expansion. Their primary battleground lies in capturing market share through omnichannel growth and shopper experience. Investors face distinct profiles: Kroger’s broad diversification versus Albertsons’ focused service enhancements create different risk-reward dynamics.
Income Statement Comparison
This data dissects the core profitability and scalability of both corporate engines to reveal who dominates the bottom line:
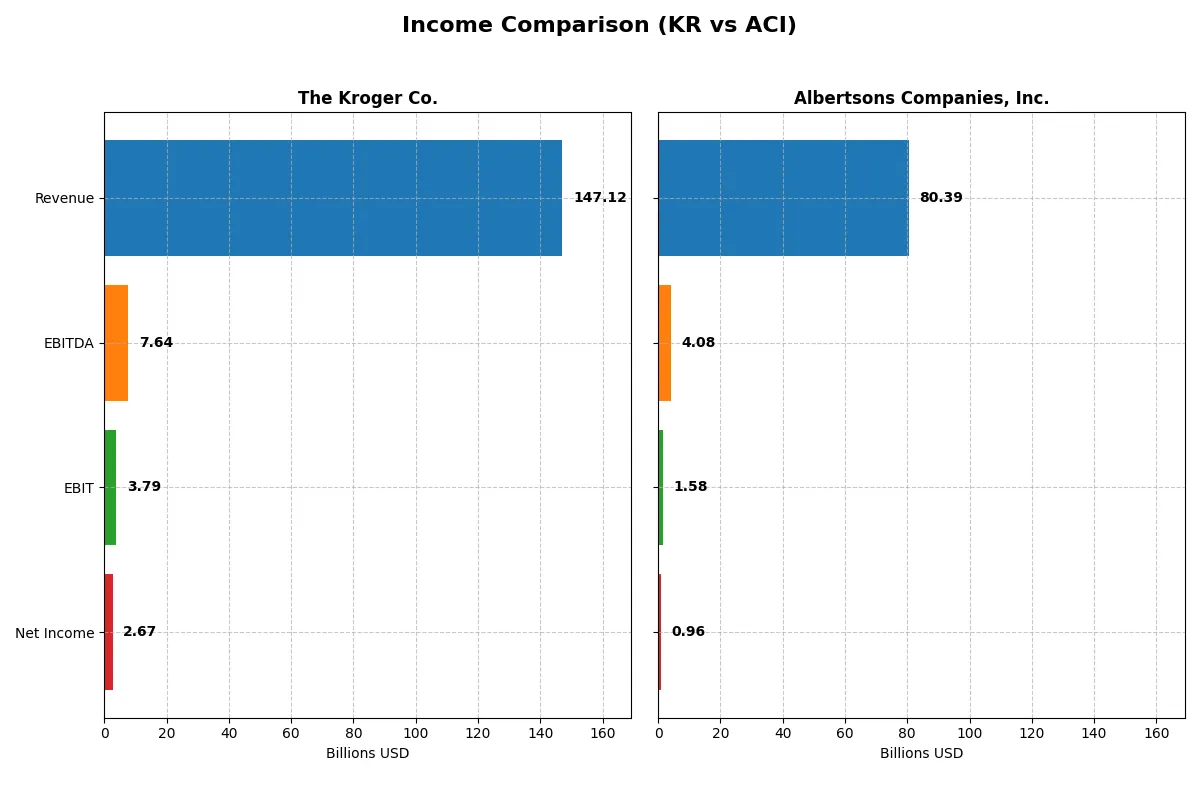
| Metric | The Kroger Co. (KR) | Albertsons Companies, Inc. (ACI) |
|---|---|---|
| Revenue | 147.1B | 80.4B |
| Cost of Revenue | 113.7B | 58.1B |
| Operating Expenses | 29.6B | 20.7B |
| Gross Profit | 33.4B | 22.3B |
| EBITDA | 7.6B | 4.1B |
| EBIT | 3.8B | 1.6B |
| Interest Expense | 459M | 470M |
| Net Income | 2.7B | 959M |
| EPS | 3.7 | 1.65 |
| Fiscal Year | 2024 | 2024 |
Income Statement Analysis: The Bottom-Line Duel
This income statement comparison uncovers which company operates with superior efficiency and sustainable profitability in a competitive sector.
The Kroger Co. Analysis
Kroger’s revenue slightly declined to 147B in 2024 from 150B in 2023, but net income grew robustly to 2.65B. Its gross margin remains stable at 22.7%, a favorable indicator of cost control. Kroger’s net margin improved by 25.6% year-over-year, showing strong momentum in profitability despite a mild revenue dip.
Albertsons Companies, Inc. Analysis
Albertsons increased revenue modestly to 80.4B in 2024 from 79.2B in 2023, yet net income fell sharply to 959M. The company maintains a higher gross margin at 27.7%, reflecting efficient production or pricing power. However, EBIT and net margin both contracted significantly, signaling challenges in converting sales growth into profits.
Margin Strength vs. Earnings Momentum
Kroger leads with stronger bottom-line growth and improved net margins despite flat revenue. Albertsons shows better gross margins but struggles with profitability erosion. Investors seeking earnings momentum and margin stability will find Kroger’s profile more compelling given its recent operational improvements.
Financial Ratios Comparison
These vital ratios act as a diagnostic tool to expose the underlying fiscal health, valuation premiums, and capital efficiency of the companies compared below:
| Ratios | The Kroger Co. (KR) | Albertsons Companies, Inc. (ACI) |
|---|---|---|
| ROE | 32.2% | 28.3% |
| ROIC | 8.2% | 5.7% |
| P/E | 16.5 | 12.4 |
| P/B | 5.32 | 3.52 |
| Current Ratio | 0.96 | 0.90 |
| Quick Ratio | 0.52 | 0.22 |
| D/E | 3.03 | 4.19 |
| Debt-to-Assets | 47.7% | 48.4% |
| Interest Coverage | 8.39 | 3.29 |
| Asset Turnover | 2.80 | 2.74 |
| Fixed Asset Turnover | 4.52 | 5.04 |
| Payout ratio | 33.1% | 30.8% |
| Dividend yield | 2.00% | 2.48% |
| Fiscal Year | 2024 | 2024 |
Efficiency & Valuation Duel: The Vital Signs
Financial ratios serve as a company’s DNA, unveiling hidden risks and operational strengths essential for investment decisions.
The Kroger Co.
Kroger displays strong profitability with a 32.17% ROE, signaling efficient capital use. Its P/E of 16.54 and P/B at 5.32 suggest a fairly valued but somewhat stretched stock. The company returns value through a 2.0% dividend yield, balancing shareholder payouts with reinvestment for growth.
Albertsons Companies, Inc.
Albertsons achieves a robust 28.31% ROE with a more attractive P/E of 12.44, indicating a cheaper valuation relative to earnings. Despite a higher debt-to-equity ratio, it maintains a 2.48% dividend yield, highlighting a shareholder-friendly approach while navigating operational challenges.
Balanced Profitability Meets Valuation Discipline
Both companies exhibit slightly favorable ratio profiles, yet Kroger’s superior ROE contrasts with Albertsons’ more appealing valuation and dividend yield. Kroger suits investors prioritizing operational efficiency; Albertsons fits those seeking value with consistent income.
Which one offers the Superior Shareholder Reward?
I compare The Kroger Co. (KR) and Albertsons Companies, Inc. (ACI) on dividends and buybacks. Kroger yields 2.0% with a 33% payout ratio, supported by 30% FCF coverage, indicating a balanced, sustainable distribution. Albertsons offers slightly higher yield near 2.5%, but with more volatile payouts and thinner FCF coverage under 28%. Kroger’s modest buybacks complement dividends, while Albertsons’ aggressive leverage (debt/equity >4) limits buyback capacity and risks sustainability. I see Kroger’s disciplined capital allocation as the superior total return profile for 2026 investors.
Comparative Score Analysis: The Strategic Profile
The radar chart reveals the fundamental DNA and trade-offs of The Kroger Co. and Albertsons Companies, Inc., highlighting their financial strengths and valuation dynamics:
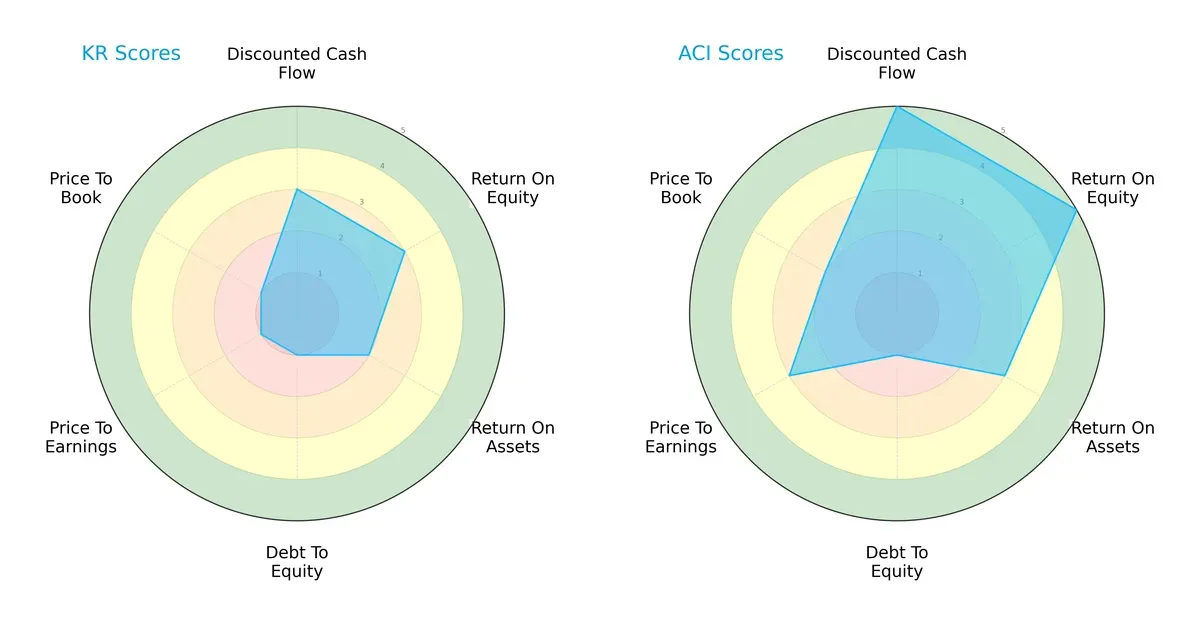
Albertsons leads with a stronger discounted cash flow (DCF) and return on equity (ROE), scoring 5 in both, compared to Kroger’s moderate 3s. Kroger’s return on assets (ROA) lags slightly at 2 versus Albertsons’ 3. Both share a very unfavorable debt-to-equity score of 1, signaling elevated leverage risks. Valuation metrics favor Albertsons with moderate price-to-earnings (3) and price-to-book (2) scores, while Kroger scores poorly (1) on both. Albertsons presents a more balanced financial profile. Kroger relies heavily on operational efficiency but struggles on valuation and leverage fronts.
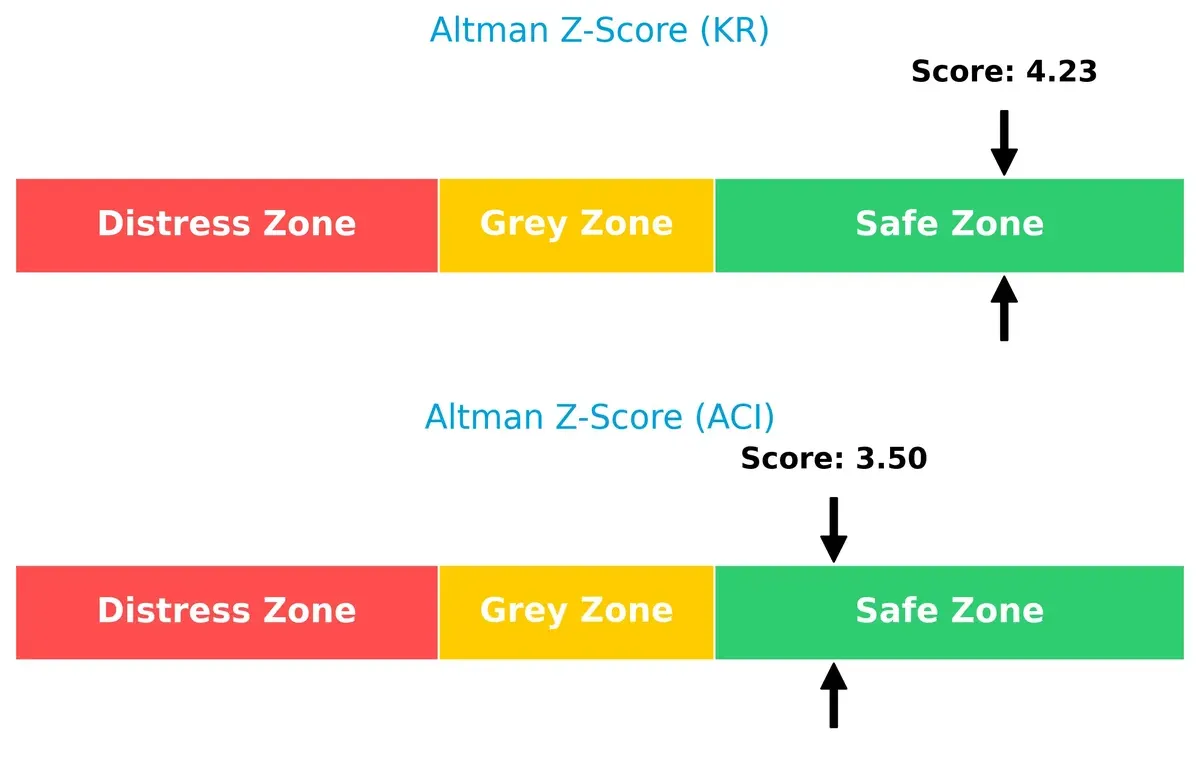
Bankruptcy Risk: Solvency Showdown
Albertsons’ Altman Z-Score of 3.5 versus Kroger’s 4.2 indicates both firms sit comfortably in the safe zone, though Kroger shows a slightly stronger buffer against bankruptcy risk in this cycle:
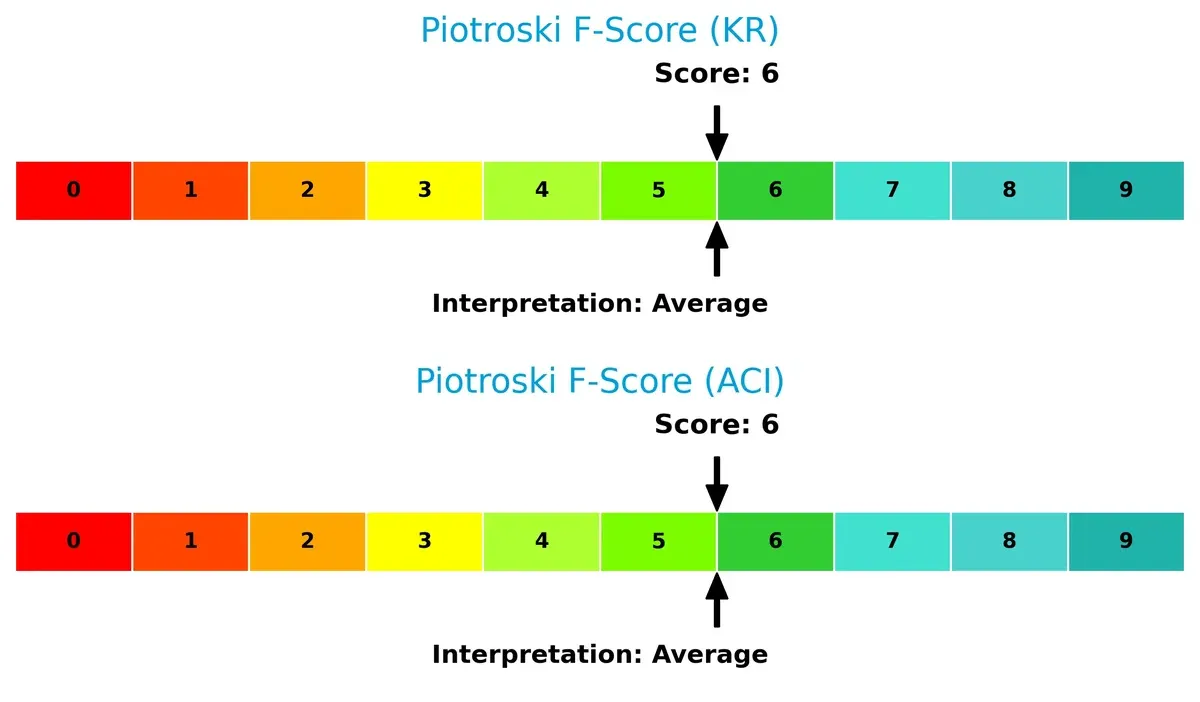
Financial Health: Quality of Operations
Both companies have identical Piotroski F-Scores of 6, indicating average financial health with no glaring red flags. Their internal metrics suggest stable but not peak operational performance:
How are the two companies positioned?
This section dissects the operational DNA of Kroger and Albertsons by comparing their revenue distribution by segment and analyzing their internal strengths and weaknesses. The goal is to confront their economic moats to identify which model delivers the most resilient and sustainable competitive advantage today.
Revenue Segmentation: The Strategic Mix
The following comparison breaks down how The Kroger Co. and Albertsons diversify their revenue streams, highlighting each firm’s core sector strengths and strategic priorities:
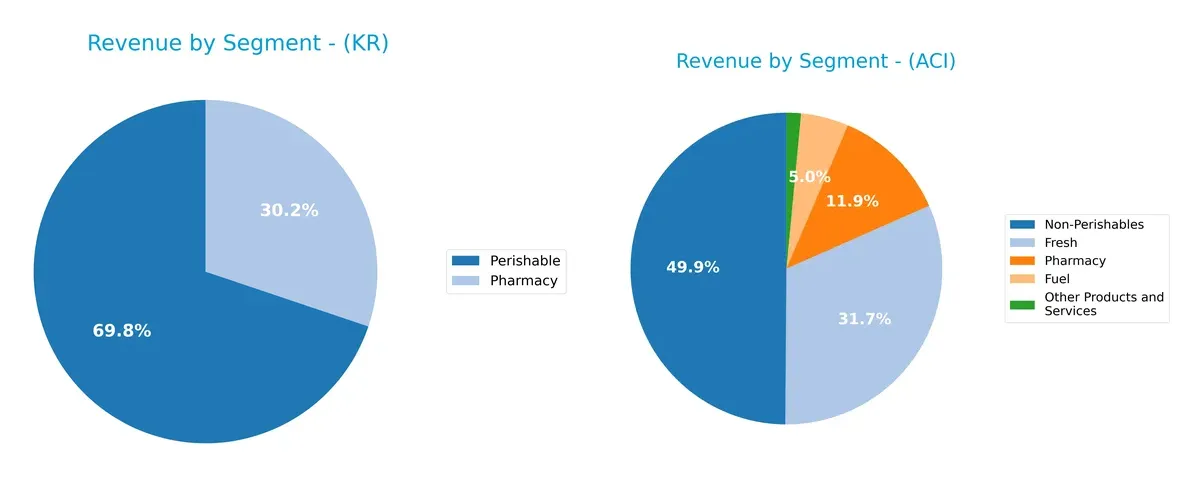
Kroger anchors its revenue in Non Perishable goods, generating $77B in 2023, dwarfs Albertsons’ $40B in Non-Perishables. Albertsons balances its mix more evenly, with $25.5B Fresh and $9.6B Pharmacy segments. Kroger’s high concentration in Non Perishables risks sector dependence but leverages scale and supply chain moats. Albertsons pivots on a diversified base, reducing concentration risk but facing margin pressure across segments.
Strengths and Weaknesses Comparison
This table compares the Strengths and Weaknesses of The Kroger Co. and Albertsons Companies, Inc.:
The Kroger Co. Strengths
- Strong ROE at 32.17% indicates efficient equity use
- Favorable WACC at 5.32% supports profitable capital allocation
- High asset and fixed asset turnover show operational efficiency
- Solid dividend yield at 2.0% rewards shareholders
Albertsons Companies Strengths
- Favorable ROE at 28.31% reflects good equity profitability
- Lower WACC at 3.92% reduces capital costs
- Higher fixed asset turnover at 5.04 suggests asset productivity
- Higher dividend yield at 2.48% provides attractive income
- Favorable P/E at 12.44 implies relatively lower valuation
The Kroger Co. Weaknesses
- Low net margin at 1.81% limits profitability
- Unfavorable current and quick ratios indicate liquidity concerns
- High debt-to-equity at 3.03 raises leverage risk
- Unfavorable price-to-book ratio at 5.32 signals potential overvaluation
Albertsons Companies Weaknesses
- Lower net margin at 1.19% weakens earnings
- Very low quick ratio at 0.22 signals liquidity risks
- Higher debt-to-equity at 4.19 increases financial risk
- Neutral interest coverage at 3.37 may pressure debt service
- Unfavorable price-to-book ratio at 3.52 suggests valuation risk
Both companies show slightly favorable financial profiles with efficient use of equity and assets. However, liquidity and leverage metrics highlight notable risks. Their strategies must balance growth and risk management to sustain market positions.
The Moat Duel: Analyzing Competitive Defensibility
A structural moat is the only true shield preserving long-term profits from relentless competition erosion. Let’s dissect the moats of two grocery giants:
The Kroger Co.: Operational Excellence and Scale Moat
Kroger’s moat stems from scale and operational efficiency. It boasts a very favorable ROIC 2.9% above WACC and improving profitability. Kroger’s integrated supply chain and diverse store formats fortify margin stability. In 2026, expansion into fresh and organic markets deepens this moat.
Albertsons Companies, Inc.: Margin Focus Amid Structural Challenges
Albertsons relies on cost advantage but lags Kroger in value creation, with ROIC just 1.8% above WACC. Its margin profile is weaker, reflecting a slightly favorable moat. Albertsons’ growth in private label and digital channels offers potential, yet competitive pressures temper outlook.
Scale and Efficiency vs. Margin Optimization
Kroger’s wider moat, driven by superior capital returns and operational scale, clearly outmatches Albertsons’ narrower cost focus. Kroger is better positioned to defend and expand market share amid evolving consumer trends.
Which stock offers better returns?
The past year shows divergent stock price movements for The Kroger Co. and Albertsons Companies, Inc., with Kroger displaying a moderate bullish trend and Albertsons facing sustained declines.
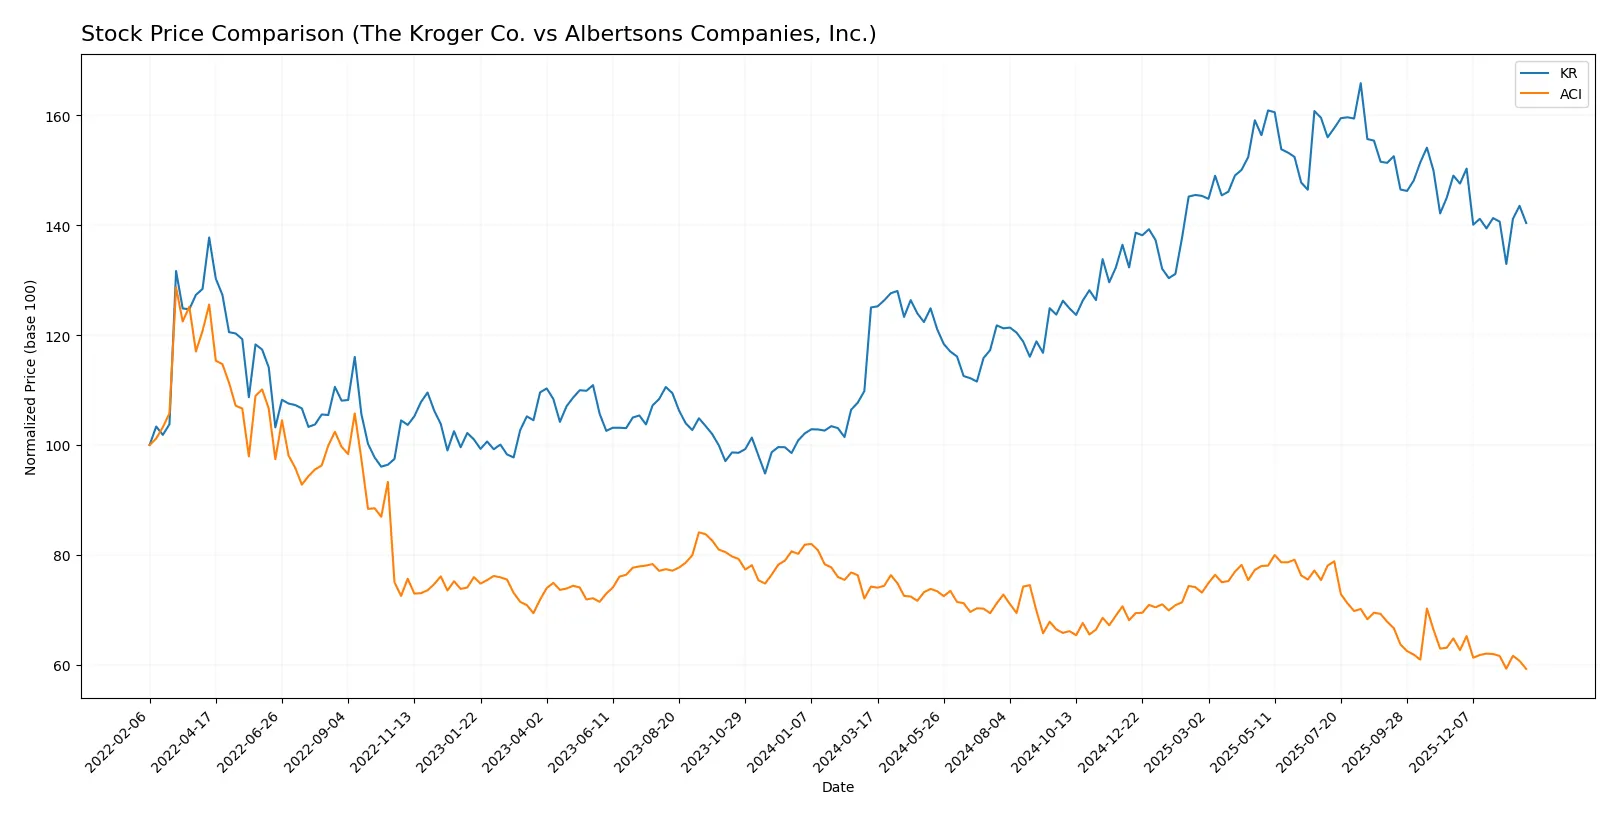
Trend Comparison
The Kroger Co. stock gained 12.29% over the past 12 months, marking a bullish trend with decelerating momentum. Its price ranged from $49.93 to $74.24, showing notable strength despite recent slight weakness.
Albertsons Companies, Inc. declined 20.18% over the same period, confirming a bearish trend with deceleration. The stock traded between $16.65 and $22.47, reflecting persistent downward pressure and reduced volatility.
Kroger outperformed Albertsons with a positive 12.29% return versus a 20.18% loss. Kroger’s bullish trend contrasts sharply with Albertsons’ bearish trajectory over the past year.
Target Prices
Analysts present a mixed but generally optimistic target consensus for these grocery sector leaders.
| Company | Target Low | Target High | Consensus |
|---|---|---|---|
| The Kroger Co. | 67 | 85 | 74.3 |
| Albertsons Companies, Inc. | 14 | 29 | 20.88 |
The Kroger Co. trades below its consensus target of 74.3 at 62.85, signaling potential upside. Albertsons, at 16.65, also sits well below its 20.88 consensus, suggesting room for appreciation.

Don’t Let Luck Decide Your Entry Point
Optimize your entry points with our advanced ProRealTime indicators. You’ll get efficient buy signals with precise price targets for maximum performance. Start outperforming now!
How do institutions grade them?
Here is a summary of recent institutional grades for The Kroger Co. and Albertsons Companies, Inc.:
The Kroger Co. Grades
The table below shows Kroger’s most recent grades from leading financial institutions.
| Grading Company | Action | New Grade | Date |
|---|---|---|---|
| Morgan Stanley | Maintain | Equal Weight | 2026-01-15 |
| Barclays | Maintain | Equal Weight | 2026-01-08 |
| Citigroup | Maintain | Neutral | 2025-12-10 |
| Morgan Stanley | Maintain | Equal Weight | 2025-12-08 |
| UBS | Maintain | Neutral | 2025-12-05 |
| JP Morgan | Maintain | Neutral | 2025-12-05 |
| Telsey Advisory Group | Maintain | Outperform | 2025-12-05 |
| Evercore ISI Group | Maintain | Outperform | 2025-12-05 |
| Wells Fargo | Maintain | Overweight | 2025-12-05 |
| Telsey Advisory Group | Maintain | Outperform | 2025-12-01 |
Albertsons Companies, Inc. Grades
Below is a record of Albertsons’ latest institutional grades from reputable firms.
| Grading Company | Action | New Grade | Date |
|---|---|---|---|
| Morgan Stanley | Downgrade | Underweight | 2026-01-15 |
| UBS | Maintain | Buy | 2026-01-08 |
| Wells Fargo | Maintain | Overweight | 2026-01-08 |
| Telsey Advisory Group | Maintain | Outperform | 2026-01-08 |
| BMO Capital | Maintain | Outperform | 2026-01-08 |
| JP Morgan | Maintain | Overweight | 2026-01-08 |
| Barclays | Maintain | Underweight | 2026-01-08 |
| Telsey Advisory Group | Maintain | Outperform | 2025-12-31 |
| Evercore ISI Group | Maintain | In Line | 2025-12-23 |
| Evercore ISI Group | Maintain | In Line | 2025-11-11 |
Which company has the best grades?
Kroger consistently receives neutral to outperform grades, while Albertsons displays a wider range including underweight and outperform. Kroger’s steadier positive outlook may instill greater investor confidence.
Risks specific to each company
The following categories identify the critical pressure points and systemic threats facing both firms in the 2026 market environment:
1. Market & Competition
The Kroger Co.
- Faces intense competition with a higher market cap and broader store network, sustaining strong brand loyalty.
Albertsons Companies, Inc.
- Operates fewer stores and a smaller market cap, struggling to expand against dominant rivals like Kroger.
2. Capital Structure & Debt
The Kroger Co.
- High debt-to-equity ratio (3.03) signals leverage risk despite strong interest coverage (8.26).
Albertsons Companies, Inc.
- Even higher debt-to-equity ratio (4.19) with weaker interest coverage (3.37) raises financial risk concerns.
3. Stock Volatility
The Kroger Co.
- Beta of 0.6 indicates moderate volatility, reflecting stability relative to the market.
Albertsons Companies, Inc.
- Lower beta at 0.308 suggests less sensitivity to market swings but may indicate lower growth expectations.
4. Regulatory & Legal
The Kroger Co.
- Subject to standard US food and drug retail regulations with ongoing scrutiny on pricing and labor laws.
Albertsons Companies, Inc.
- Faces similar regulatory challenges plus integration risks across diverse regional brands and operations.
5. Supply Chain & Operations
The Kroger Co.
- Efficient asset turnover (2.8) and fixed asset turnover (4.52) support operational resilience.
Albertsons Companies, Inc.
- Slightly higher fixed asset turnover (5.04) but lower liquidity ratios could pressure operational flexibility.
6. ESG & Climate Transition
The Kroger Co.
- Increasing focus on sustainability initiatives but faces costs linked to climate transition investments.
Albertsons Companies, Inc.
- Also advancing ESG efforts but challenges remain due to fragmented store base and supply chain complexity.
7. Geopolitical Exposure
The Kroger Co.
- Primarily domestic exposure with limited geopolitical risk but sensitive to US trade policy shifts.
Albertsons Companies, Inc.
- Similar US-centric operations, with additional risks from regional economic disparities across its store footprint.
Which company shows a better risk-adjusted profile?
Kroger’s largest risk lies in elevated financial leverage despite solid operational metrics. Albertsons faces greater debt strain combined with weaker interest coverage, increasing default risk. Both show safe Altman Z-Scores, but Kroger’s operational efficiency and market dominance grant it a superior risk-adjusted profile. Notably, Kroger’s higher interest coverage ratio (8.26 vs. 3.37) substantiates my concern about Albertsons’ financial fragility.
Final Verdict: Which stock to choose?
The Kroger Co. (KR) excels as a cash-generating powerhouse with a durable competitive moat. Its efficient capital allocation and strong ROE underscore a value-creating engine. A point of vigilance remains its high leverage and tight liquidity, which could pressure stability in downturns. KR suits aggressive growth portfolios seeking resilience in retail.
Albertsons Companies, Inc. (ACI) leverages a strategic moat through improving profitability and a lower valuation multiple. Its growing ROIC hints at emerging competitive strength. Relative to Kroger, ACI offers a more conservative risk profile but with less robust growth momentum. It fits well in GARP portfolios balancing value and growth.
If you prioritize durable value creation and operational efficiency, Kroger stands out due to its strong moat and superior capital returns. However, if you seek a more value-oriented approach with improving fundamentals and less price volatility, Albertsons offers better stability and a compelling margin of safety. Both present analytical scenarios for distinct investor profiles amid sector headwinds.
Disclaimer: Investment carries a risk of loss of initial capital. The past performance is not a reliable indicator of future results. Be sure to understand risks before making an investment decision.
Go Further
I encourage you to read the complete analyses of The Kroger Co. and Albertsons Companies, Inc. to enhance your investment decisions: