Home > Comparison > Basic Materials > SHW vs ALB
The strategic rivalry between The Sherwin-Williams Company and Albemarle Corporation shapes the specialty chemicals sector’s future. Sherwin-Williams operates as a capital-intensive industrial giant with a vast distribution network in paints and coatings. Albemarle, in contrast, focuses on engineered specialty chemicals, notably lithium for energy storage. This analysis pits Sherwin-Williams’ broad industrial footprint against Albemarle’s growth in emerging materials, aiming to identify the superior risk-adjusted investment opportunity for diversified portfolios.
Table of contents
Companies Overview
Two heavyweight players in the specialty chemicals industry shape significant market dynamics in 2026.
The Sherwin-Williams Company: Paints and coatings powerhouse
The Sherwin-Williams Company commands a leading position in architectural and industrial coatings. Its core revenue derives from diversified segments: The Americas Group, Consumer Brands, and Performance Coatings. In 2026, it focuses strategically on expanding its company-operated store network and enhancing product innovation across global markets to solidify its competitive advantage.
Albemarle Corporation: Engineered specialty chemicals innovator
Albemarle Corporation specializes in engineered specialty chemicals with a distinct focus on lithium, bromine, and catalysts. It generates revenue by supplying essential compounds for energy storage, refining, and pharmaceuticals. Its strategic priority centers on scaling lithium production to meet rising demand in electric vehicles and energy storage solutions, reflecting its commitment to sustainable growth.
Strategic Collision: Similarities & Divergences
Both companies operate in specialty chemicals but pursue contrasting philosophies: Sherwin-Williams emphasizes a vertically integrated distribution network, while Albemarle drives growth through chemical innovation in niche markets. They primarily compete in industrial applications and advanced materials sectors. Their investment profiles diverge sharply—Sherwin-Williams offers stable, broad-based exposure, whereas Albemarle presents a high-growth, technology-driven opportunity.
Income Statement Comparison
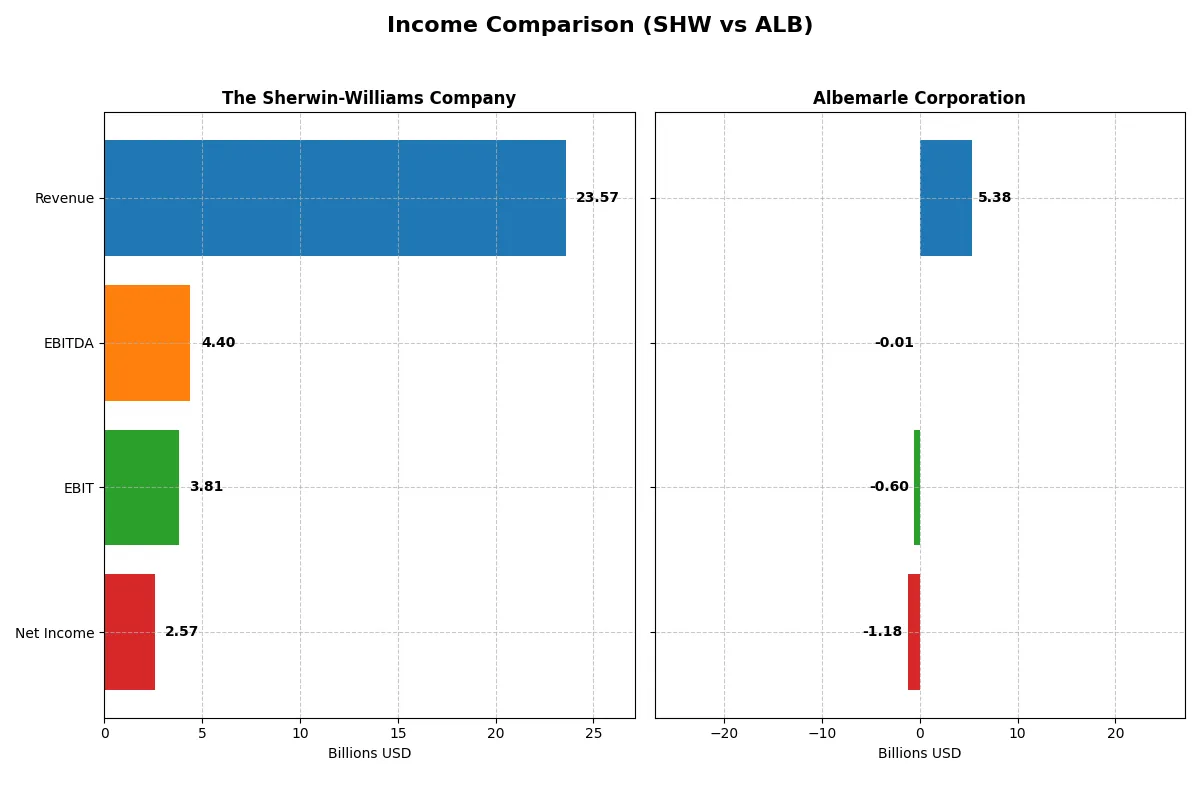
This data dissects the core profitability and scalability of both corporate engines to reveal who dominates the bottom line:
| Metric | The Sherwin-Williams Company (SHW) | Albemarle Corporation (ALB) |
|---|---|---|
| Revenue | 23.6B | 5.4B |
| Cost of Revenue | 12.0B | 5.3B |
| Operating Expenses | 7.7B | 1.9B |
| Gross Profit | 11.5B | 84M |
| EBITDA | 4.4B | -9M |
| EBIT | 3.8B | -598M |
| Interest Expense | 469M | 166M |
| Net Income | 2.6B | -1.3B |
| EPS | 10.38 | -11.2 |
| Fiscal Year | 2025 | 2024 |
Income Statement Analysis: The Bottom-Line Duel
This income statement comparison reveals which company runs a more efficient and profitable corporate engine over recent years.
The Sherwin-Williams Company Analysis
Sherwin-Williams steadily grew revenue from $19.9B in 2021 to $23.6B in 2025, with net income rising from $1.86B to $2.57B. The company maintains robust margin health, boasting a gross margin near 49% and a net margin around 11%. Despite slight revenue growth slowing in 2025 (+2%), it sustains solid profitability and operational efficiency.
Albemarle Corporation Analysis
Albemarle’s revenue surged from $3.3B in 2021 to $9.6B in 2023 but collapsed to $5.4B in 2024. Net income followed a volatile path, peaking at $2.68B in 2022 before plunging to a net loss of $1.18B in 2024. Margins deteriorated sharply, with a gross margin of just 1.6% and a negative net margin of nearly -22% in 2024, reflecting severe operational and profitability challenges.
Consistent Profitability vs. Volatile Earnings
Sherwin-Williams demonstrates consistent revenue growth with healthy margins and positive net income momentum, while Albemarle suffers from sharp margin compression and recent heavy losses. Sherwin-Williams clearly leads in fundamental income statement strength. Conservative investors favor Sherwin-Williams’ stable profitability over Albemarle’s erratic earnings profile and margin instability.
Financial Ratios Comparison
These vital ratios act as a diagnostic tool to expose the underlying fiscal health, valuation premiums, and capital efficiency of companies:
| Ratios | The Sherwin-Williams Company (SHW) | Albemarle Corporation (ALB) |
|---|---|---|
| ROE | 55.86% | -11.84% |
| ROIC | 15.21% | -11.81% |
| P/E | 31.08 | -8.58 |
| P/B | 17.36 | 1.02 |
| Current Ratio | 0.87 | 1.95 |
| Quick Ratio | 0.53 | 1.19 |
| D/E (Debt-to-Equity) | 2.81 | 0.36 |
| Debt-to-Assets | 49.97% | 21.77% |
| Interest Coverage | 8.11 | -10.73 |
| Asset Turnover | 0.91 | 0.32 |
| Fixed Asset Turnover | 3.84 | 0.57 |
| Payout ratio | 30.31% | -26.39% |
| Dividend yield | 0.98% | 3.08% |
| Fiscal Year | 2025 | 2024 |
Efficiency & Valuation Duel: The Vital Signs
Ratios act as a company’s DNA, revealing hidden risks and operational excellence beneath the surface.
The Sherwin-Williams Company
Sherwin-Williams delivers robust profitability with a 55.9% ROE and a strong 10.9% net margin, signaling operational efficiency. However, valuation multiples are stretched, with a P/E of 31.1 and P/B at 17.4. The company returns modest dividends (0.98% yield) while sustaining solid capital returns above WACC, reflecting disciplined capital allocation.
Albemarle Corporation
Albemarle shows weak profitability with negative ROE (-11.8%) and net margin (-21.9%), indicating operational challenges. Yet valuation appears attractive, with a low P/B of 1.02 and a negative but favorable P/E of -8.6, reflecting market skepticism. The company offers a higher dividend yield of 3.08%, but struggles with interest coverage and asset turnover, signaling risk.
Premium Valuation vs. Operational Safety
Sherwin-Williams combines strong profitability with premium valuation, while Albemarle trades cheaply but suffers operational deficits. Sherwin-Williams offers a safer risk-reward balance, suited to investors prioritizing stability. Albemarle’s profile fits those willing to endure volatility for potential turnaround gains.
Which one offers the Superior Shareholder Reward?
I compare Sherwin-Williams (SHW) and Albemarle (ALB) on dividends, payout ratios, and buybacks. SHW yields ~0.98% with a stable 30% payout, supported by strong free cash flow. ALB offers a higher 3.08% yield but shows inconsistent profits and negative free cash flow. SHW’s robust buyback program contrasts with ALB’s conservative capital returns amid restructuring. I see SHW’s disciplined dividend and buybacks as a more sustainable model. ALB’s higher yield compensates for risk but lacks long-term clarity. For 2026, SHW delivers superior total shareholder reward through balanced distribution and financial stability.
Comparative Score Analysis: The Strategic Profile
The radar chart reveals the fundamental DNA and trade-offs of The Sherwin-Williams Company and Albemarle Corporation, highlighting their financial strengths and vulnerabilities:
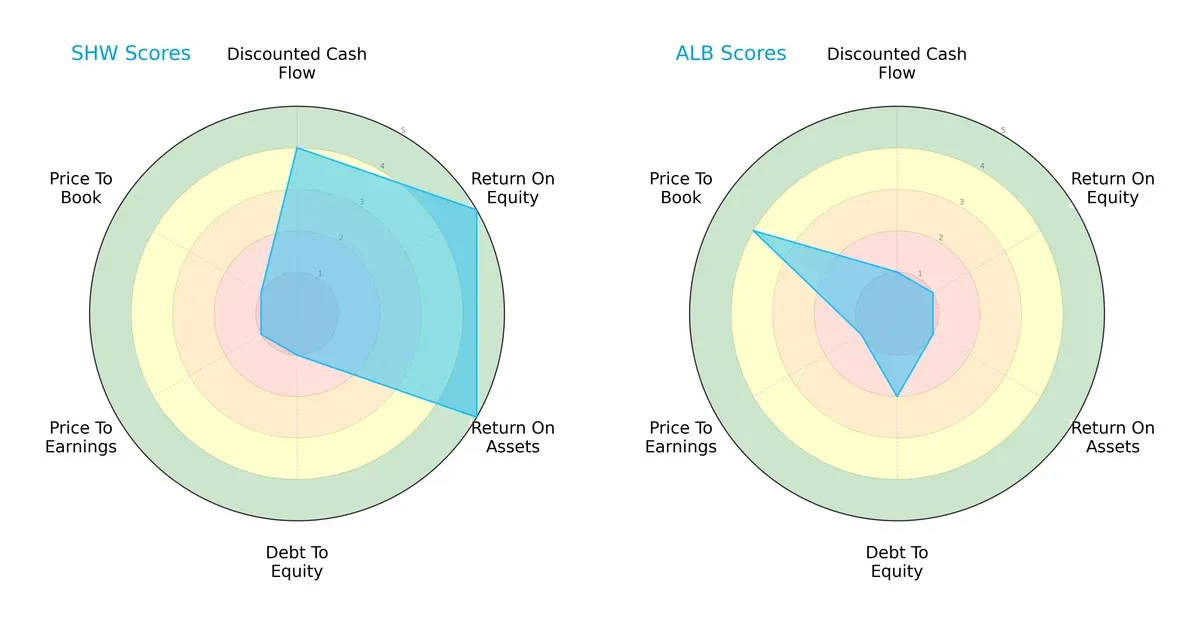
Sherwin-Williams leads with very favorable ROE and ROA scores, signaling efficient profit generation and asset use. Albemarle shows strength only in Price-to-Book valuation, indicating potential undervaluation. Sherwin-Williams exhibits a more balanced profile but suffers from weak debt and valuation scores. Albemarle relies on valuation appeal but lags in operational metrics.
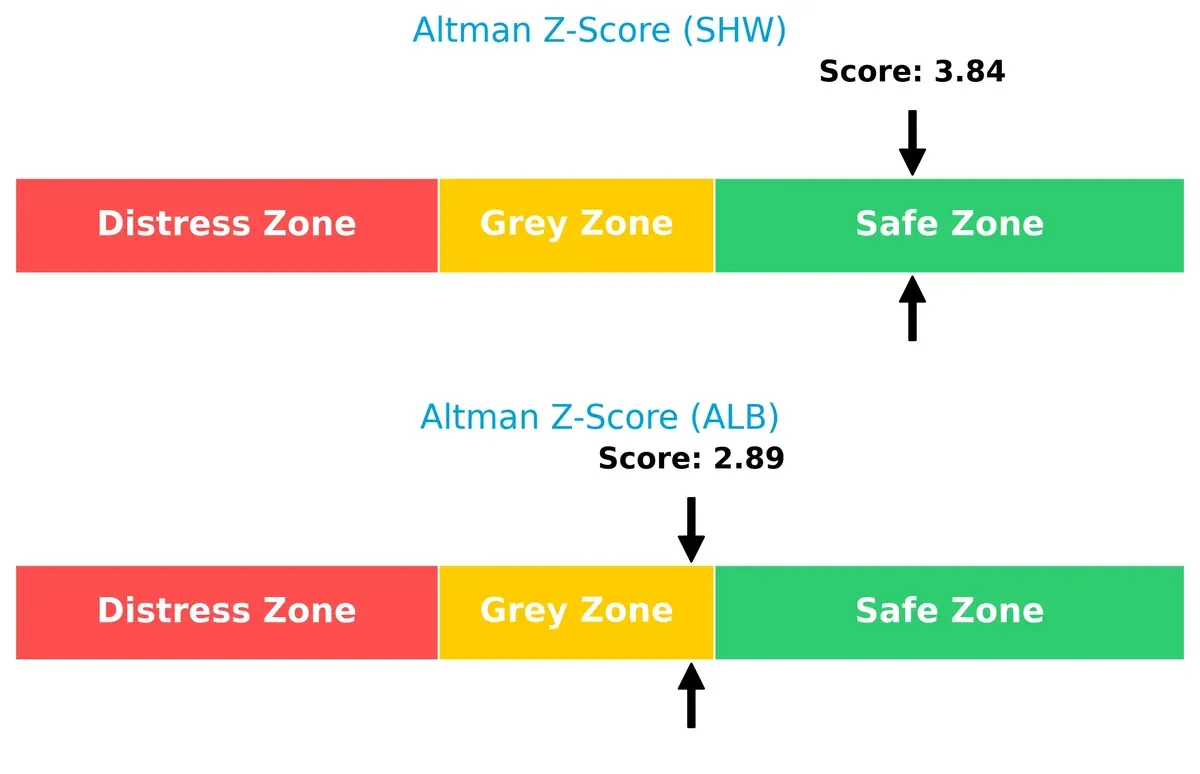
Bankruptcy Risk: Solvency Showdown
The Sherwin-Williams’ Altman Z-Score of 3.84 places it safely above bankruptcy risk, while Albemarle’s 2.89 signals moderate risk amid current market cycles:
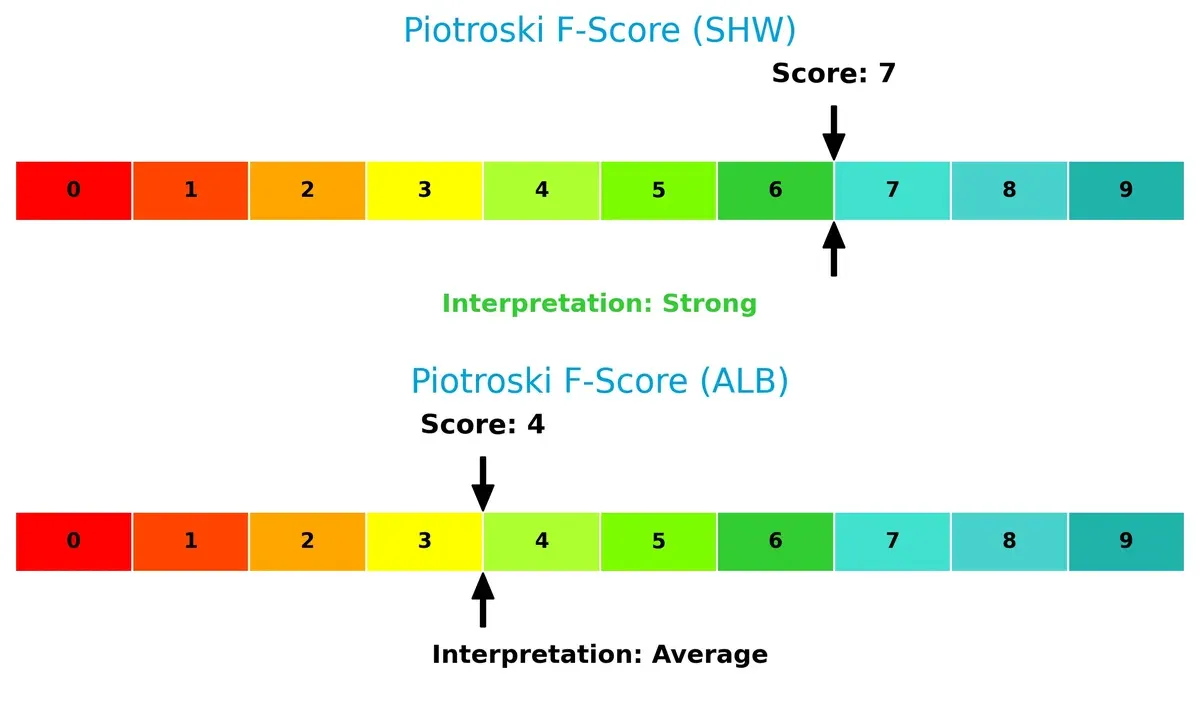
Financial Health: Quality of Operations
Sherwin-Williams scores a strong 7 on the Piotroski F-Score, reflecting robust financial health and operational quality. Albemarle’s average score of 4 raises caution over internal weaknesses:
How are the two companies positioned?
This section dissects the operational DNA of SHW and ALB by comparing their revenue distribution and internal dynamics. The goal is to confront their economic moats, revealing which model delivers the most resilient and sustainable competitive advantage today.
Revenue Segmentation: The Strategic Mix
This comparison dissects how Sherwin-Williams and Albemarle diversify income streams and reveal their primary sector bets for 2024:
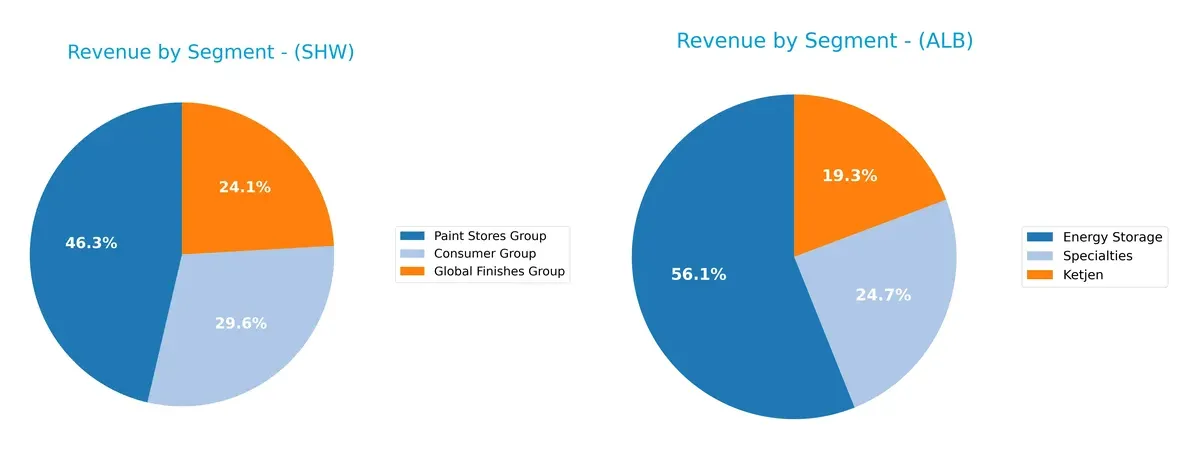
Sherwin-Williams anchors revenue in Paint Stores Group at $13.2B, dwarfing Consumer ($8.4B) and Global Finishes ($6.9B). This signals infrastructure dominance and retail lock-in. Albemarle shows more balance: Energy Storage leads at $3B, but Ketjen ($1B) and Specialties ($1.3B) create a diversified portfolio. Albemarle’s mix reduces concentration risk, while Sherwin-Williams leans heavily on a core retail segment.
Strengths and Weaknesses Comparison
This table compares the strengths and weaknesses of The Sherwin-Williams Company (SHW) and Albemarle Corporation (ALB):
SHW Strengths
- Strong profitability with 10.9% net margin
- ROE at 55.86% shows high capital efficiency
- Favorable ROIC at 15.21% above WACC
- High fixed asset turnover at 3.84
- Diversified product segments including Consumer and Paint Stores
- Established market presence in Americas
ALB Strengths
- Low debt-to-equity ratio at 0.36 indicates conservative leverage
- Strong liquidity with current ratio 1.95 and quick ratio 1.19
- Favorable PE and PB ratios suggest undervaluation
- Higher dividend yield at 3.08%
- Diverse revenue streams including Energy Storage and Specialties
- Significant foreign sales highlight global exposure
SHW Weaknesses
- Over-leveraged with DE at 2.81 and high debt to assets near 50%
- Poor liquidity ratios: current ratio 0.87 and quick ratio 0.53
- Unfavorable valuation multiples: PE 31.08 and PB 17.36
- Dividend yield below 1% may deter income investors
- Slightly unfavorable global ratios overall
- Limited recent geographic data on global presence
ALB Weaknesses
- Negative profitability: net margin -21.93%, ROE -11.84%, ROIC -11.81%
- Weak asset turnover at 0.32 and fixed asset turnover 0.57
- Negative interest coverage ratio at -3.61 signals financial stress
- Reliance on volatile lithium segment
- Slightly favorable global ratios but with notable operational challenges
SHW excels in profitability and operational efficiency but faces liquidity and leverage concerns. ALB shows financial conservatism and global diversification but struggles with profitability and asset utilization. These contrasts shape distinct strategic priorities for each company.
The Moat Duel: Analyzing Competitive Defensibility
A structural moat shields long-term profits from relentless competitive pressures. Without it, profits erode quickly in any industry landscape:
The Sherwin-Williams Company: Durable Brand and Distribution Moat
Sherwin-Williams leverages strong brand loyalty and an extensive retail network, reflected in a 6.3% ROIC premium over WACC and stable margins near 16%. In 2026, its expansion into performance coatings should deepen this moat further.
Albemarle Corporation: Commodity Exposure and Innovation Challenge
Albemarle’s moat rests on lithium supply and chemical catalysts, but a negative ROIC gap of -21% signals value destruction. Unlike Sherwin, its moat weakens amid volatile lithium markets and margin pressure, though growth in EV battery demand offers upside if execution improves.
Moat Strength: Brand Durability vs. Supply Chain Vulnerability
Sherwin-Williams holds a wider, more durable moat, consistently generating excess returns. Albemarle’s declining ROIC and margin volatility reveal a fragile moat, leaving Sherwin better positioned to defend its market share in 2026.
Which stock offers better returns?
Over the past year, both stocks show upward momentum, with Albemarle Corporation outperforming Sherwin-Williams Company significantly in price appreciation and trading activity.
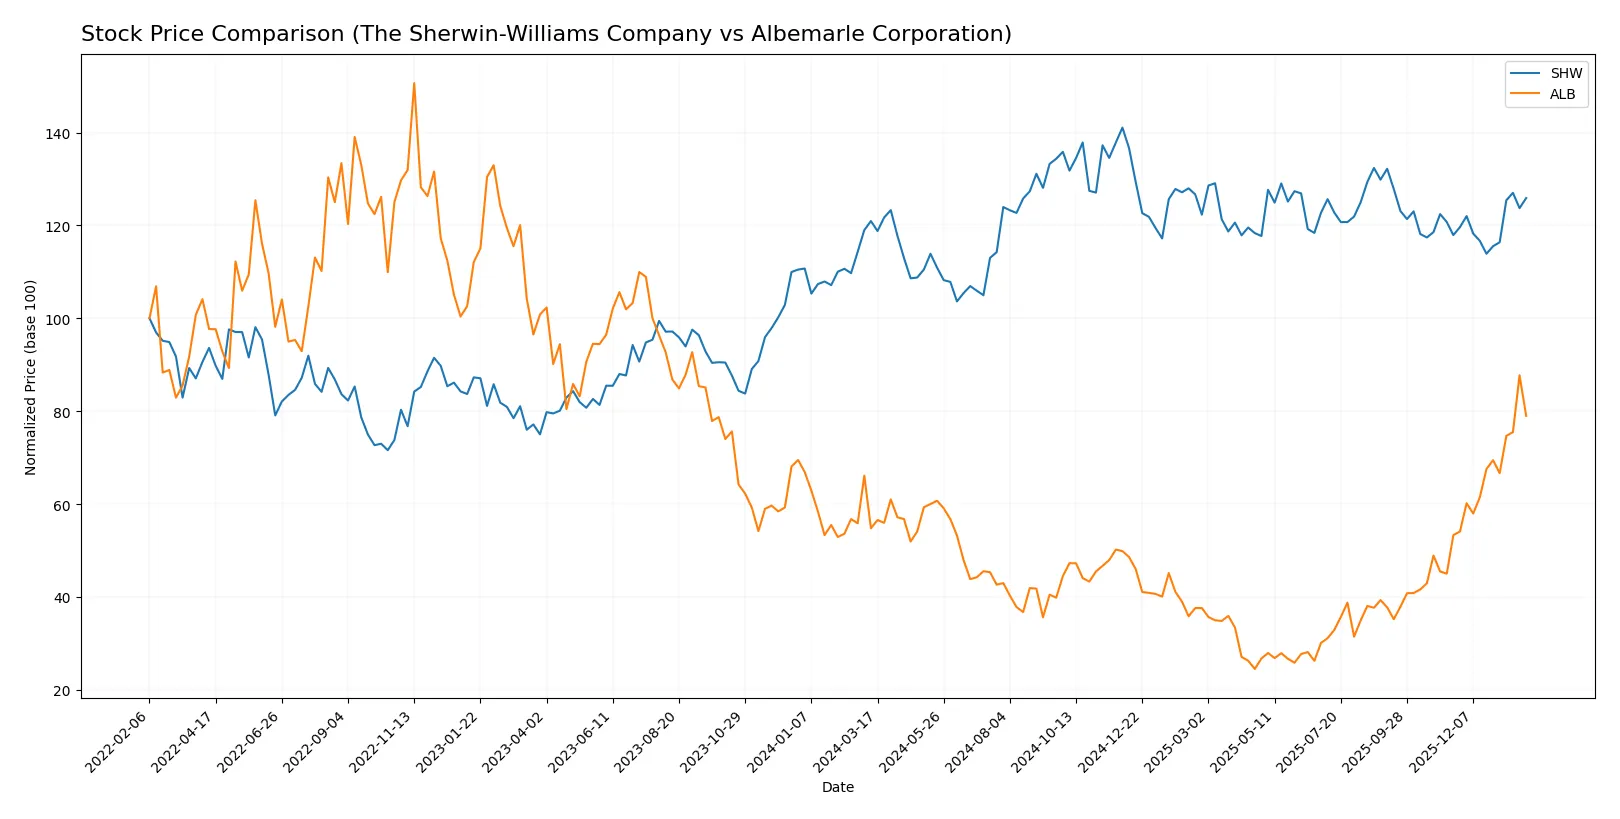
Trend Comparison
The Sherwin-Williams Company (SHW) stock rose 4.09% over 12 months, showing a bullish trend with accelerating gains and a high-low range between 291.95 and 397.4.
Albemarle Corporation (ALB) surged 44.2% in the same period, marking a strong bullish trend with acceleration and a wider price range from 52.91 to 189.51.
Albemarle’s stock delivered the highest market performance, outperforming Sherwin-Williams by a wide margin in both price gains and recent trading dominance.
Target Prices
Analysts provide a cautiously optimistic outlook for both The Sherwin-Williams Company and Albemarle Corporation.
| Company | Target Low | Target High | Consensus |
|---|---|---|---|
| The Sherwin-Williams Company | 371 | 420 | 393.5 |
| Albemarle Corporation | 136 | 210 | 184 |
Sherwin-Williams’s consensus target stands about 11% above its current price of 355, signaling moderate upside. Albemarle’s consensus target is roughly 8% higher than its current 171, indicating cautious optimism amid volatility.

Don’t Let Luck Decide Your Entry Point
Optimize your entry points with our advanced ProRealTime indicators. You’ll get efficient buy signals with precise price targets for maximum performance. Start outperforming now!
How do institutions grade them?
This section compares the latest institutional grades for The Sherwin-Williams Company and Albemarle Corporation:
The Sherwin-Williams Company Grades
The table below shows recent grades from reputable financial institutions for Sherwin-Williams:
| Grading Company | Action | New Grade | Date |
|---|---|---|---|
| RBC Capital | Maintain | Outperform | 2026-01-30 |
| UBS | Maintain | Buy | 2026-01-12 |
| Citigroup | Upgrade | Buy | 2025-12-18 |
| Mizuho | Maintain | Outperform | 2025-12-18 |
| Citigroup | Maintain | Neutral | 2025-10-30 |
| UBS | Maintain | Buy | 2025-10-29 |
| JP Morgan | Maintain | Overweight | 2025-10-29 |
| Wells Fargo | Maintain | Overweight | 2025-10-29 |
| RBC Capital | Maintain | Outperform | 2025-10-29 |
| B of A Securities | Maintain | Neutral | 2025-10-14 |
Albemarle Corporation Grades
Recent credible institutional grades for Albemarle Corporation are summarized below:
| Grading Company | Action | New Grade | Date |
|---|---|---|---|
| JP Morgan | Maintain | Neutral | 2026-01-28 |
| Jefferies | Maintain | Buy | 2026-01-28 |
| Wells Fargo | Maintain | Equal Weight | 2026-01-26 |
| Truist Securities | Upgrade | Buy | 2026-01-21 |
| Citigroup | Maintain | Neutral | 2026-01-21 |
| Oppenheimer | Maintain | Outperform | 2026-01-21 |
| Deutsche Bank | Upgrade | Buy | 2026-01-13 |
| UBS | Maintain | Buy | 2026-01-12 |
| Mizuho | Maintain | Neutral | 2026-01-12 |
| Scotiabank | Upgrade | Sector Outperform | 2026-01-12 |
Which company has the best grades?
Sherwin-Williams consistently holds strong Buy/Outperform ratings from multiple firms, signaling broad confidence. Albemarle also receives solid Buy and Outperform grades but shows more Neutral and Equal Weight ratings. Investors may interpret Sherwin-Williams’ grades as indicating a relatively stronger consensus outlook.
Risks specific to each company
The following categories identify the critical pressure points and systemic threats facing both firms in the 2026 market environment:
1. Market & Competition
The Sherwin-Williams Company
- Dominates architectural and industrial coatings with strong brand equity but faces premium valuation pressures.
Albemarle Corporation
- Operates in specialty chemicals with volatile lithium demand and exposure to EV market swings.
2. Capital Structure & Debt
The Sherwin-Williams Company
- High leverage (D/E 2.81) signals elevated financial risk despite solid interest coverage.
Albemarle Corporation
- Conservative leverage (D/E 0.36) supports balance sheet stability but weak interest coverage marks distress.
3. Stock Volatility
The Sherwin-Williams Company
- Beta at 1.26 indicates moderate market sensitivity typical for specialty chemicals.
Albemarle Corporation
- Higher beta of 1.41 reflects greater stock volatility and investor uncertainty.
4. Regulatory & Legal
The Sherwin-Williams Company
- Faces standard environmental regulations in coatings with manageable compliance costs.
Albemarle Corporation
- Lithium mining and chemical production expose it to stricter environmental and trade regulations.
5. Supply Chain & Operations
The Sherwin-Williams Company
- Benefits from extensive store network and diversified supplier base reducing disruption risks.
Albemarle Corporation
- Supply chain dependent on raw materials for lithium, vulnerable to geopolitical and commodity price swings.
6. ESG & Climate Transition
The Sherwin-Williams Company
- Advances in eco-friendly coatings align with regulatory trends but transition costs may rise.
Albemarle Corporation
- Faces pressure to ensure sustainable lithium sourcing amid rising ESG scrutiny.
7. Geopolitical Exposure
The Sherwin-Williams Company
- Primarily North American focus limits geopolitical risk but emerging markets remain uncertain.
Albemarle Corporation
- Global lithium supply chain exposes it to geopolitical tensions, especially in critical mining regions.
Which company shows a better risk-adjusted profile?
The Sherwin-Williams Company’s biggest risk is its high leverage, raising financial vulnerability despite operational strength. Albemarle’s principal risk lies in its earnings volatility and regulatory exposure tied to lithium markets. Sherwin-Williams shows a better risk-adjusted profile, supported by a safer Altman Z-Score (3.84 vs. 2.89) and stronger Piotroski score (7 vs. 4). However, Albemarle’s stock decline of -5.57% recently signals market anxiety over its financial health and commodity dependence.
Final Verdict: Which stock to choose?
The Sherwin-Williams Company’s superpower lies in its durable competitive advantage and efficient capital allocation. It consistently generates robust returns well above its cost of capital, demonstrating a strong economic moat. Its point of vigilance is its stretched liquidity position, which could pressure short-term operations. SHW suits portfolios seeking steady, value-creating growth with moderate risk tolerance.
Albemarle Corporation’s strategic moat centers on its solid balance sheet and appealing valuation metrics, supported by a low debt load and attractive price-to-book ratio. However, it currently struggles with operating profitability and declining returns, making it a riskier choice compared to SHW. ALB fits investors with a higher risk appetite aiming for turnaround potential and deep value plays.
If you prioritize durable profitability and capital efficiency, Sherwin-Williams outshines Albemarle with its consistent value creation and stronger financial health. However, if you seek speculative growth with a focus on undervalued assets and are willing to accept operational headwinds, Albemarle offers better potential upside despite its challenges. Each scenario demands a clear alignment with your risk profile and investment horizon.
Disclaimer: Investment carries a risk of loss of initial capital. The past performance is not a reliable indicator of future results. Be sure to understand risks before making an investment decision.
Go Further
I encourage you to read the complete analyses of The Sherwin-Williams Company and Albemarle Corporation to enhance your investment decisions: