Home > Comparison > Basic Materials > PPG vs ALB
The strategic rivalry between PPG Industries, Inc. and Albemarle Corporation shapes leadership in the specialty chemicals sector. PPG operates as a capital-intensive industrial coatings giant, serving diverse markets with performance and industrial coatings. Albemarle specializes as a high-tech engineered chemicals provider, focusing on lithium and catalysts critical to energy storage and pharmaceuticals. This analysis will determine which company’s operational model offers superior risk-adjusted returns for a diversified portfolio in 2026.
Table of contents
Companies Overview
PPG Industries and Albemarle Corporation are pivotal players in the specialty chemicals market with distinct strategic approaches.
PPG Industries, Inc.: Global Leader in Coatings and Specialty Materials
PPG Industries dominates the specialty chemicals sector with its performance coatings and industrial coatings segments driving revenue. It monetizes through paints, adhesives, sealants, and advanced materials serving automotive, aerospace, construction, and consumer markets. In 2026, PPG sharpened its focus on expanding high-value specialty coatings and chemical management services to reinforce its competitive edge.
Albemarle Corporation: Specialty Chemicals Innovator
Albemarle Corporation stands out by producing engineered specialty chemicals with a strong emphasis on lithium compounds, bromine products, and catalysts. It generates revenue mainly from lithium-based materials for electric vehicle batteries, alongside fire safety chemicals and petroleum refining catalysts. Albemarle’s 2026 strategy prioritizes scaling lithium production to meet surging demand in energy storage and EV markets.
Strategic Collision: Similarities & Divergences
Both companies excel in the specialty chemicals arena but diverge in core philosophies: PPG focuses on broad industrial coatings and materials, while Albemarle targets niche chemical segments like lithium and bromine. Their primary battleground is the evolving materials supply chain for automotive and energy sectors. Investors face two distinct profiles: PPG offers diversified industrial exposure; Albemarle delivers concentrated growth potential in electrification and specialty chemicals.
Income Statement Comparison
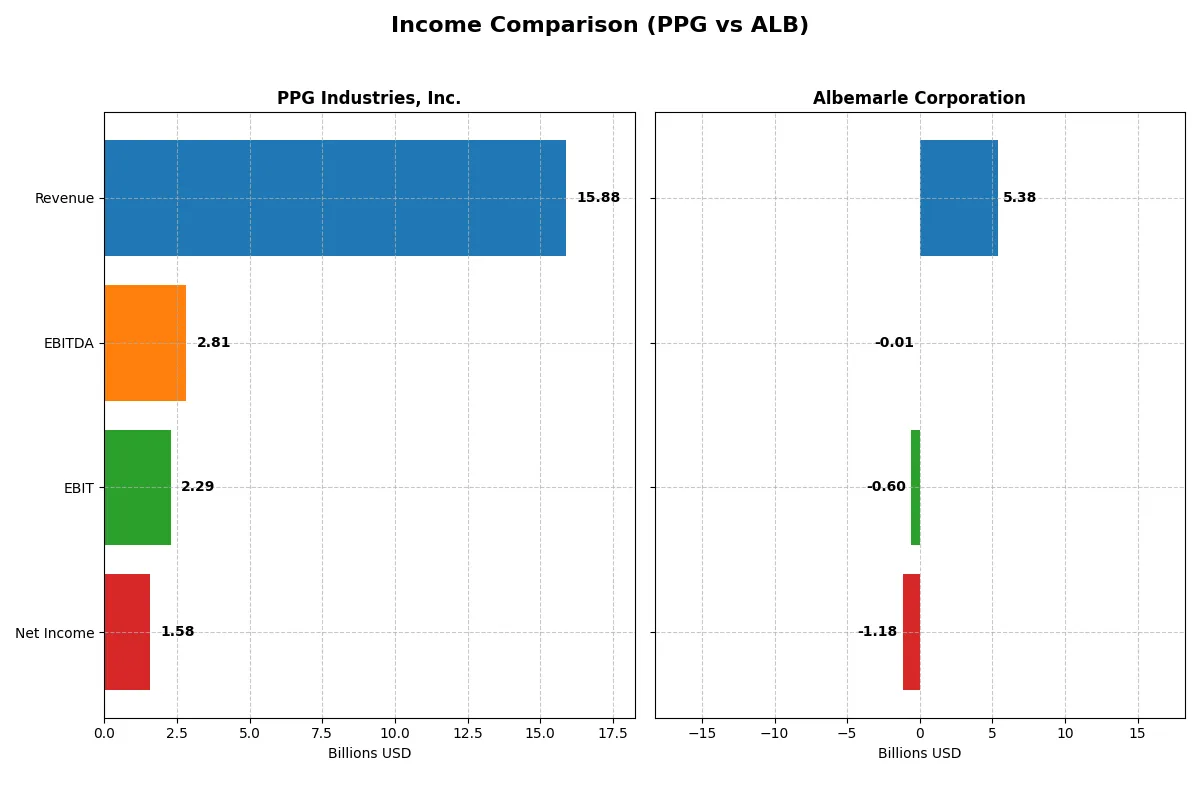
This data dissects the core profitability and scalability of both corporate engines to reveal who dominates the bottom line:
| Metric | PPG Industries, Inc. (PPG) | Albemarle Corporation (ALB) |
|---|---|---|
| Revenue | 15.9B | 5.38B |
| Cost of Revenue | 9.84B | 5.29B |
| Operating Expenses | 3.86B | 1.86B |
| Gross Profit | 6.03B | 84.2M |
| EBITDA | 2.81B | -9.11M |
| EBIT | 2.29B | -598M |
| Interest Expense | 241M | 166M |
| Net Income | 1.58B | -1.32B |
| EPS | 6.96 | -11.2 |
| Fiscal Year | 2025 | 2024 |
Income Statement Analysis: The Bottom-Line Duel
This income statement comparison reveals which company runs a more efficient and profitable corporate engine through recent financial performance.
PPG Industries, Inc. Analysis
PPG shows stable revenue around 15.9B in 2025, with net income rising sharply to 1.58B. Gross margins hover near 38%, reflecting consistent cost control. The net margin improved to nearly 10%, signaling enhanced profitability and operational efficiency. PPG’s momentum is strong, supported by a 9.2% EBIT growth and nearly 46% EPS growth in the latest year.
Albemarle Corporation Analysis
Albemarle’s revenue plunged 44% to 5.38B in 2024, crushing gross profit and driving a severe net loss of 1.18B. Margins collapsed, with a gross margin of just 1.6% and a negative net margin near -22%. The company faces heavy operational challenges, reflected in a negative EBIT and steep declines across all profitability metrics over the past year.
Margin Power vs. Revenue Scale
PPG dominates with robust margins and steady revenue, while Albemarle struggles with collapsing profits despite prior revenue growth. PPG’s consistent earnings and margin expansion make it the clearer fundamental winner. For investors, PPG offers a resilient profit profile compared to Albemarle’s volatile and loss-making trajectory.
Financial Ratios Comparison
These vital ratios act as a diagnostic tool to expose the underlying fiscal health, valuation premiums, and capital efficiency of the companies compared below:
| Ratios | PPG Industries, Inc. (PPG) | Albemarle Corporation (ALB) |
|---|---|---|
| ROE | -44.5% | -11.8% |
| ROIC | 43.1% | -11.8% |
| P/E | 14.7 | -8.6 |
| P/B | -6.54 | 1.02 |
| Current Ratio | 1.62 | 1.95 |
| Quick Ratio | 1.22 | 1.19 |
| D/E (Debt to Equity) | -2.10 | 0.36 |
| Debt-to-Assets | 93.6% | 21.8% |
| Interest Coverage | 9.0 | -10.7 |
| Asset Turnover | 1.99 | 0.32 |
| Fixed Asset Turnover | 0 | 0.57 |
| Payout ratio | 39.8% | -26.4% |
| Dividend yield | 2.71% | 3.08% |
| Fiscal Year | 2025 | 2024 |
Efficiency & Valuation Duel: The Vital Signs
Ratios act as a company’s DNA, revealing hidden risks and operational excellence that drive investor confidence and valuation accuracy.
PPG Industries, Inc.
PPG shows mixed profitability with a negative ROE at -44.48% but a strong ROIC of 43.13%, signaling efficient capital use. Its P/E of 14.71 suggests a fair valuation, neither stretched nor cheap. The company returns value via a 2.71% dividend yield, indicating steady shareholder rewards despite margin neutrality.
Albemarle Corporation
Albemarle struggles with negative profitability metrics: net margin at -21.93%, ROE at -11.84%, and ROIC at -11.81%, reflecting operational challenges. Yet, its P/E ratio is favorable, albeit negative, hinting at valuation complexity. The firm offers a 3.08% dividend yield, possibly sustaining investors amid weak earnings.
Operational Strength vs. Profitability Challenges
PPG balances solid capital efficiency and moderate valuation, despite its unfavorable ROE, fitting cautious investors seeking dividend income. Albemarle’s negative returns and operational inefficiencies weigh down its profile, though its dividend yield offers some support. PPG suits those prioritizing operational resilience; Albemarle fits higher-risk, income-focused investors.
Which one offers the Superior Shareholder Reward?
I see PPG Industries delivers a steady 2.7% dividend yield with a moderate 40% payout ratio, backed by positive free cash flow despite recent challenges. Its disciplined buybacks support total returns. Albemarle offers a higher 3.1% yield but with negative free cash flows and a payout ratio that’s unsustainable. Albemarle’s heavy capex and negative margins suggest riskier distributions. I conclude PPG’s balanced dividends and buybacks provide a more sustainable, superior shareholder reward in 2026.
Comparative Score Analysis: The Strategic Profile
The radar chart reveals the fundamental DNA and trade-offs of PPG Industries, Inc. and Albemarle Corporation, highlighting their core financial strengths and weaknesses:
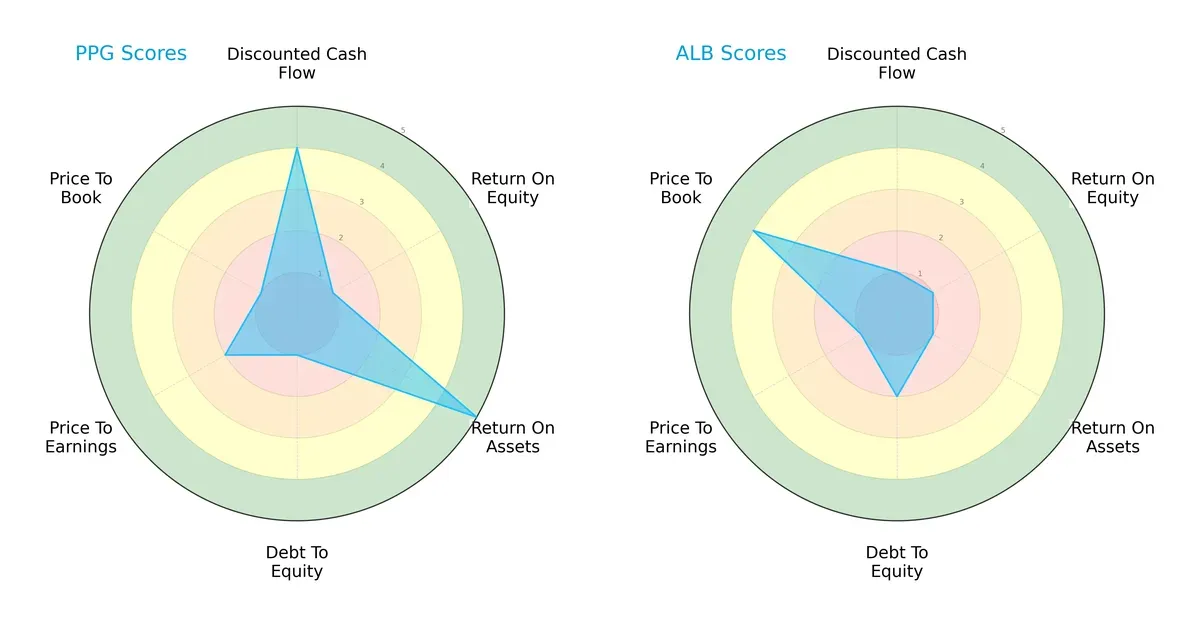
PPG shows strength in discounted cash flow (4) and return on assets (5), signaling strong asset efficiency and valuation appeal. Albemarle, however, scores better on price-to-book (4) and has a moderate debt-to-equity score (2). PPG’s profile is imbalanced with severe weaknesses in return on equity (1) and debt-to-equity (1). Albemarle relies on valuation metrics but suffers from poor operating returns. Overall, PPG presents a more dynamic but riskier financial profile, while Albemarle’s balance is moderate but less robust.
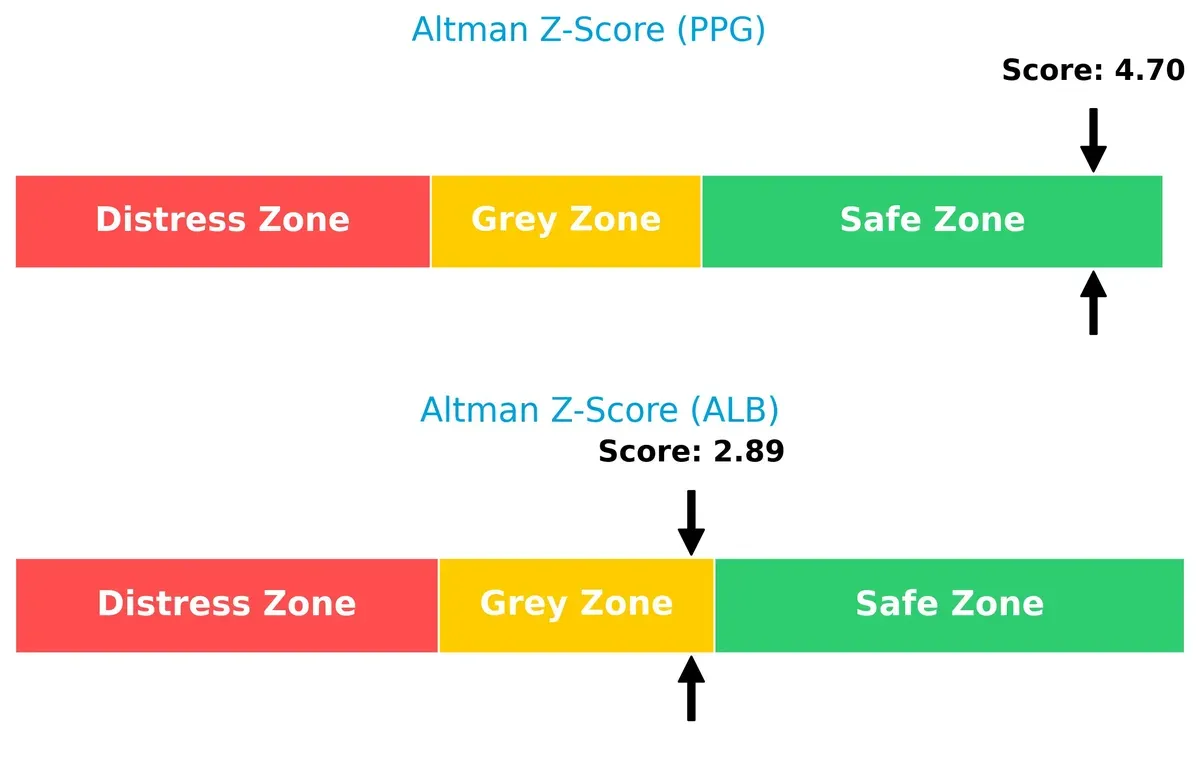
Bankruptcy Risk: Solvency Showdown
The Altman Z-Score difference favors PPG at 4.7 (safe zone) versus Albemarle’s 2.9 (grey zone), signaling stronger long-term solvency and lower bankruptcy risk for PPG in this cycle:
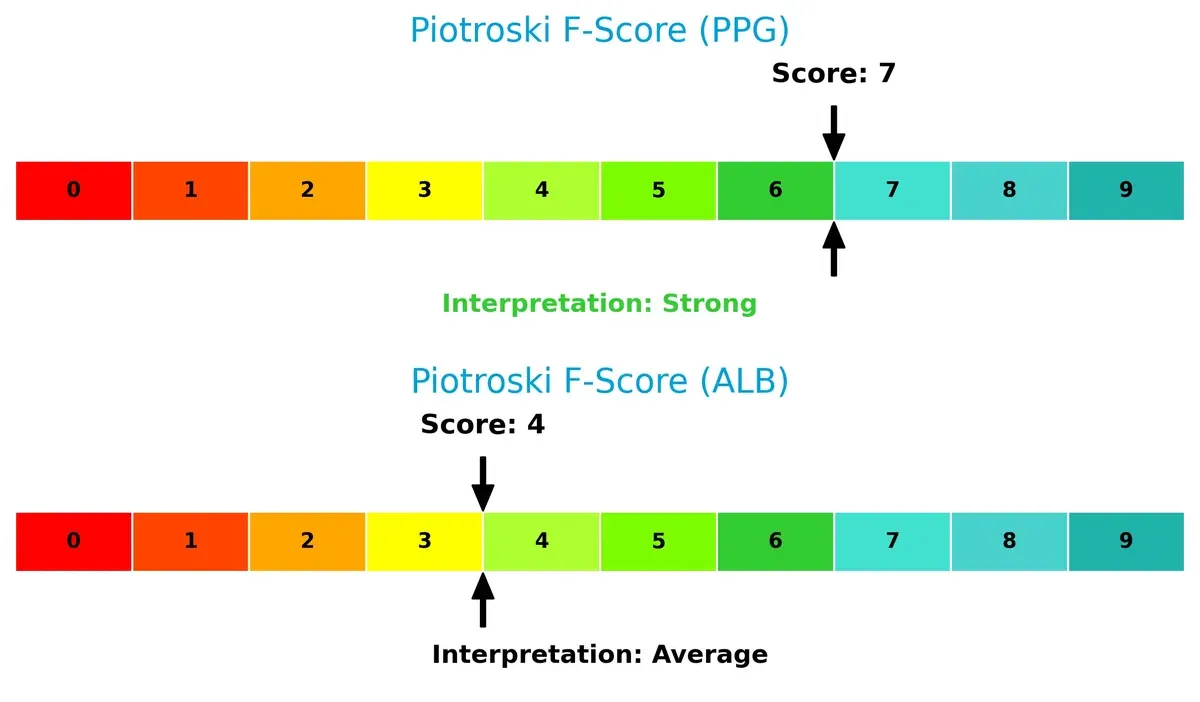
Financial Health: Quality of Operations
PPG’s Piotroski F-Score of 7 indicates strong financial health and operational quality, outperforming Albemarle’s average score of 4. Albemarle shows red flags in internal metrics relative to PPG’s stronger fundamentals:
How are the two companies positioned?
This section dissects PPG and Albemarle’s operational DNA by comparing their revenue distribution and internal dynamics. The goal is to confront their economic moats to identify which model holds the most resilient, sustainable advantage today.
Revenue Segmentation: The Strategic Mix
This visual comparison dissects how PPG Industries, Inc. and Albemarle Corporation diversify their income streams and where their primary sector bets lie:
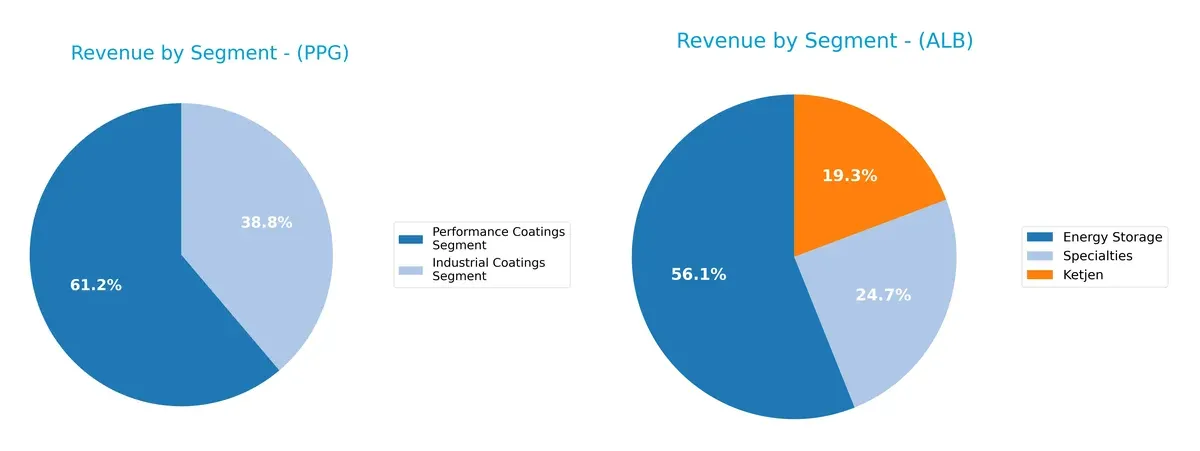
PPG anchors its revenue in two major segments: Performance Coatings at $11.16B and Industrial Coatings at $7.08B, showing a focused but balanced mix. Albemarle’s latest $3.02B Energy Storage leads alongside $1.33B Specialties and $1.04B Ketjen, reflecting a broader diversification. PPG’s concentration suggests deep infrastructure dominance, while Albemarle’s spread mitigates concentration risk but demands agile capital allocation.
Strengths and Weaknesses Comparison
This table compares the strengths and weaknesses of PPG and Albemarle Corporation based on diversification, profitability, financials, innovation, global presence, and market share:
PPG Strengths
- Diverse revenue streams from Industrial and Performance Coatings
- Favorable ROIC of 43.13% exceeding WACC
- Strong liquidity ratios above 1.2
- High asset turnover at 1.99
- Global footprint spanning North America, EMEA, Asia Pacific, Latin America
- Dividend yield of 2.71%
Albemarle Strengths
- Product diversification across Energy Storage, Ketjen, Specialties segments
- Favorable valuation multiples (PE and PB)
- Low debt-to-assets ratio at 21.77%
- Solid current and quick ratios near 1.2
- Significant foreign revenue exposure
- Dividend yield slightly higher at 3.08%
PPG Weaknesses
- Negative ROE at -44.48% signals poor equity returns
- High debt-to-assets ratio at 93.55% poses financial risk
- Unfavorable fixed asset turnover at 0
- Neutral net margin at 9.93% indicates modest profitability
Albemarle Weaknesses
- Negative net margin at -21.93% indicates losses
- Negative ROE and ROIC reflect operational inefficiency
- Interest coverage negative at -3.61 signals debt servicing issues
- Low asset and fixed asset turnover ratios below 1
PPG shows financial strength with strong returns and global reach but carries high leverage risk. Albemarle offers product diversity and low leverage but struggles with profitability and operational efficiency, which could pressure its strategic focus.
The Moat Duel: Analyzing Competitive Defensibility
A structural moat is the only true shield protecting long-term profits from relentless competitive erosion. Let’s break down the battle between two specialty chemical giants:
PPG Industries, Inc.: Durable Value Creator with Operational Excellence
PPG’s moat stems from its cost advantage and intangible assets in specialty coatings. This manifests in a stellar ROIC exceeding WACC by 35%, with a soaring ROIC trend of 441%. In 2026, expanding aerospace coatings and industrial services could reinforce its margin stability and competitive edge.
Albemarle Corporation: Struggling with Value Destruction Despite Market Potential
Albemarle’s moat relies on its lithium segment’s resource control, contrasting PPG’s diversified advantage. Yet, its ROIC trails WACC by 21%, with a sharply declining trend. The 2026 outlook hinges on recovering lithium demand and innovation in battery materials to reverse profitability erosion.
Moat Strength: Cost Leadership vs. Resource Dependency
PPG wields a wider, deeper moat through consistent value creation and expanding operational efficiency. Albemarle’s shrinking profitability and negative ROIC trend signal weaker defense mechanisms. PPG stands better positioned to sustain and protect its market share amid industry volatility.
Which stock offers better returns?
The past year saw divergent stock movements: PPG Industries faced a marked decline with recent recovery, while Albemarle surged strongly with accelerating gains.
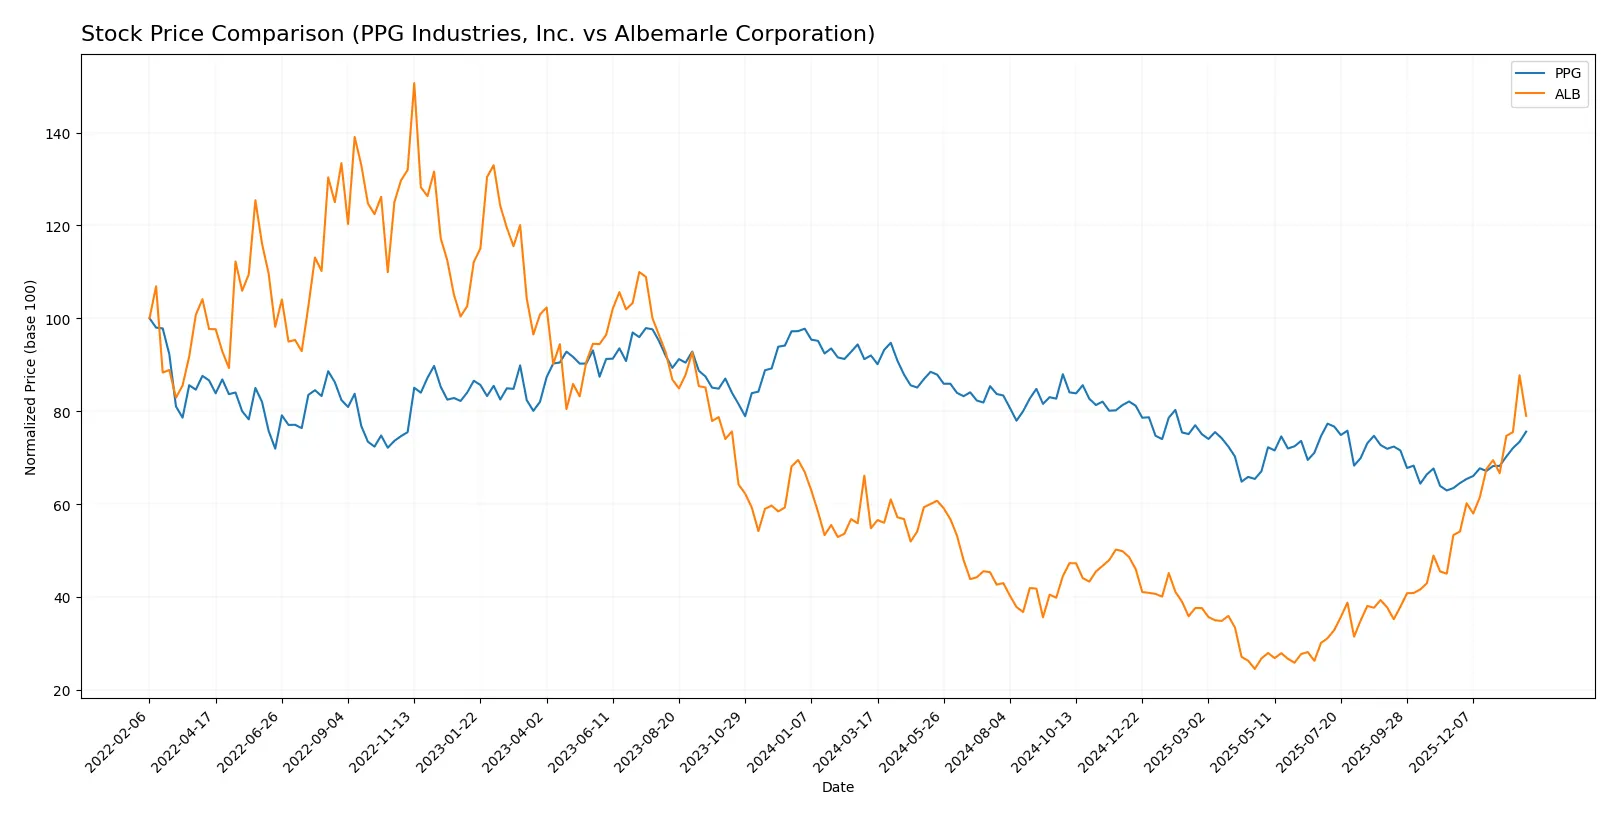
Trend Comparison
PPG Industries shows a 17.84% price decline over the past year, marking a bearish trend with accelerating downward momentum and a price range from 144.9 to 96.25. Albemarle Corporation gained 44.2% in the same period, demonstrating a bullish trend with acceleration and a wide price range from 52.91 to 189.51. Albemarle outperformed PPG decisively, delivering the highest market returns and stronger upward momentum over the last 12 months.
Target Prices
Analysts project solid upside potential for PPG Industries and Albemarle Corporation based on current consensus targets.
| Company | Target Low | Target High | Consensus |
|---|---|---|---|
| PPG Industries, Inc. | 115 | 135 | 126 |
| Albemarle Corporation | 136 | 210 | 184 |
PPG’s consensus target of 126 suggests modest upside from its 115.63 price, reflecting stable specialty chemicals demand. Albemarle’s target at 184 indicates significant upside from 170.63, driven by growth in lithium and specialty chemicals markets.

Don’t Let Luck Decide Your Entry Point
Optimize your entry points with our advanced ProRealTime indicators. You’ll get efficient buy signals with precise price targets for maximum performance. Start outperforming now!
How do institutions grade them?
The following tables summarize the latest reliable institutional grades for both companies:
PPG Industries, Inc. Grades
This table lists recent grades from top-tier financial institutions for PPG Industries, Inc.:
| Grading Company | Action | New Grade | Date |
|---|---|---|---|
| UBS | Maintain | Neutral | 2026-01-29 |
| JP Morgan | Maintain | Overweight | 2026-01-29 |
| Jefferies | Maintain | Hold | 2026-01-29 |
| Citigroup | Maintain | Buy | 2026-01-29 |
| Wells Fargo | Maintain | Overweight | 2026-01-29 |
| RBC Capital | Maintain | Sector Perform | 2026-01-29 |
| Goldman Sachs | Maintain | Buy | 2026-01-29 |
| Mizuho | Maintain | Outperform | 2026-01-28 |
Albemarle Corporation Grades
This table presents the latest institutional grades for Albemarle Corporation from leading firms:
| Grading Company | Action | New Grade | Date |
|---|---|---|---|
| JP Morgan | Maintain | Neutral | 2026-01-28 |
| Jefferies | Maintain | Buy | 2026-01-28 |
| Wells Fargo | Maintain | Equal Weight | 2026-01-26 |
| Truist Securities | Upgrade | Buy | 2026-01-21 |
| Citigroup | Maintain | Neutral | 2026-01-21 |
| Oppenheimer | Maintain | Outperform | 2026-01-21 |
| Deutsche Bank | Upgrade | Buy | 2026-01-13 |
| UBS | Maintain | Buy | 2026-01-12 |
| Mizuho | Maintain | Neutral | 2026-01-12 |
| Scotiabank | Upgrade | Sector Outperform | 2026-01-12 |
Which company has the best grades?
Albemarle Corporation shows a stronger upgrade trend and more buy-oriented grades compared to PPG Industries, which mostly holds neutral to overweight ratings. This divergence may influence investor sentiment and portfolio positioning.
Risks specific to each company
The following categories identify the critical pressure points and systemic threats facing both firms in the 2026 market environment:
1. Market & Competition
PPG Industries, Inc.
- Faces intense competition in specialty coatings with stable market share but margin pressure.
Albemarle Corporation
- Operates in lithium and specialty chemicals amid volatile EV battery demand and aggressive rivals.
2. Capital Structure & Debt
PPG Industries, Inc.
- High debt-to-assets ratio (93.55%) signals leverage risk despite strong interest coverage.
Albemarle Corporation
- Lower leverage (21.77%) but weak interest coverage (-3.61) raises refinancing concerns.
3. Stock Volatility
PPG Industries, Inc.
- Beta of 1.16 indicates moderate sensitivity to market swings with steady trading volume.
Albemarle Corporation
- Higher beta at 1.41 reflects elevated volatility and larger price swings recently.
4. Regulatory & Legal
PPG Industries, Inc.
- Subject to environmental regulations on coatings and chemical emissions globally.
Albemarle Corporation
- Faces stringent regulations in lithium extraction and chemical handling impacting costs.
5. Supply Chain & Operations
PPG Industries, Inc.
- Relies on complex raw material sourcing but diversified end-markets mitigate risk.
Albemarle Corporation
- Supply chain vulnerable due to dependency on lithium raw materials and geopolitical sourcing risks.
6. ESG & Climate Transition
PPG Industries, Inc.
- Investing in sustainable coatings but transition risks persist in carbon-intensive operations.
Albemarle Corporation
- High ESG pressure due to lithium mining environmental impact and transition to green energy markets.
7. Geopolitical Exposure
PPG Industries, Inc.
- Mainly U.S.-based with global sales; moderate geopolitical risks from international trade tensions.
Albemarle Corporation
- Significant exposure to geopolitical instability affecting lithium supply chains and export controls.
Which company shows a better risk-adjusted profile?
PPG’s greatest risk is its heavy leverage amid favorable operational metrics, while Albemarle’s main concern lies in profitability and operational weakness. PPG’s stronger Altman Z-Score (4.7 vs. Albemarle’s 2.9) and higher Piotroski score reflect better financial resilience. Albemarle’s sharp 5.6% recent share price drop highlights market anxiety over lithium demand and regulatory challenges. Overall, PPG presents a more balanced risk-adjusted profile despite debt concerns.
Final Verdict: Which stock to choose?
PPG Industries, Inc. stands out as a cash-efficient powerhouse with a very favorable moat, consistently generating returns well above its cost of capital. Its main point of vigilance lies in its high financial leverage, which could amplify risk during downturns. PPG suits portfolios targeting stable, value-creating industrial leaders.
Albemarle Corporation offers a strategic moat rooted in its position within specialty chemicals, though recent performance signals challenges with declining profitability and value destruction. Its lower leverage and higher liquidity provide a safety cushion relative to PPG. Albemarle fits investors seeking turnaround potential within cyclical, growth-oriented sectors.
If you prioritize durable value creation and efficiency underpinned by strong capital allocation, PPG outshines as the compelling choice due to its robust moat and cash flow profile. However, if you seek aggressive growth exposure with a willingness to tolerate heightened volatility, Albemarle offers superior upside potential despite its current financial headwinds and risk profile.
Disclaimer: Investment carries a risk of loss of initial capital. The past performance is not a reliable indicator of future results. Be sure to understand risks before making an investment decision.
Go Further
I encourage you to read the complete analyses of PPG Industries, Inc. and Albemarle Corporation to enhance your investment decisions: