Home > Comparison > Basic Materials > ALB vs LYB
The strategic rivalry between Albemarle Corporation and LyondellBasell Industries shapes the future of the Basic Materials sector. Albemarle focuses on engineered specialty chemicals, emphasizing lithium and catalysts, while LyondellBasell operates a capital-intensive, diversified chemical and refining model. This battle highlights a contrast between innovation-driven growth and scale-driven efficiency. This analysis aims to identify which trajectory offers superior risk-adjusted returns for a diversified portfolio in today’s market environment.
Table of contents
Companies Overview
Albemarle and LyondellBasell stand as pivotal forces in the specialty chemicals industry, shaping global markets.
Albemarle Corporation: Leader in Engineered Specialty Chemicals
Albemarle commands a strong position in lithium and specialty chemicals. It generates revenue primarily from lithium compounds for batteries, bromine-based fire safety solutions, and catalysts for petroleum refining. In 2026, Albemarle focuses strategically on advancing lithium technologies to meet growing demand in electric vehicles and energy storage.
LyondellBasell Industries N.V.: Global Polyolefins and Refining Powerhouse
LyondellBasell excels as a major producer of olefins, polyolefins, and refining products worldwide. Its revenue streams stem from polyethylene, polypropylene, and chemical intermediates. The company’s 2026 strategy emphasizes expanding advanced polymer solutions and refining capabilities to capture diverse industrial markets.
Strategic Collision: Similarities & Divergences
Both firms operate in specialty chemicals but diverge sharply in focus: Albemarle targets high-growth lithium and catalysts, while LyondellBasell leverages scale in polyolefins and refining. Their primary battleground lies in supplying materials for energy and manufacturing sectors. Albemarle offers a niche, innovation-driven profile; LyondellBasell presents a broad, scale-driven industrial play.
Income Statement Comparison
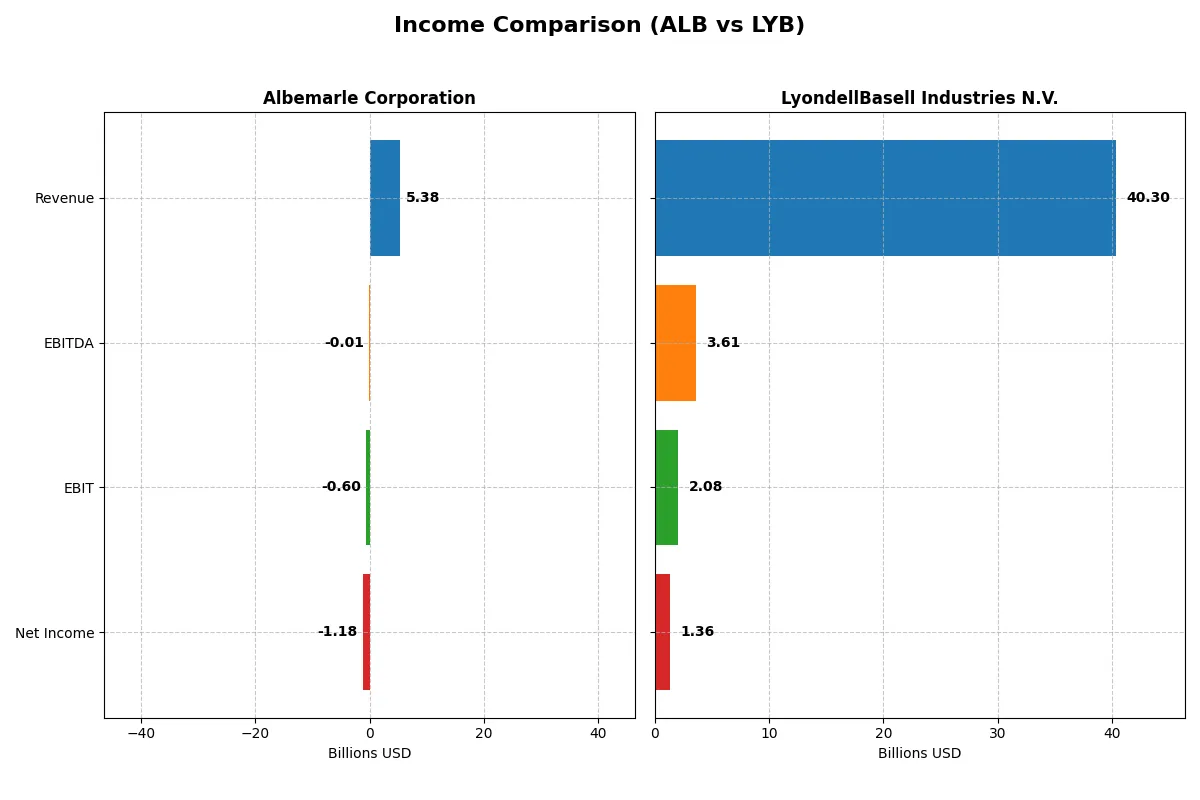
This data dissects the core profitability and scalability of both corporate engines to reveal who dominates the bottom line:
| Metric | Albemarle Corporation (ALB) | LyondellBasell Industries N.V. (LYB) |
|---|---|---|
| Revenue | 5.38B | 40.30B |
| Cost of Revenue | 5.29B | 35.74B |
| Operating Expenses | 1.86B | 2.75B |
| Gross Profit | 84.2M | 4.56B |
| EBITDA | -9.11M | 3.61B |
| EBIT | -598M | 2.08B |
| Interest Expense | 166M | 481M |
| Net Income | -1.18B | 1.36B |
| EPS | -11.2 | 4.16 |
| Fiscal Year | 2024 | 2024 |
Income Statement Analysis: The Bottom-Line Duel
The income statement comparison reveals each company’s ability to convert sales into profit, exposing operational strengths and weaknesses.
Albemarle Corporation Analysis
Albemarle’s revenue surged from 3.1B in 2020 to 9.6B in 2023 but plunged 44% to 5.4B in 2024. Net income swung from a 375M profit in 2020 to a 1.3B loss in 2024. Margins collapsed sharply; the 2024 gross margin fell to 1.6% and net margin to -22%, signaling severe operational distress and deteriorating profitability.
LyondellBasell Industries N.V. Analysis
LyondellBasell’s revenue climbed from 27.8B in 2020 to a peak of 50.5B in 2022, then declined modestly to 40.3B in 2024. Net income followed a similar pattern, peaking at 5.6B in 2021 before sliding to 1.35B in 2024. Margins remain healthier than Albemarle’s, with a 2024 gross margin of 11.3% and net margin of 3.4%, reflecting better cost control despite recent earnings pressure.
Margin Collapse vs. Resilient Scale
LyondellBasell maintains superior margin resilience and scale, with positive net income and stable gross profitability. Albemarle suffers a dramatic margin collapse and heavy net losses in 2024, undermining its recent revenue gains. For investors, LyondellBasell’s profile offers steadier profitability, while Albemarle’s risk profile has sharply increased due to operational inefficiency.
Financial Ratios Comparison
These vital ratios act as a diagnostic tool to expose the underlying fiscal health, valuation premiums, and capital efficiency of the companies compared below:
| Ratios | Albemarle Corporation (ALB) | LyondellBasell Industries N.V. (LYB) |
|---|---|---|
| ROE | -11.84% | 10.91% |
| ROIC | -11.81% | 5.15% |
| P/E | -8.58 | 17.75 |
| P/B | 1.02 | 1.94 |
| Current Ratio | 1.95 | 1.83 |
| Quick Ratio | 1.19 | 1.13 |
| D/E (Debt-to-Equity) | 0.36 | 1.04 |
| Debt-to-Assets | 21.77% | 36.15% |
| Interest Coverage | -10.73 | 3.78 |
| Asset Turnover | 0.32 | 1.13 |
| Fixed Asset Turnover | 0.57 | 2.44 |
| Payout Ratio | -26.39% | 126.47% |
| Dividend Yield | 3.08% | 7.13% |
| Fiscal Year | 2024 | 2024 |
Efficiency & Valuation Duel: The Vital Signs
Financial ratios serve as a company’s DNA, exposing hidden risks and revealing operational strengths essential for investor insights.
Albemarle Corporation
Albemarle shows weak profitability with negative ROE (-11.8%) and margins, reflecting operational struggles. Its valuation appears attractive with a low P/E (-8.58) and a modest P/B of 1.02. The firm returns value through a 3.08% dividend yield, signaling a shareholder-friendly approach amid reinvestment challenges.
LyondellBasell Industries N.V.
LyondellBasell posts moderate profitability, with a 10.9% ROE and narrow positive margins (3.37%). Its valuation metrics, including a P/E of 17.75 and P/B of 1.94, suggest a fairly priced stock. The company balances shareholder returns with a 7.13% dividend yield, supported by efficient asset turnover and stable liquidity.
Valuation Appeal vs. Operational Resilience
Albemarle offers a cheaper valuation but suffers from negative profitability and coverage concerns. LyondellBasell commands a premium yet delivers steadier returns and operational efficiency. Investors prioritizing value might consider Albemarle, while those seeking stability and income may prefer LyondellBasell’s profile.
Which one offers the Superior Shareholder Reward?
I compare Albemarle Corporation (ALB) and LyondellBasell Industries (LYB) on dividends, payout ratios, and buybacks. ALB yields 3.08% but shows negative free cash flow in 2024, pressuring dividend sustainability. LYB delivers a robust 7.13% yield, backed by positive free cash flow of 6.1B and a payout ratio above 100%, signaling aggressive distribution. Both companies engage in buybacks, but LYB’s stronger cash flow supports higher returns. I find LYB’s model more sustainable and attractive for total shareholder return in 2026.
Comparative Score Analysis: The Strategic Profile
The radar chart reveals the fundamental DNA and strategic trade-offs of Albemarle Corporation and LyondellBasell Industries N.V.:
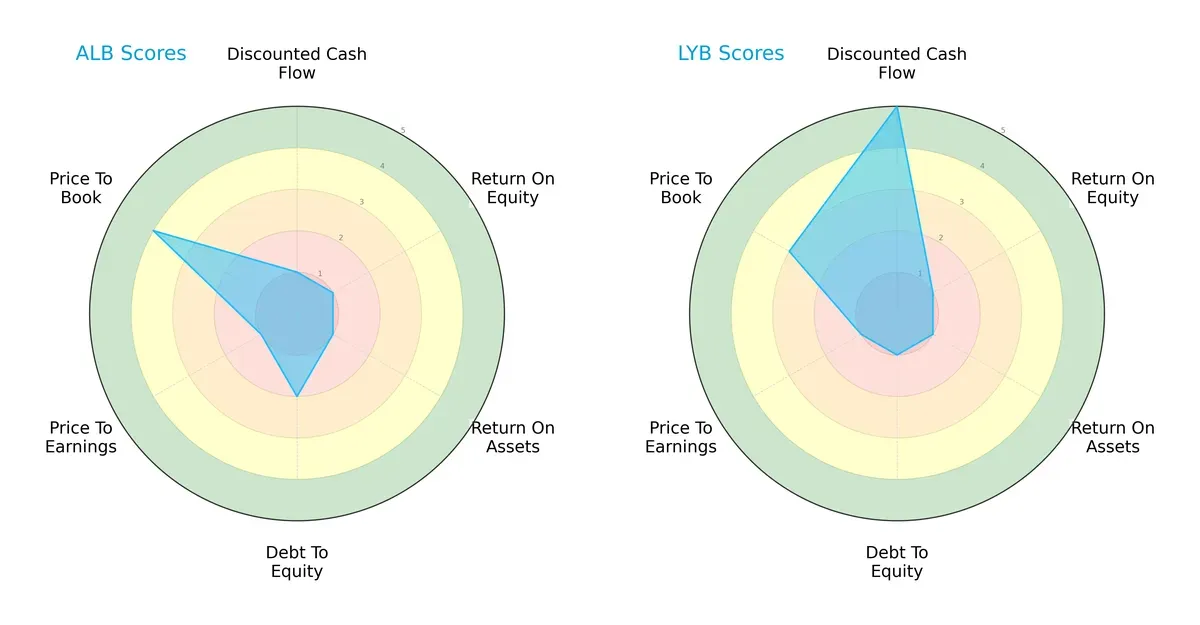
Albemarle shows a balanced profile with moderate debt management and favorable price-to-book valuation. LyondellBasell leverages a strong discounted cash flow score but struggles with high leverage and poor valuation metrics. Albemarle’s strength lies in financial stability, while LyondellBasell depends on cash flow efficiency.
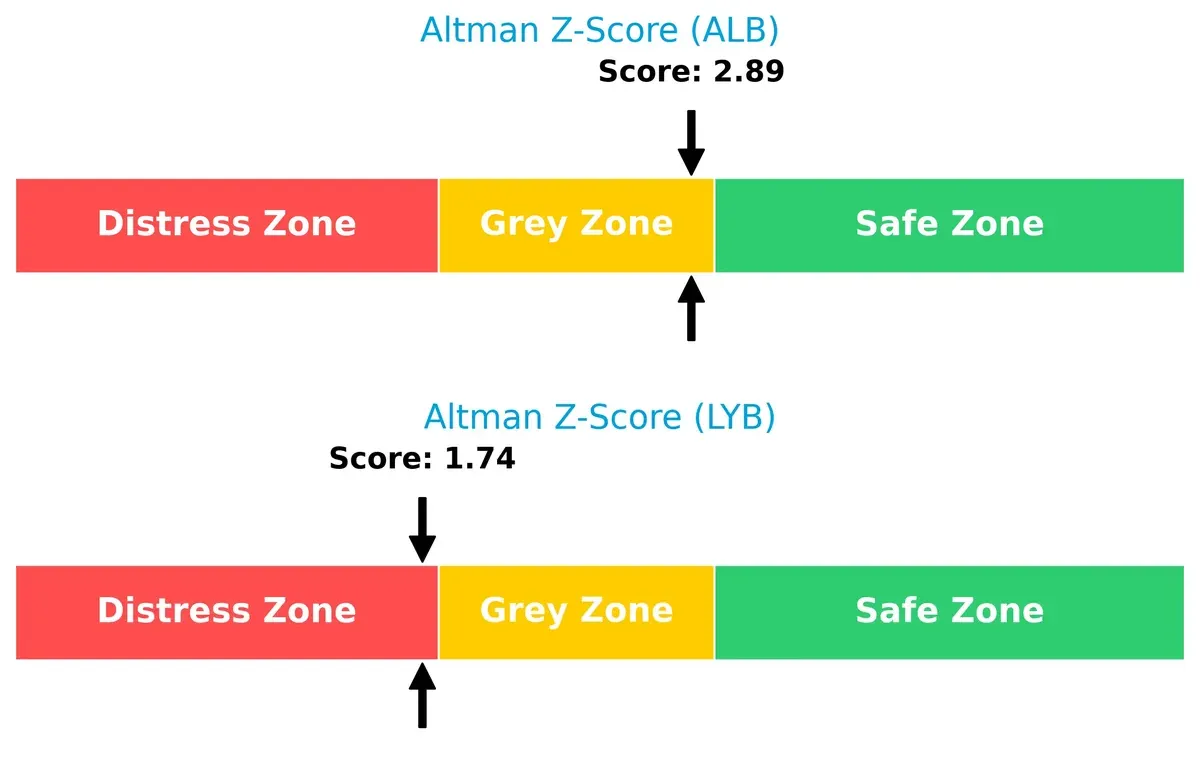
Bankruptcy Risk: Solvency Showdown
Albemarle’s Altman Z-Score of 2.89 places it in the grey zone, signaling moderate bankruptcy risk. LyondellBasell’s 1.74 score falls into the distress zone, indicating higher financial vulnerability in this cycle:
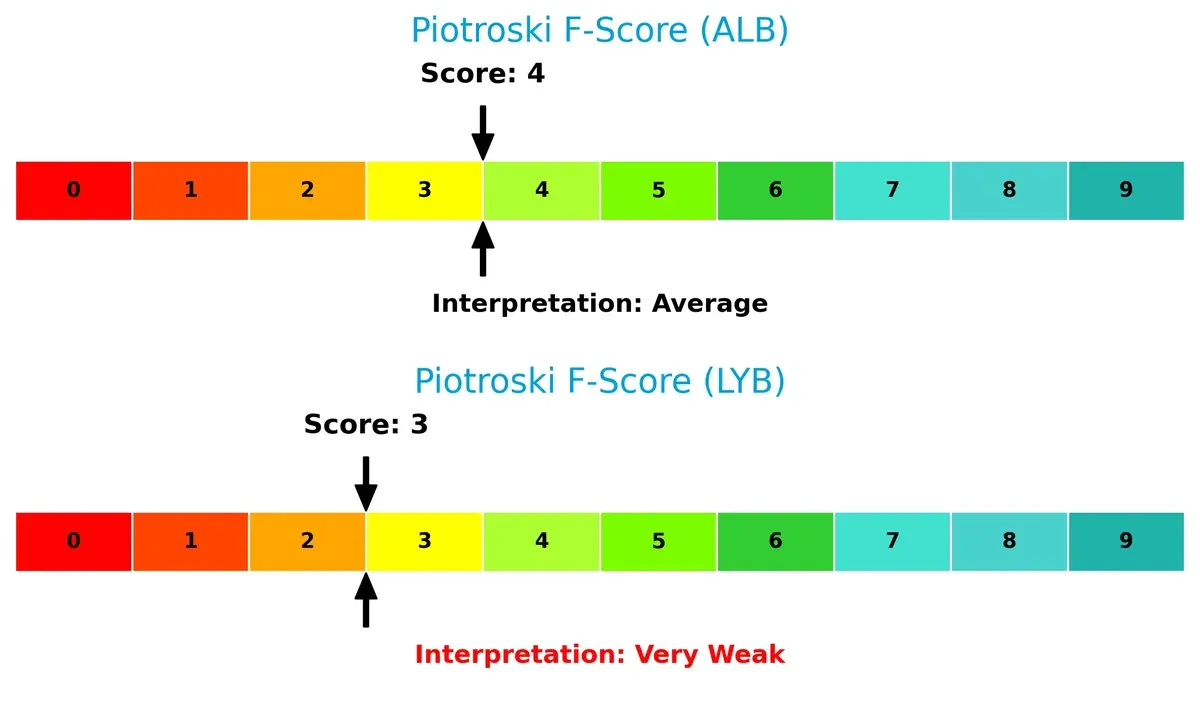
Financial Health: Quality of Operations
Albemarle’s Piotroski F-Score of 4 suggests average financial health, outperforming LyondellBasell’s weaker score of 3, which signals potential red flags in operational quality and financial robustness:
How are the two companies positioned?
This section dissects Albemarle and LyondellBasell’s operational DNA by comparing revenue distribution and internal dynamics. The goal is to confront their economic moats and identify which model offers the most resilient competitive advantage today.
Revenue Segmentation: The Strategic Mix
This visual comparison dissects how Albemarle Corporation and LyondellBasell diversify their income streams and where their primary sector bets lie:
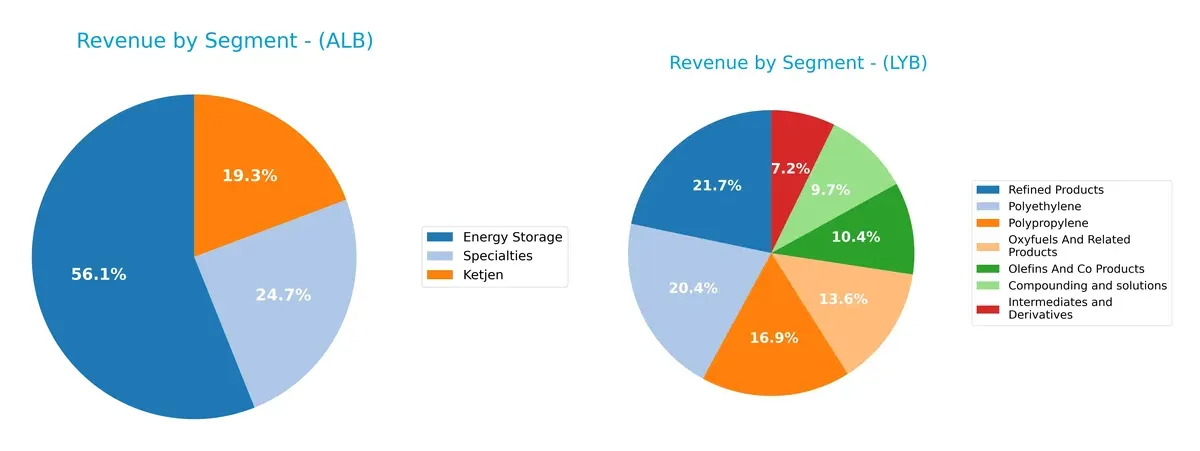
Albemarle’s 2024 revenue pivots around Energy Storage at $3B, Ketjen at $1B, and Specialties at $1.3B, showing moderate diversification. LyondellBasell dwarfs Albemarle with a broader mix, anchored by Refined Products at $8.1B, Polyethylene at $7.6B, and Polypropylene at $6.3B. LYB’s diversified portfolio reduces concentration risk, leveraging scale in petrochemicals, while ALB’s focus on energy storage signals a strategic bet on emerging tech markets.
Strengths and Weaknesses Comparison
This table compares the Strengths and Weaknesses of Albemarle Corporation (ALB) and LyondellBasell Industries N.V. (LYB):
ALB Strengths
- Favorable liquidity ratios with current ratio 1.95 and quick ratio 1.19
- Low debt to equity 0.36 and debt to assets 21.77%
- Diverse revenue streams including Energy Storage and Specialties
- Dividend yield at 3.08% supports shareholder returns
- Significant foreign revenue exposure over 4.4B
LYB Strengths
- Strong asset turnover at 1.13 indicating efficient use of assets
- Large scale with diversified product segments such as Polyethylene and Refined Products
- Solid interest coverage ratio of 4.33 provides financial flexibility
- Global presence with significant US revenue at 19.5B and broad European exposure
- Higher dividend yield at 7.13% reflects shareholder value focus
ALB Weaknesses
- Negative profitability metrics with net margin -21.93% and ROIC -11.81%
- Negative return on equity at -11.84% indicating operational challenges
- Negative interest coverage -3.61 signals risk in debt servicing
- Asset turnover low at 0.32 limiting capital efficiency
- PE ratio negative despite favorable status, reflecting losses
LYB Weaknesses
- High debt to equity of 1.04 increases financial risk
- Net margin low at 3.37% and ROIC only 5.15%, both neutral or unfavorable
- PE ratio moderate at 17.75, limiting valuation upside
- Moderate liquidity with current ratio 1.83 and quick ratio 1.13
- Debt to assets at 36.15% requires careful monitoring
Overall, ALB shows strengths in liquidity and lower leverage but faces significant profitability and operational efficiency headwinds. LYB demonstrates operational scale and efficiency with diversified global revenues but carries higher financial leverage and moderate profitability. Both companies possess slightly favorable financial profiles, presenting differing strategic challenges.
The Moat Duel: Analyzing Competitive Defensibility
A structural moat is the only true shield against the relentless erosion of profits by competition. Here’s how Albemarle Corporation and LyondellBasell Industries defend their turf:
Albemarle Corporation: Intangible Asset Moat Anchored in Lithium Chemistry
Albemarle’s core advantage lies in its proprietary lithium compounds, vital for EV batteries. This drives premium pricing but recent ROIC trends show severe decline, signaling value destruction. New battery chemistries in 2026 could deepen or disrupt its niche.
LyondellBasell Industries: Cost Advantage Through Scale and Integration
LyondellBasell leverages massive scale and integrated polyolefin production, maintaining stable margins despite industry cyclicality. Its steady ROIC trend hints at operational resilience. Expansion into advanced polymers may reinforce its cost moat in 2026.
Moat Battle: Proprietary Chemistry vs. Scale Efficiency
Albemarle’s intangible asset moat is deep but currently under pressure from declining capital efficiency. LyondellBasell’s cost advantage is broader and more stable, better equipping it to defend market share amid industry volatility.
Which stock offers better returns?
The past year shows starkly divergent price movements for Albemarle Corporation and LyondellBasell Industries. Albemarle’s stock surged strongly, while LyondellBasell’s price halved before a modest recent rebound.
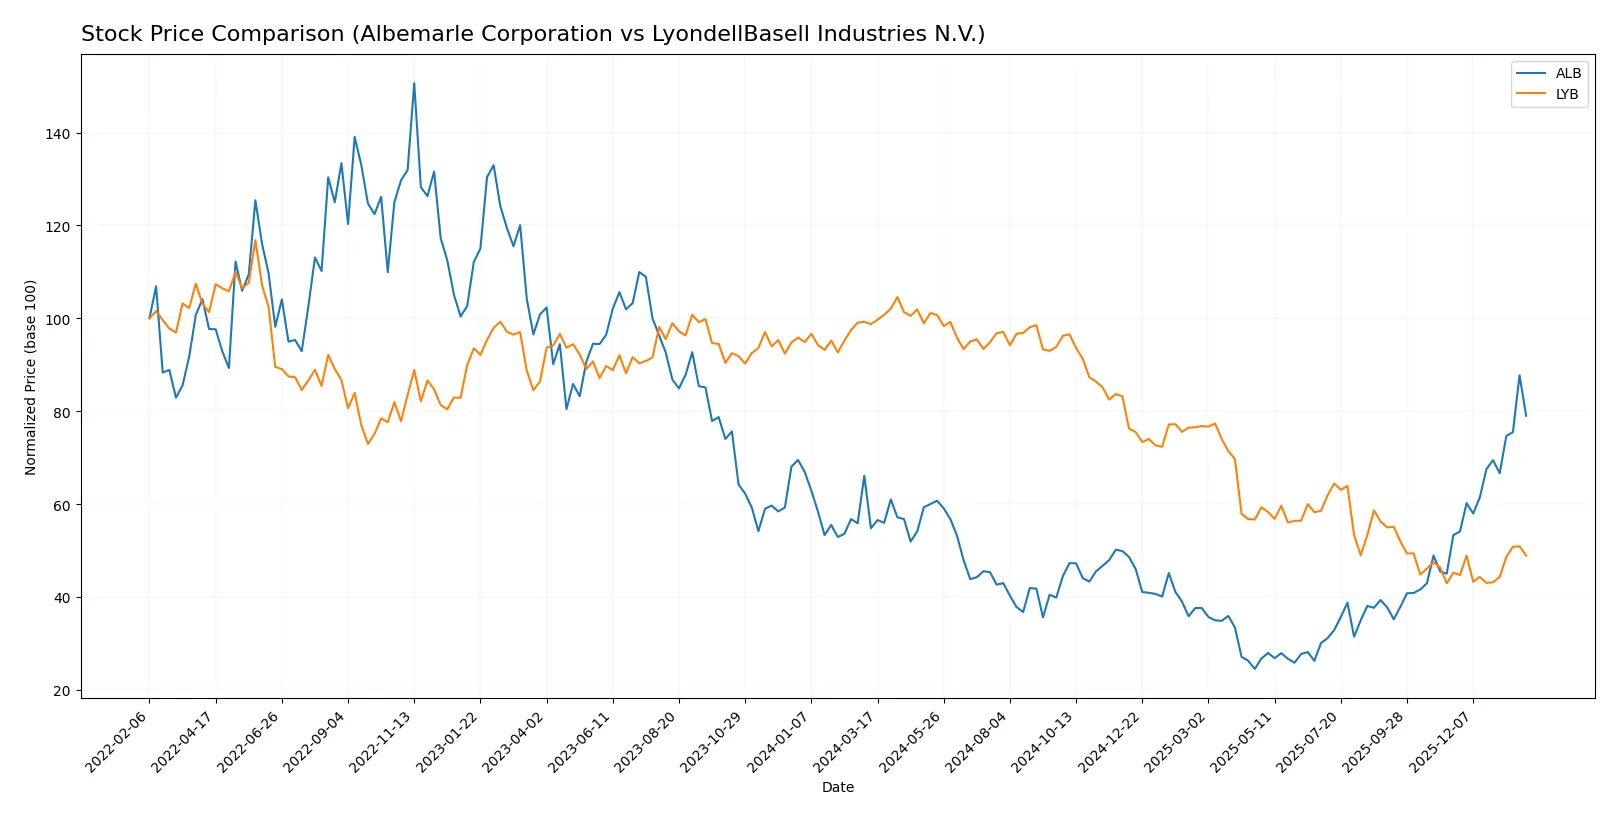
Trend Comparison
Albemarle’s stock gained 44.2% over the past 12 months, reflecting a bullish trend with accelerating momentum. It reached a high of 189.51 and a low of 52.91, showing significant price expansion and elevated volatility (27.2 std dev).
LyondellBasell’s stock declined 50.48% over the same period, indicating a bearish trend despite recent acceleration. It hit a peak of 104.78 and a trough of 43.02, with lower volatility (20.23 std dev) but a weak recovery of 8.17% recently.
Albemarle outperformed LyondellBasell with a strong upward trajectory versus LyondellBasell’s prolonged decline and only modest recent gains. Albemarle delivered the highest market performance in this comparison.
Target Prices
Analysts present a clear consensus on target prices for Albemarle Corporation and LyondellBasell Industries.
| Company | Target Low | Target High | Consensus |
|---|---|---|---|
| Albemarle Corporation | 136 | 210 | 184 |
| LyondellBasell Industries N.V. | 36 | 51 | 45.75 |
The target consensus for Albemarle at 184 implies upside from the current 170.63, signaling moderate growth expectations. LyondellBasell’s 45.75 target consensus is slightly below its current 49, suggesting some near-term caution.

Don’t Let Luck Decide Your Entry Point
Optimize your entry points with our advanced ProRealTime indicators. You’ll get efficient buy signals with precise price targets for maximum performance. Start outperforming now!
How do institutions grade them?
Here is a comparison of the recent institutional grades for Albemarle Corporation and LyondellBasell Industries N.V.:
Albemarle Corporation Grades
The table below summarizes recent grades from established financial institutions for Albemarle Corporation.
| Grading Company | Action | New Grade | Date |
|---|---|---|---|
| JP Morgan | Maintain | Neutral | 2026-01-28 |
| Jefferies | Maintain | Buy | 2026-01-28 |
| Wells Fargo | Maintain | Equal Weight | 2026-01-26 |
| Truist Securities | Upgrade | Buy | 2026-01-21 |
| Citigroup | Maintain | Neutral | 2026-01-21 |
| Oppenheimer | Maintain | Outperform | 2026-01-21 |
| Deutsche Bank | Upgrade | Buy | 2026-01-13 |
| UBS | Maintain | Buy | 2026-01-12 |
| Mizuho | Maintain | Neutral | 2026-01-12 |
| Scotiabank | Upgrade | Sector Outperform | 2026-01-12 |
LyondellBasell Industries N.V. Grades
The following table lists recent grades from credible financial institutions for LyondellBasell Industries N.V.
| Grading Company | Action | New Grade | Date |
|---|---|---|---|
| RBC Capital | Maintain | Sector Perform | 2026-01-16 |
| Citigroup | Maintain | Neutral | 2026-01-15 |
| UBS | Maintain | Sell | 2025-12-23 |
| Wells Fargo | Downgrade | Equal Weight | 2025-12-19 |
| Citigroup | Maintain | Neutral | 2025-12-18 |
| BMO Capital | Downgrade | Underperform | 2025-12-15 |
| Mizuho | Maintain | Neutral | 2025-12-11 |
| Citigroup | Maintain | Neutral | 2025-11-19 |
| Evercore ISI Group | Maintain | In Line | 2025-11-11 |
| Wells Fargo | Maintain | Overweight | 2025-11-03 |
Which company has the best grades?
Albemarle Corporation holds stronger grades overall, with multiple buy and outperform ratings. LyondellBasell’s grades skew neutral to underperform, indicating more cautious sentiment. Investors might view Albemarle as favored by analysts, potentially affecting confidence and share liquidity.
Risks specific to each company
The following categories identify the critical pressure points and systemic threats facing both firms in the 2026 market environment:
1. Market & Competition
Albemarle Corporation
- Faces intense competition in lithium and specialty chemicals, with volatile lithium demand impacting growth.
LyondellBasell Industries N.V.
- Operates in diversified chemical segments with stable demand but exposed to cyclical olefins and polyolefins markets.
2. Capital Structure & Debt
Albemarle Corporation
- Maintains moderate debt ratios (D/E 0.36), favorable liquidity (current ratio 1.95), but negative interest coverage signals stress.
LyondellBasell Industries N.V.
- High leverage (D/E 1.04) increases financial risk despite neutral interest coverage and stable liquidity.
3. Stock Volatility
Albemarle Corporation
- Beta at 1.41 shows above-market volatility, increasing risk during market downturns.
LyondellBasell Industries N.V.
- Beta at 0.74 indicates lower volatility, providing relative stability in turbulent markets.
4. Regulatory & Legal
Albemarle Corporation
- Lithium extraction faces rising environmental scrutiny and regulatory costs.
LyondellBasell Industries N.V.
- Chemical refining and plastics production exposed to tightening environmental regulations globally.
5. Supply Chain & Operations
Albemarle Corporation
- Reliant on stable lithium supply chains; geopolitical or logistic disruptions could impair production.
LyondellBasell Industries N.V.
- Complex global operations increase exposure to supply chain disruptions, especially in raw materials and energy.
6. ESG & Climate Transition
Albemarle Corporation
- Pressure to align lithium production with sustainable practices amidst rising ESG demands.
LyondellBasell Industries N.V.
- Faces challenges in reducing carbon footprint in petrochemical refining and plastics manufacturing.
7. Geopolitical Exposure
Albemarle Corporation
- Moderate exposure linked to lithium sourcing regions and trade policies.
LyondellBasell Industries N.V.
- Higher geopolitical risk due to multinational operations across sensitive regions like Europe, Asia, and Americas.
Which company shows a better risk-adjusted profile?
Albemarle’s most impactful risk lies in volatile lithium markets and operational leverage amid negative profitability and interest coverage. LyondellBasell’s principal risk stems from high financial leverage and geopolitical complexities. Despite Albemarle’s operational challenges, its lower debt and stronger liquidity give it a marginally better risk-adjusted profile. Recent data reveals Albemarle’s negative interest coverage (-3.61) as a red flag, while LyondellBasell’s Altman Z-score plunges into the distress zone (1.74), underscoring its elevated bankruptcy risk.
Final Verdict: Which stock to choose?
Albemarle’s superpower lies in its ability to generate strong operational cash flow despite recent setbacks. However, its declining profitability and value destruction signal a key point of vigilance. It suits portfolios that can tolerate cyclical volatility and seek turnaround potential.
LyondellBasell benefits from a strategic moat in efficient asset utilization and consistent free cash flow generation. Its balance sheet shows more stability than Albemarle’s, offering a comparatively safer profile. It fits well in portfolios focused on steady income and moderate growth.
If you prioritize aggressive growth and can manage higher risk, Albemarle’s rebound potential outshines LyondellBasell’s steadiness. However, if you seek better financial stability and reliable cash generation, LyondellBasell offers a more prudent scenario despite its recent price weakness.
Disclaimer: Investment carries a risk of loss of initial capital. The past performance is not a reliable indicator of future results. Be sure to understand risks before making an investment decision.
Go Further
I encourage you to read the complete analyses of Albemarle Corporation and LyondellBasell Industries N.V. to enhance your investment decisions: