Home > Comparison > Basic Materials > LIN vs ALB
The strategic rivalry between Linde plc and Albemarle Corporation shapes the specialty chemicals landscape. Linde, a capital-intensive industrial gas and engineering leader, contrasts with Albemarle’s focus on engineered specialty chemicals and high-growth lithium markets. This head-to-head pits a diversified industrial giant against a niche innovator. This analysis aims to identify which trajectory delivers the superior risk-adjusted return potential for a balanced, diversified portfolio in Basic Materials.

Table of contents
Companies Overview
Linde plc and Albemarle Corporation are pivotal players in the specialty chemicals industry, shaping global industrial processes and advanced materials.
Linde plc: Industrial Gas and Engineering Giant
Linde plc dominates as a leading industrial gas and engineering company. It generates revenue by supplying atmospheric and process gases to diverse sectors including healthcare, energy, and manufacturing. In 2026, Linde emphasizes expanding turnkey process plant construction, reinforcing its competitive edge through integrated gas solutions worldwide.
Albemarle Corporation: Specialty Chemicals Innovator
Albemarle Corporation specializes in engineered specialty chemicals with core revenue from lithium compounds, bromine products, and catalysts. Its 2026 strategy focuses on advancing lithium chemical production to meet growing demand in energy storage and electric vehicles, positioning Albemarle as a key supplier in evolving clean energy markets.
Strategic Collision: Similarities & Divergences
Both companies operate in the specialty chemicals space but pursue distinct philosophies. Linde prioritizes a closed ecosystem through integrated gas and plant engineering services. Albemarle adopts an open innovation model focused on chemical specialties like lithium. Their primary battleground lies in supplying materials critical to energy and industrial transformation, each offering unique investment profiles shaped by scale and market focus.
Income Statement Comparison
This data dissects the core profitability and scalability of both corporate engines to reveal who dominates the bottom line:
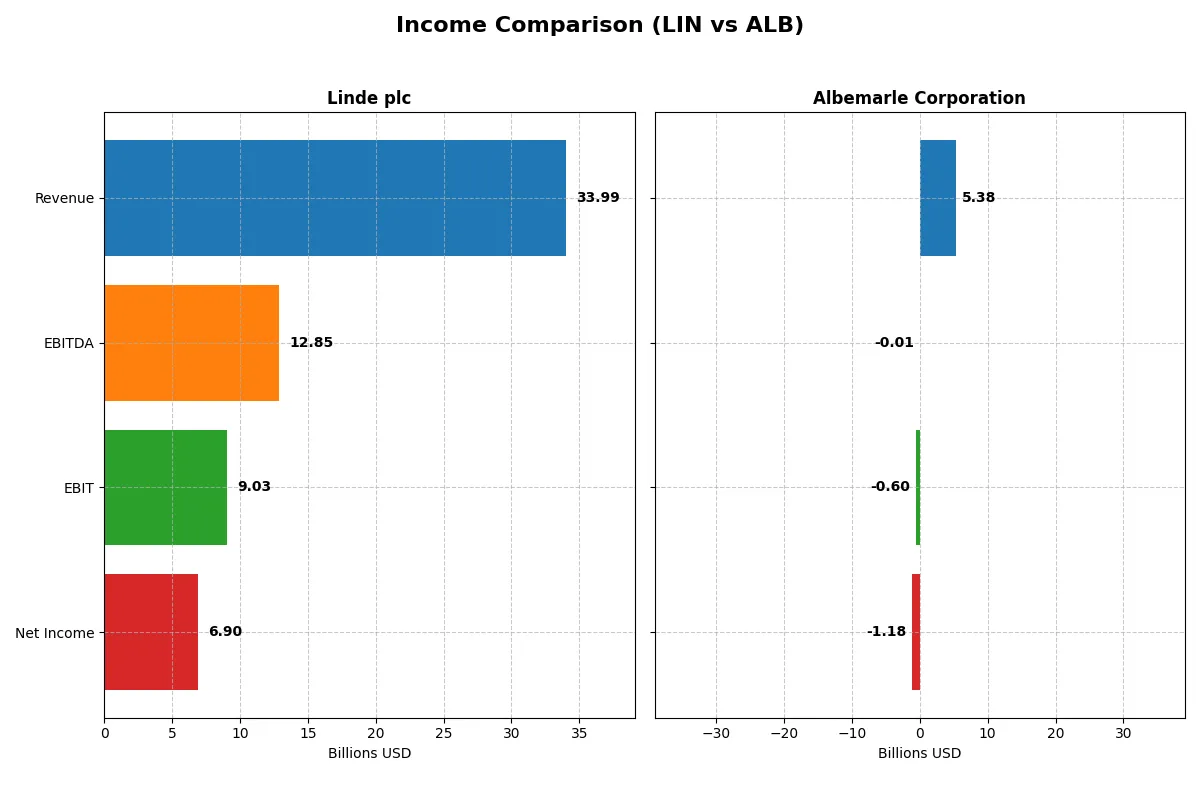
| Metric | Linde plc (LIN) | Albemarle Corporation (ALB) |
|---|---|---|
| Revenue | 33.99B | 5.38B |
| Cost of Revenue | 19.26B | 5.29B |
| Operating Expenses | 5.79B | 1.86B |
| Gross Profit | 14.73B | 84.2M |
| EBITDA | 12.85B | -9.11M |
| EBIT | 9.03B | -598M |
| Interest Expense | 212M | 166M |
| Net Income | 6.90B | -1.32B |
| EPS | 14.67 | -11.2 |
| Fiscal Year | 2025 | 2024 |
Income Statement Analysis: The Bottom-Line Duel
This income statement comparison reveals each company’s true operational efficiency and profitability trajectory through recent years.
Linde plc Analysis
Linde’s revenue rose steadily from 30.8B in 2021 to 34B in 2025, with net income climbing 80% over five years to 6.9B. Its gross margin, consistently above 40%, and a net margin over 20% demonstrate robust profitability. Despite a slight EBIT dip in 2025, earnings per share improved 7%, signaling strong momentum and operational efficiency.
Albemarle Corporation Analysis
Albemarle’s revenue increased from 3.3B in 2021 to a peak near 9.6B in 2023 but plunged 44% to 5.4B in 2024. The company swung from a 1.57% gross margin to a deeply negative net margin of -22%, with a net loss of 1.3B in 2024. This sharp decline reflects severe margin compression and operational challenges, eroding earnings and investor confidence.
Margin Strength vs. Revenue Volatility
Linde clearly outperforms with consistent revenue growth and healthy margins, maintaining operational resilience in a volatile market. Albemarle’s recent steep downturn in profitability and margin erosion marks it as the weaker performer. For investors, Linde’s stable earnings profile and margin discipline offer a more attractive and reliable investment foundation.
Financial Ratios Comparison
These vital ratios act as a diagnostic tool to expose the underlying fiscal health, valuation premiums, and capital efficiency of the companies compared below:
| Ratios | Linde plc (LIN) | Albemarle Corporation (ALB) |
|---|---|---|
| ROE | 17.2% | -11.8% |
| ROIC | 9.2% | -11.8% |
| P/E | 30.5 | -8.6 |
| P/B | 5.26 | 1.02 |
| Current Ratio | 0.89 | 1.95 |
| Quick Ratio | 0.76 | 1.19 |
| D/E (Debt-to-Equity) | 0.59 | 0.36 |
| Debt-to-Assets | 28.2% | 21.8% |
| Interest Coverage | 15.0 | -10.7 |
| Asset Turnover | 0.41 | 0.32 |
| Fixed Asset Turnover | 1.28 | 0.57 |
| Payout Ratio | 40.4% | -26.4% |
| Dividend Yield | 1.32% | 3.08% |
| Fiscal Year | 2024 | 2024 |
Efficiency & Valuation Duel: The Vital Signs
Financial ratios serve as a company’s DNA, exposing hidden risks and revealing operational excellence crucial to investment decisions.
Linde plc
Linde demonstrates strong profitability with a 17.23% ROE and a 19.89% net margin, signaling efficient core operations. However, its P/E of 30.53 and P/B of 5.26 suggest a stretched valuation. The company returns value with a 1.32% dividend yield, balancing shareholder rewards with moderate reinvestment.
Albemarle Corporation
Albemarle struggles with negative profitability metrics: -11.84% ROE and -21.93% net margin, reflecting operational challenges. The stock trades at a low P/B of 1.02 and a negative P/E, indicating undervaluation but increased risk. It offers a 3.08% dividend yield, favoring income distribution despite weak fundamentals.
Valuation Stretch vs. Profitability Struggles
Linde offers superior profitability and operational efficiency but carries a premium valuation. Albemarle presents a cheaper valuation and higher dividend yield yet suffers from negative returns and cash flow. Investors seeking stability may prefer Linde’s profile; those targeting yield amid risk might consider Albemarle.
Which one offers the Superior Shareholder Reward?
I observe that Linde plc (LIN) offers a balanced shareholder return through a consistent 1.3% dividend yield with a sustainable 40% payout ratio and moderate free cash flow coverage above 1.3x. Linde pairs steady dividends with disciplined buybacks, boosting returns. Albemarle Corporation (ALB), despite a higher 3.1% dividend yield, shows negative free cash flow and a volatile payout, undermining dividend sustainability. Albemarle’s weak operating margins and negative free cash flow raise red flags on buyback viability. Historically, Linde’s integrated distribution approach aligns better with long-term value creation. In 2026, I prefer Linde for superior total return potential and risk-managed shareholder rewards.
Comparative Score Analysis: The Strategic Profile
The radar chart reveals the fundamental DNA and trade-offs of Linde plc and Albemarle Corporation, highlighting their core financial strengths and vulnerabilities:
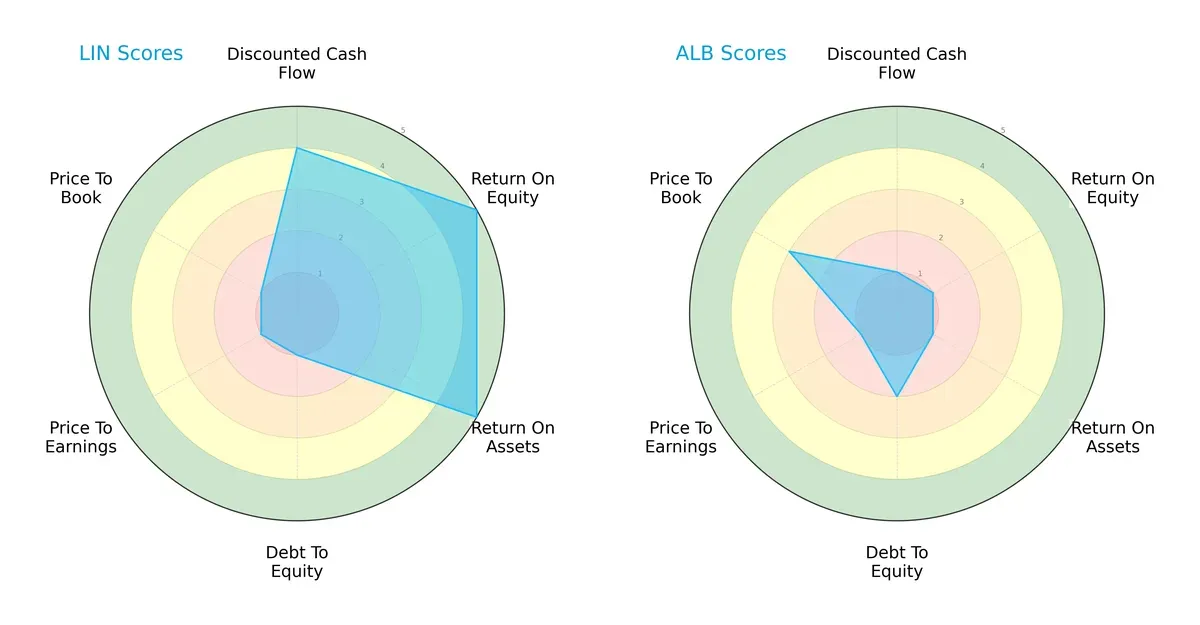
Linde boasts a balanced profile with strong DCF, ROE, and ROA scores, demonstrating efficient asset use and profitability. Albemarle leans heavily on its moderate price-to-book valuation but lags significantly in operational and valuation metrics. Linde’s financial robustness contrasts with Albemarle’s reliance on valuation edges, exposing greater risk.
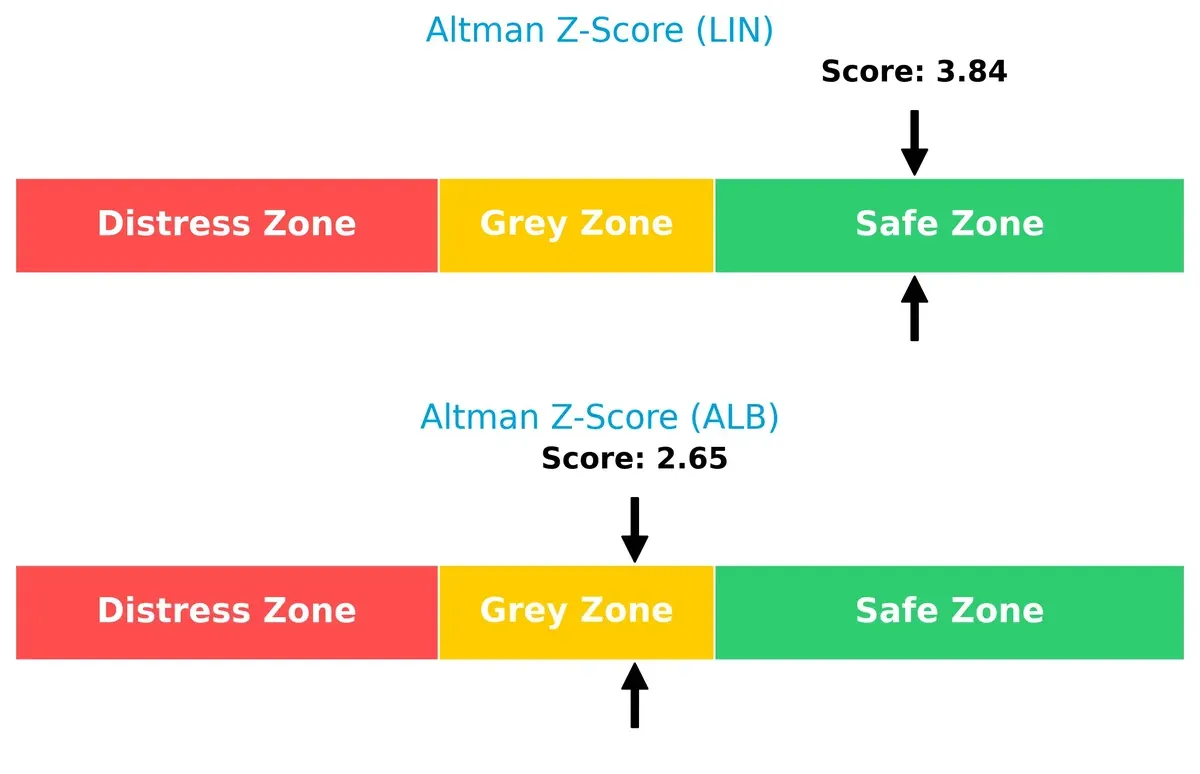
Bankruptcy Risk: Solvency Showdown
Linde’s Altman Z-score of 3.84 places it firmly in the safe zone, signaling strong long-term solvency. Albemarle’s 2.65 score lands in the grey zone, indicating moderate bankruptcy risk amid current market cycles:
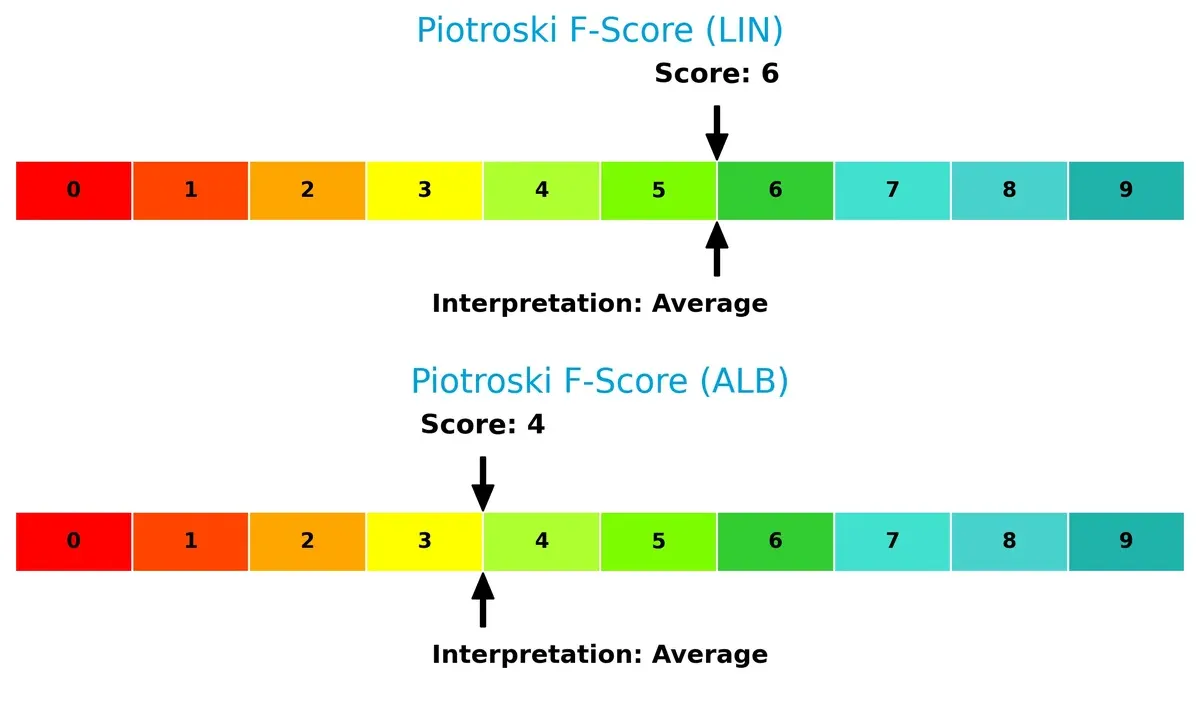
Financial Health: Quality of Operations
Both companies report average Piotroski F-Scores, with Linde at 6 and Albemarle at 4. Linde’s higher score indicates stronger internal financial health, while Albemarle shows potential red flags in operational efficiency and liquidity:
How are the two companies positioned?
This section dissects LIN and ALB’s operational DNA by comparing revenue distribution and internal dynamics. The goal is to confront their economic moats to reveal which model offers a more resilient, sustainable advantage today.
Revenue Segmentation: The Strategic Mix
This visual comparison dissects how Linde plc and Albemarle Corporation diversify their income streams and where their primary sector bets lie:
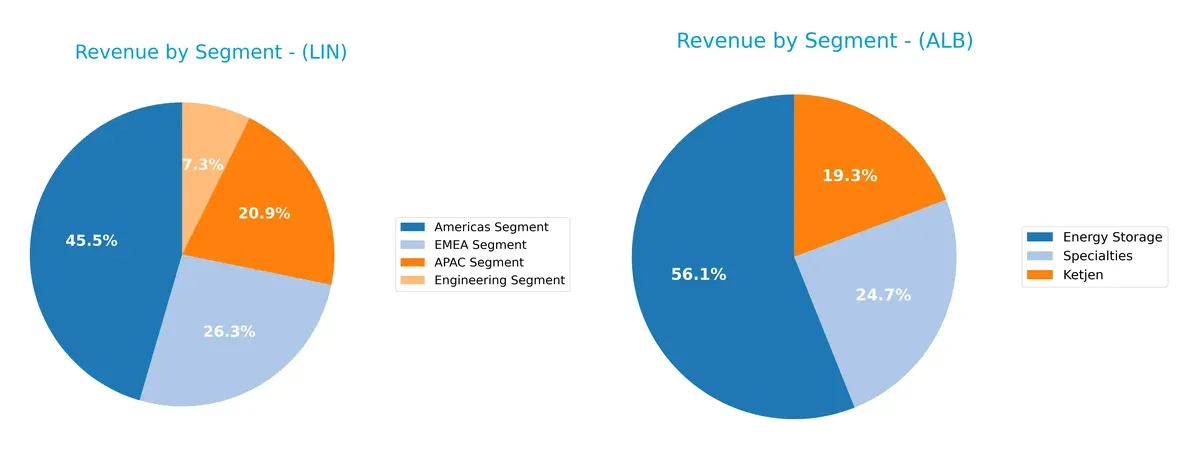
Linde’s revenue anchors heavily on the Americas Segment at $14.4B, complemented by strong EMEA ($8.4B) and APAC ($6.6B) segments, showing a geographically diversified industrial base. Albemarle pivots around Energy Storage ($3B) with smaller bets in Ketjen ($1B) and Specialties ($1.3B), revealing concentration in lithium-related growth areas. Linde’s broad footprint mitigates regional risk, while Albemarle’s focus signals higher exposure to commodity cycles but benefits from electric vehicle demand.
Strengths and Weaknesses Comparison
This table compares the Strengths and Weaknesses of Linde plc and Albemarle Corporation:
Linde plc Strengths
- Diversified revenue across Americas, EMEA, APAC, and Engineering segments
- Favorable net margin near 20% and ROE above 17%
- Strong interest coverage at 42.6 indicating solid debt servicing
Albemarle Corporation Strengths
- Favorable valuation multiples with PE and PB ratios near 1
- Strong liquidity ratios: current ratio 1.95 and quick ratio 1.19
- Favorable debt-to-assets at 21.77% and low debt-to-equity of 0.36
Linde plc Weaknesses
- Unfavorable liquidity ratios: current ratio 0.89 and quick ratio 0.76 under 1
- High PE and PB ratios suggest expensive valuation
- Lower asset turnover at 0.41 limits capital efficiency
Albemarle Corporation Weaknesses
- Negative profitability metrics with net margin -21.93% and ROE -11.84%
- Negative interest coverage at -3.61 signals risk in covering interest expenses
- Low asset turnover and fixed asset turnover below 1 reduce operational efficiency
Linde’s broad geographic and segment diversification supports steady profitability and strong debt management. Albemarle shows better liquidity and valuation but struggles with profitability and operating efficiency. These factors shape distinct strategic focuses for both companies.
The Moat Duel: Analyzing Competitive Defensibility
A structural moat is the sole barrier guarding long-term profits from competitors’ erosion and market pressures. Let’s dissect the moats of two specialty chemicals giants:
Linde plc: Engineering Scale and Process Integration
Linde’s moat stems from its cost advantage and industrial scale, reflected in a solid 26.6% EBIT margin and 20.3% net margin. Its growing ROIC trend signals rising profitability. Expansion into hydrogen and advanced gas technologies in 2026 should deepen its moat.
Albemarle Corporation: Resource-Dependent Specialty Chemicals
Albemarle relies on lithium and specialty chemical supply chains as its moat, contrasting Linde’s scale. However, declining ROIC and negative margins indicate weak capital efficiency. Market volatility in lithium pricing threatens its competitive edge, though evolving battery demand offers growth potential.
Verdict: Cost Leadership vs. Resource Volatility
Linde holds the deeper moat with rising ROIC and robust margins, signaling superior capital allocation and operational efficiency. Albemarle’s shrinking profitability and value destruction leave it vulnerable. Linde is better positioned to defend and grow its market share in 2026.
Which stock offers better returns?
Over the past year, Linde plc’s stock trended downward overall with recent recovery, while Albemarle Corporation showed a strong and accelerating upward trajectory.
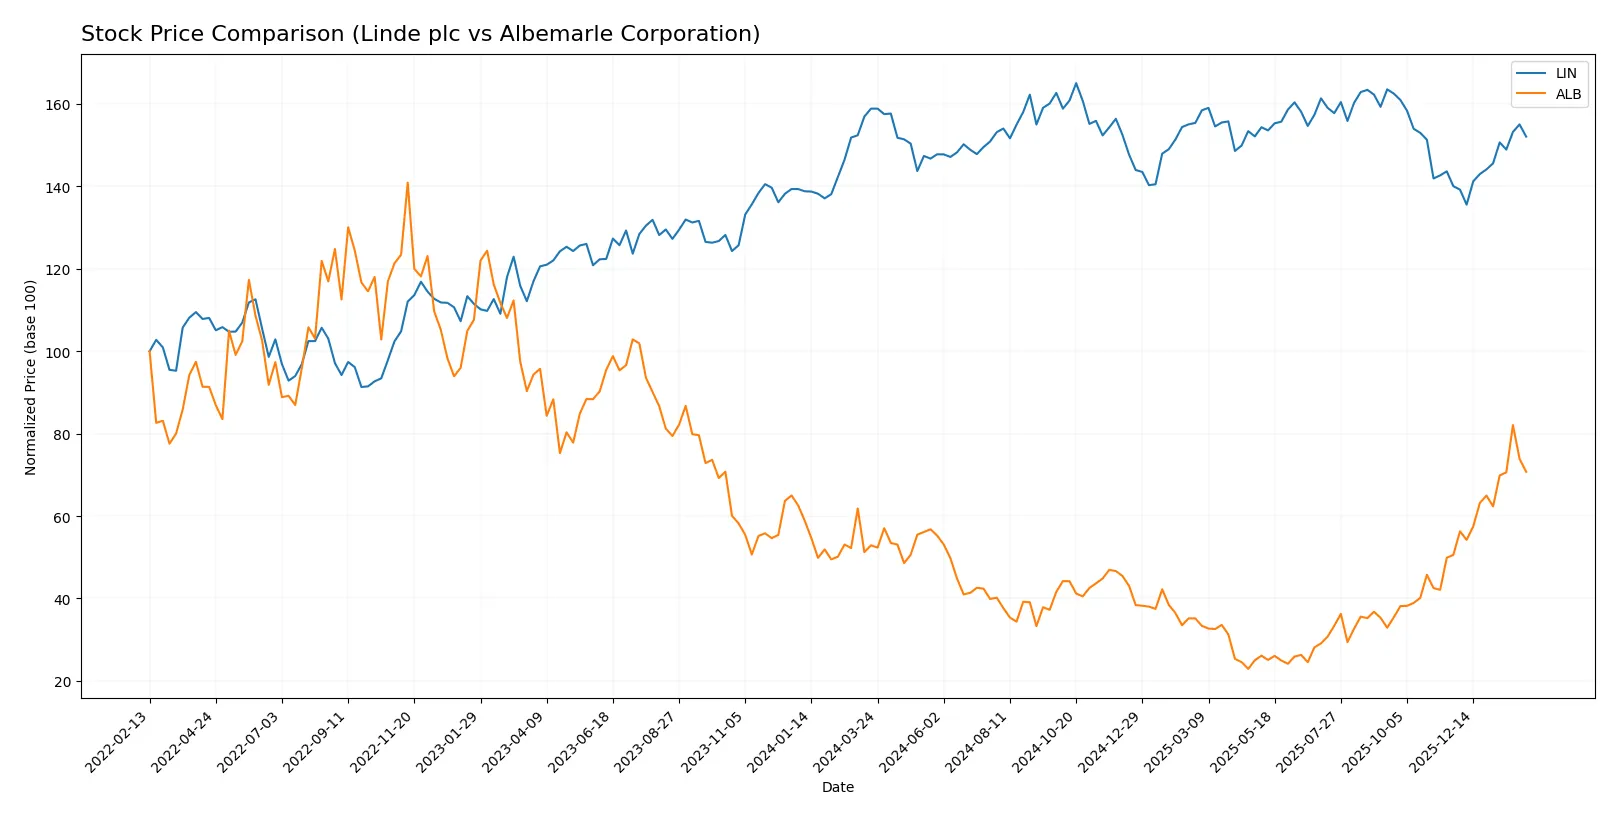
Trend Comparison
Linde plc’s stock declined 4.27% over the past 12 months, marking a bearish trend with accelerating losses and a high volatility of 19.05. The recent 2.5-month period reversed with an 8.6% gain.
Albemarle Corporation’s stock surged 33.76% over the same 12 months, showing a bullish trend with accelerating gains and higher volatility of 27.93. Its recent 2.5-month trend accelerated further with a 39.85% rise.
Comparing both, Albemarle’s stock clearly outperformed Linde’s, delivering the highest market return and stronger upward momentum throughout the year.
Target Prices
Analysts show a confident upside for both Linde plc and Albemarle Corporation based on current consensus targets.
| Company | Target Low | Target High | Consensus |
|---|---|---|---|
| Linde plc | 490 | 550 | 516 |
| Albemarle Corporation | 136 | 210 | 184 |
Linde’s consensus target of 516 suggests a 15% upside from its 448 current price. Albemarle’s 184 target implies a 13% potential gain above the 163 stock price.

Don’t Let Luck Decide Your Entry Point
Optimize your entry points with our advanced ProRealTime indicators. You’ll get efficient buy signals with precise price targets for maximum performance. Start outperforming now!
How do institutions grade them?
Linde plc Grades
The following table summarizes recent grades from established financial institutions for Linde plc:
| Grading Company | Action | New Grade | Date |
|---|---|---|---|
| JP Morgan | Downgrade | Neutral | 2026-02-06 |
| UBS | Maintain | Buy | 2026-02-06 |
| Citigroup | Maintain | Buy | 2026-02-06 |
| Citigroup | Maintain | Buy | 2026-01-21 |
| RBC Capital | Maintain | Outperform | 2025-12-12 |
| UBS | Upgrade | Buy | 2025-11-11 |
| RBC Capital | Maintain | Outperform | 2025-11-06 |
| B of A Securities | Maintain | Buy | 2025-11-03 |
| JP Morgan | Maintain | Overweight | 2025-11-03 |
| Seaport Global | Upgrade | Buy | 2025-11-03 |
Albemarle Corporation Grades
Here is a summary of recent grading actions from reputable firms for Albemarle Corporation:
| Grading Company | Action | New Grade | Date |
|---|---|---|---|
| Jefferies | Maintain | Buy | 2026-01-28 |
| JP Morgan | Maintain | Neutral | 2026-01-28 |
| Wells Fargo | Maintain | Equal Weight | 2026-01-26 |
| Oppenheimer | Maintain | Outperform | 2026-01-21 |
| Truist Securities | Upgrade | Buy | 2026-01-21 |
| Citigroup | Maintain | Neutral | 2026-01-21 |
| Deutsche Bank | Upgrade | Buy | 2026-01-13 |
| Mizuho | Maintain | Neutral | 2026-01-12 |
| UBS | Maintain | Buy | 2026-01-12 |
| Scotiabank | Upgrade | Sector Outperform | 2026-01-12 |
Which company has the best grades?
Both companies show strong institutional support with several buy and outperform ratings. Albemarle has more recent upgrades to buy and sector outperform, suggesting slightly stronger momentum. Linde maintains consistent buy and outperform grades but faced a recent downgrade to neutral from JP Morgan. Investors may weigh these nuances in sentiment when assessing risk and opportunity.
Risks specific to each company
The following categories identify the critical pressure points and systemic threats facing both firms in the 2026 market environment:
1. Market & Competition
Linde plc
- Operates globally in industrial gases with steady demand but faces competition from Air Products and others.
Albemarle Corporation
- Specializes in lithium and specialty chemicals with exposure to volatile EV battery market and aggressive competitors like SQM.
2. Capital Structure & Debt
Linde plc
- Moderate debt-to-equity ratio (0.59) with strong interest coverage (42.6x) signals manageable leverage.
Albemarle Corporation
- Lower leverage (D/E 0.36) but negative interest coverage (-3.61x) raises red flags on debt servicing ability.
3. Stock Volatility
Linde plc
- Beta 0.85 indicates below-market volatility, offering relative stability.
Albemarle Corporation
- Higher beta of 1.45 signals elevated price swings, increasing investor risk.
4. Regulatory & Legal
Linde plc
- Faces regulatory scrutiny in global industrial gas and energy sectors, but compliance track record is solid.
Albemarle Corporation
- Lithium extraction and chemical production carry heightened environmental and regulatory risks amid tightening US and global policies.
5. Supply Chain & Operations
Linde plc
- Complex global supply chain but diversified end markets reduce single-point operational risks.
Albemarle Corporation
- Supply chain sensitive to raw material shortages and geopolitical disruptions impacting lithium availability.
6. ESG & Climate Transition
Linde plc
- Investing in green hydrogen and carbon capture supports transition strategy but with significant CAPEX needs.
Albemarle Corporation
- Heavy reliance on lithium ties ESG profile to mining impacts and battery recycling challenges.
7. Geopolitical Exposure
Linde plc
- Operations span many stable and emerging markets, spreading geopolitical risk.
Albemarle Corporation
- Concentrated exposure to US and lithium-rich regions vulnerable to trade tensions and export restrictions.
Which company shows a better risk-adjusted profile?
Linde’s main risk is its stretched liquidity ratios, posing short-term operational vulnerability despite strong debt coverage. Albemarle’s critical risk lies in negative profitability and interest coverage, signaling financial distress amid volatile markets. Overall, Linde offers a safer risk-adjusted profile, supported by a strong Altman Z-score (3.84) versus Albemarle’s grey zone (2.65). Albemarle’s recent rebound in stock price (+4.4%) contrasts with its weak earnings, underscoring market optimism despite underlying financial risks.
Final Verdict: Which stock to choose?
Linde plc’s superpower lies in its steadily growing profitability and disciplined capital allocation. It demonstrates a slightly favorable moat with improving returns on invested capital, signaling emerging competitive strength. A point of vigilance remains its weak liquidity ratios, which could pressure short-term flexibility. It suits an income and stability-focused portfolio.
Albemarle Corporation benefits from a strategic moat rooted in its specialized position within lithium and battery materials, offering growth potential amid rising demand. Its balance sheet shows better liquidity and lower leverage than Linde, providing relative safety. However, its profitability challenges and negative free cash flow mark it as a higher-risk pick, fitting a growth-at-a-reasonable-price (GARP) profile.
If you prioritize stable cash flow and improving profitability, Linde outshines due to its robust income statement and emerging moat. However, if you seek exposure to high-growth sectors with a tolerance for volatility, Albemarle offers superior growth prospects despite financial headwinds. Each choice reflects distinct risk and reward trade-offs aligned with investor strategy.
Disclaimer: Investment carries a risk of loss of initial capital. The past performance is not a reliable indicator of future results. Be sure to understand risks before making an investment decision.
Go Further
I encourage you to read the complete analyses of Linde plc and Albemarle Corporation to enhance your investment decisions: