Home > Comparison > Basic Materials > ECL vs ALB
The strategic rivalry between Ecolab Inc. and Albemarle Corporation shapes the landscape of the specialty chemicals sector. Ecolab operates a diversified service model focused on water, hygiene, and infection prevention, while Albemarle concentrates on engineered specialty chemicals, particularly lithium and catalysts. This analysis explores their contrasting capital intensities and market exposures to determine which offers a superior risk-adjusted return for a balanced portfolio.
Table of contents
Companies Overview
Ecolab and Albemarle dominate specialty chemicals with distinct roles in global industrial and energy markets.
Ecolab Inc.: Global Leader in Water and Hygiene Solutions
Ecolab spearheads the specialty chemicals industry by providing water treatment, hygiene, and infection prevention. Its revenue engine centers on industrial, institutional, and healthcare segments offering cleaning, sanitizing, and pest elimination services. In 2026, Ecolab sharpens its focus on integrated water and energy management, leveraging real-time data to optimize customer operations worldwide.
Albemarle Corporation: Specialty Chemicals Innovator for Energy and Industry
Albemarle commands the specialty chemicals space through engineered solutions in lithium, bromine, and catalysts. The company’s core revenue stems from lithium compounds critical for EV batteries and industrial uses, alongside bromine and catalyst products serving energy, refining, and pharmaceutical sectors. Albemarle’s 2026 strategy emphasizes expanding lithium production to meet surging demand in energy storage and electric vehicles.
Strategic Collision: Similarities & Divergences
Both firms excel in specialty chemicals but diverge sharply in focus—Ecolab builds a service-driven, solution ecosystem, while Albemarle relies on product innovation in energy materials. Their primary battleground lies in industrial chemical applications, yet Ecolab targets operational efficiency whereas Albemarle targets raw material supply. Investors encounter distinct profiles: Ecolab offers stability through diversified services; Albemarle presents growth tied to lithium-driven energy transitions.
Income Statement Comparison
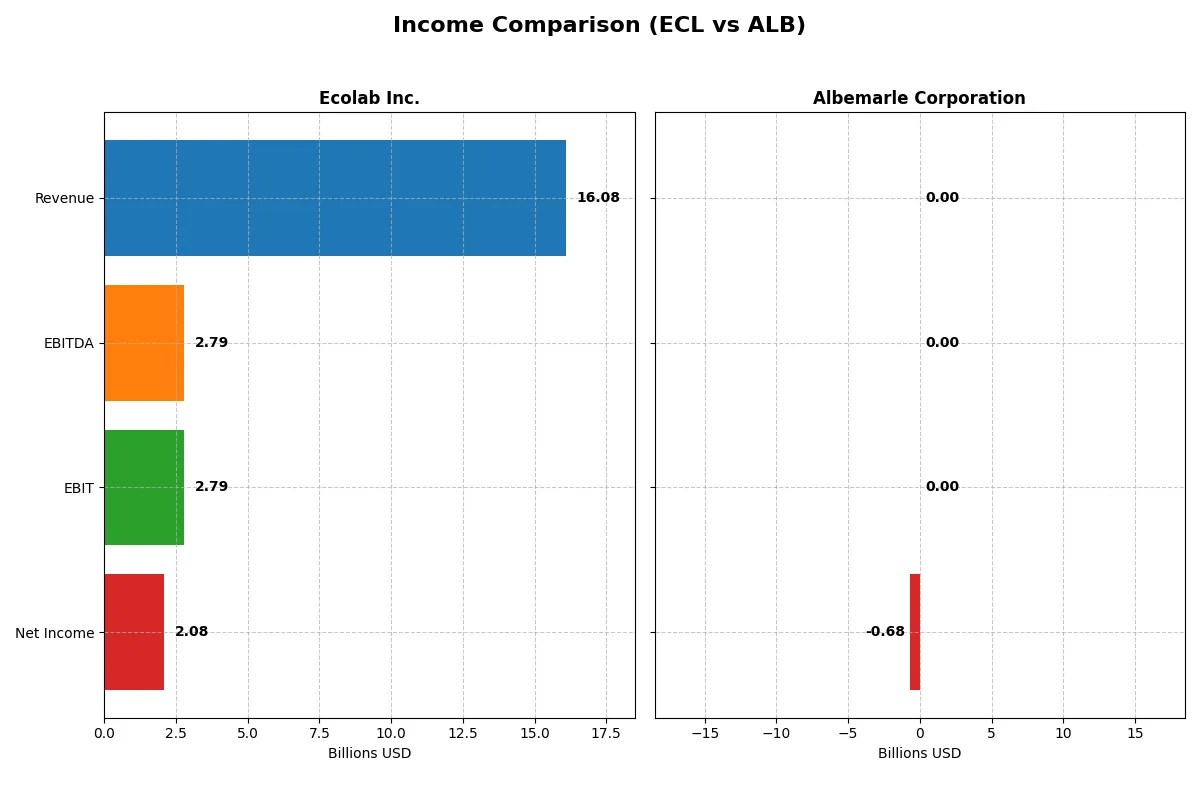
The following data dissects the core profitability and scalability of both corporate engines to reveal who dominates the bottom line:
| Metric | Ecolab Inc. (ECL) | Albemarle Corporation (ALB) |
|---|---|---|
| Revenue | 16.1B | 0 |
| Cost of Revenue | 8.9B | 0 |
| Operating Expenses | 4.2B | 0 |
| Gross Profit | 7.2B | 0 |
| EBITDA | 2.8B | 0 |
| EBIT | 2.8B | 0 |
| Interest Expense | 241M | 0 |
| Net Income | 2.1B | -677M |
| EPS | 7.33 | -5.76 |
| Fiscal Year | 2025 | 2025 |
Income Statement Analysis: The Bottom-Line Duel
This income statement comparison exposes the true efficiency and profitability of two distinct corporate engines over recent years.
Ecolab Inc. Analysis
Ecolab’s revenue steadily climbs from 12.7B in 2021 to 16.1B in 2025, with net income surging 83.7% over five years. Its gross margin holds strong near 44.5%, and net margin remains healthy at 12.9%. Despite a slight dip in EBIT and net margin growth last year, the 2025 results reveal robust operational efficiency and solid momentum.
Albemarle Corporation Analysis
Albemarle’s revenue peaked at 9.6B in 2023 before collapsing to zero in 2025, resulting in a net loss of 677M last year. Gross and EBIT margins fell sharply, signaling structural challenges. Although net margin and EPS growth show recent improvement, these reflect a low base after significant losses. The latest figures highlight severe disruptions and financial instability.
Margin Strength vs. Revenue Durability
Ecolab demonstrates sustained revenue growth and margin resilience, clearly outperforming Albemarle’s volatile and deteriorating income profile. Ecolab’s consistent profitability and expanding margins offer a fundamentally stronger business engine. Investors seeking steady operational efficiency and durable earnings would find Ecolab’s profile more attractive.
Financial Ratios Comparison
These vital ratios act as a diagnostic tool to expose the underlying fiscal health, valuation premiums, and capital efficiency of the companies analyzed:
| Ratios | Ecolab Inc. (ECL) | Albemarle Corporation (ALB) |
|---|---|---|
| ROE | 21.2% | -110.7% |
| ROIC | 11.2% | 0% |
| P/E | 35.8 | 0 |
| P/B | 7.61 | 0 |
| Current Ratio | 1.08 | 3.16 |
| Quick Ratio | 0.81 | 1.54 |
| D/E | 0.90 | 0 |
| Debt-to-Assets | 35.8% | 0 |
| Interest Coverage | 11.4 | 0 |
| Asset Turnover | 0.65 | 0 |
| Fixed Asset Turnover | 3.19 | 0 |
| Payout ratio | 36.6% | -13.8% |
| Dividend yield | 1.02% | 0% |
| Fiscal Year | 2025 | 2025 |
Efficiency & Valuation Duel: The Vital Signs
Ratios act as a company’s DNA, uncovering hidden risks and operational strengths that drive long-term value and investor confidence.
Ecolab Inc.
Ecolab demonstrates strong profitability with a 21.24% ROE and a robust 12.91% net margin, signalling operational efficiency. The stock trades at a stretched P/E of 35.83, reflecting high valuation. It delivers a modest 1.02% dividend yield, balancing shareholder returns with reinvestment in growth and innovation.
Albemarle Corporation
Albemarle posts unfavorable profitability metrics, including a negative ROE of -110.73% and zero net margin, indicating operational challenges. Valuation ratios are unavailable or zero, while liquidity appears strong with a 3.16 current ratio. The company does not pay dividends, likely focusing on restructuring or internal cash management.
Premium Valuation vs. Operational Safety
Ecolab offers a better balance of profitability and valuation despite its premium multiples. Albemarle’s weak returns and missing valuation metrics raise caution. Investors prioritizing steady operational performance may prefer Ecolab’s profile, while risk-tolerant investors might monitor Albemarle’s turnaround potential.
Which one offers the Superior Shareholder Reward?
I see Ecolab pays a steady dividend yield around 1%, with a payout ratio near 36%, backed by strong free cash flow coverage above 60%. Albemarle pays no dividend in 2025 but showed a 3.1% yield in 2024 with a negative payout ratio, reflecting inconsistent earnings. Ecolab also executes moderate buybacks, enhancing shareholder return sustainably. Albemarle’s lack of recent buyback data and volatile margins raise concerns about distribution sustainability. I conclude Ecolab offers a more reliable and attractive total shareholder reward in 2026.
Comparative Score Analysis: The Strategic Profile
The radar chart reveals the fundamental DNA and trade-offs of Ecolab Inc. and Albemarle Corporation, highlighting their core financial strengths and vulnerabilities:
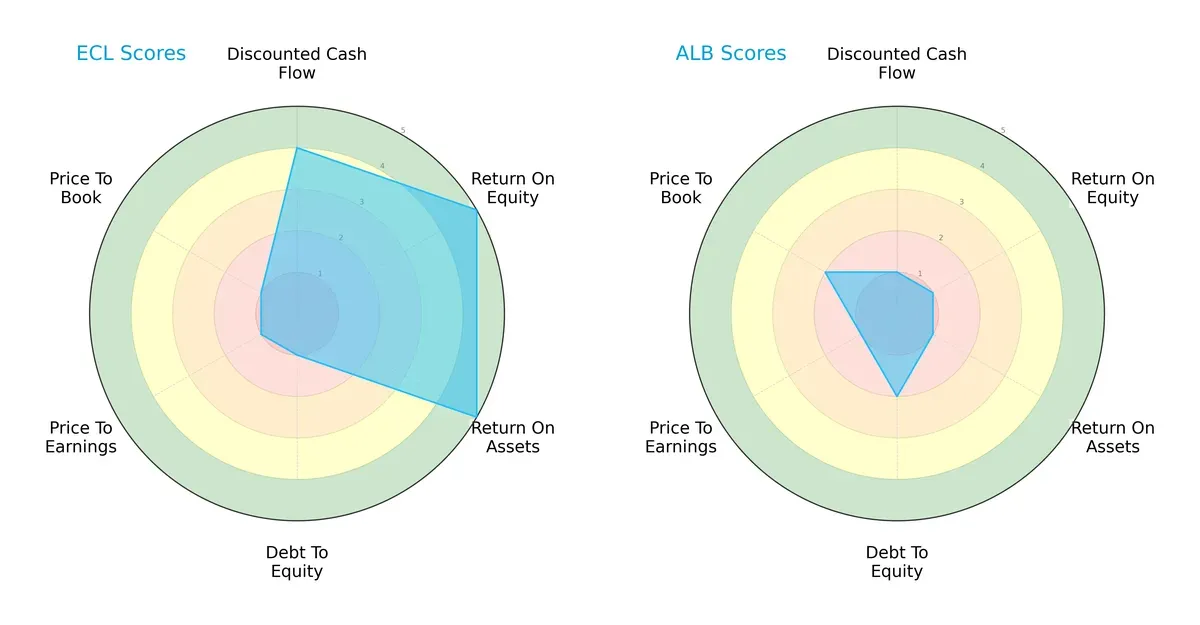
Ecolab delivers a more balanced profile with strong ROE and ROA scores (5 each), indicating efficient profit generation and asset utilization. Albemarle lags across these metrics, scoring only 1 in ROE and ROA, signaling weaker operational efficiency. Both face valuation challenges with low P/E and P/B scores, but Ecolab’s heavy debt load (debt-to-equity score 1) contrasts with Albemarle’s slightly better leverage (score 2). Overall, Ecolab relies on operational excellence, while Albemarle shows no clear edge.
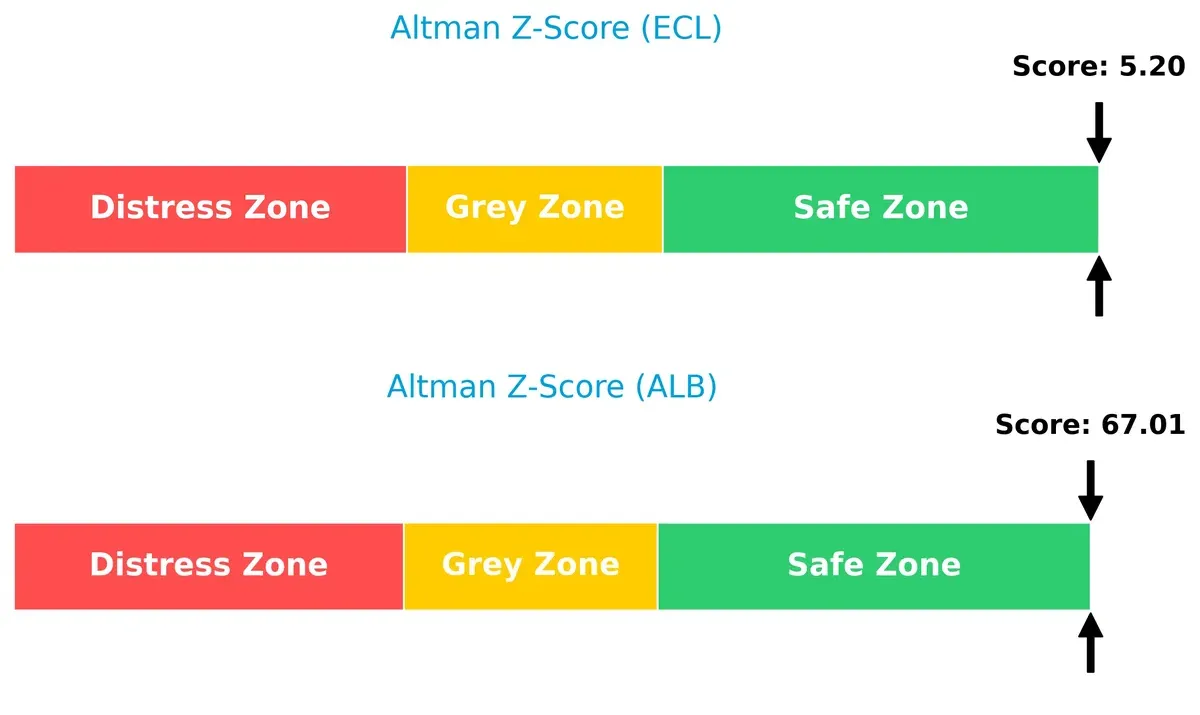
Bankruptcy Risk: Solvency Showdown
The Altman Z-Score difference signals both companies are in the safe zone, with Albemarle’s extremely high score (67.0) far exceeding Ecolab’s 5.2, implying a much stronger buffer against bankruptcy risks in this cycle:
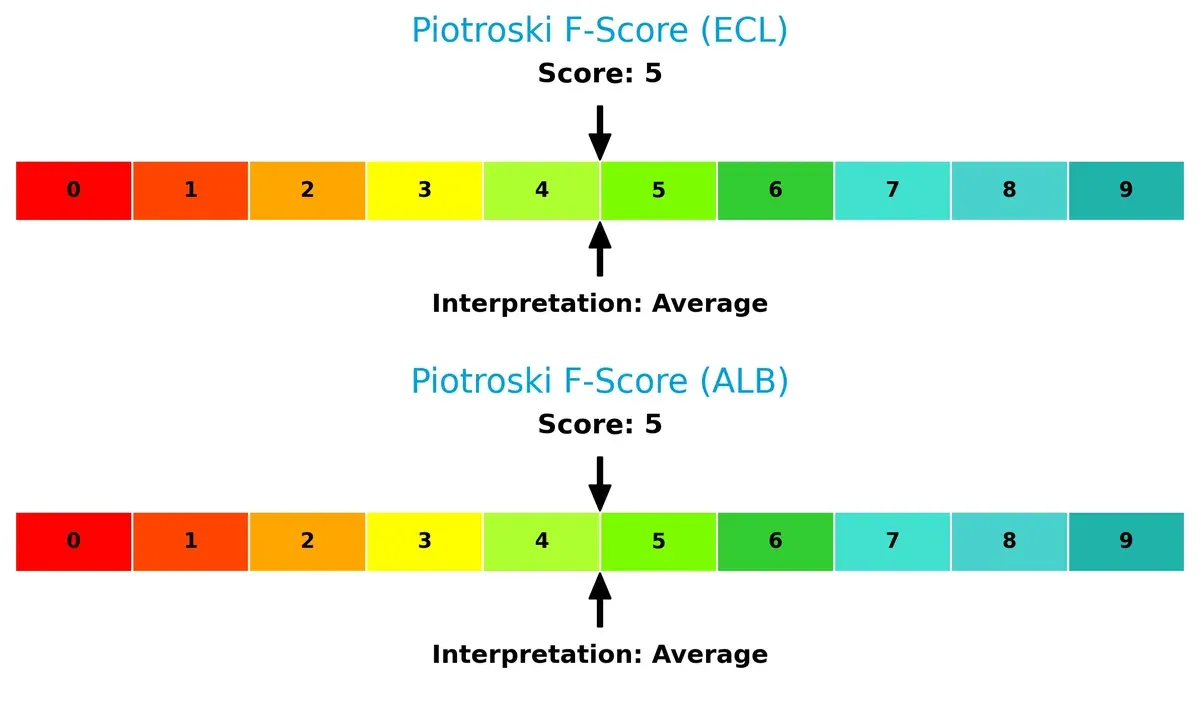
Financial Health: Quality of Operations
Both firms share identical Piotroski F-Scores of 5, reflecting average financial health without glaring red flags. Neither demonstrates peak operational quality or distinct internal strength advantages:
How are the two companies positioned?
This section dissects Ecolab and Albemarle’s operational DNA by comparing revenue distribution and internal dynamics. The goal is to confront their economic moats to identify the most resilient competitive advantage today.
Revenue Segmentation: The Strategic Mix
This visual comparison dissects how Ecolab Inc. and Albemarle Corporation diversify their income streams and the primary sectors they target:
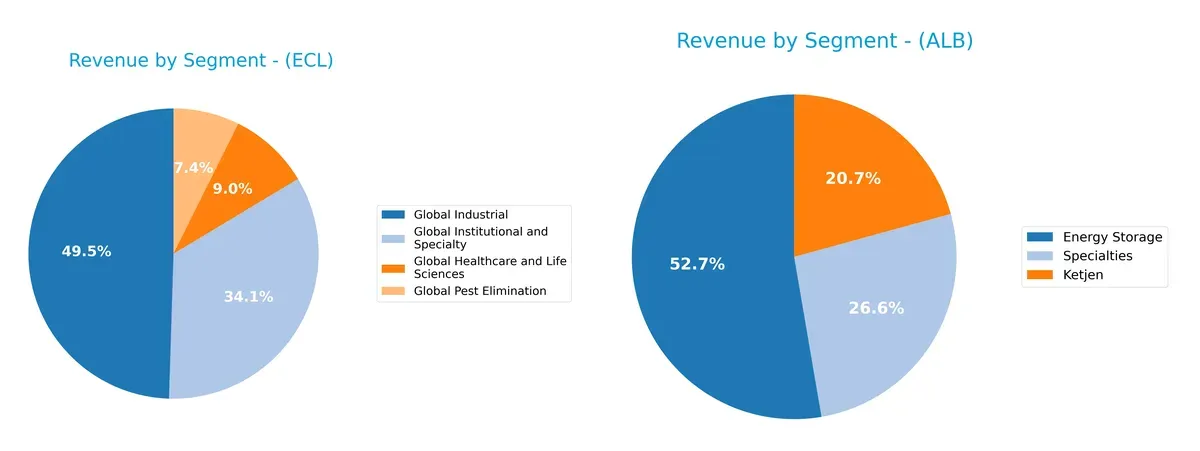
Ecolab anchors its revenue in “Global Industrial” at $7.86B, complemented by “Global Institutional and Specialty” at $5.41B, showing a balanced multi-segment approach. Albemarle leans heavily on “Energy Storage” with $3.02B in 2024, but its “Ketjen” and “Specialties” segments, each around $1B, reveal a narrower focus. Ecolab’s diversification reduces concentration risk while Albemarle pivots on energy materials, exposing it to sector cyclicality.
Strengths and Weaknesses Comparison
This table compares the Strengths and Weaknesses of Ecolab Inc. and Albemarle Corporation:
Ecolab Inc. Strengths
- Diversified revenue streams across institutional, industrial, pest elimination, healthcare
- Favorable profitability with 12.91% net margin and 21.24% ROE
- Strong fixed asset turnover at 3.19
- Global presence with substantial U.S., Europe, and Asia Pacific sales
Albemarle Corporation Strengths
- Favorable valuation metrics with positive PE and PB ratios
- Strong liquidity with 3.16 current ratio and 1.54 quick ratio
- Zero debt reflected in D/E and debt-to-assets ratios
- Diverse specialty segments including energy storage and lithium
Ecolab Inc. Weaknesses
- Elevated valuation multiples with PE 35.83 and PB 7.61 flagged as unfavorable
- Neutral short-term liquidity ratios (current ratio 1.08, quick ratio 0.81)
- Moderate leverage with debt-to-assets of 35.77%
- Dividend yield is modest at 1.02%
Albemarle Corporation Weaknesses
- Negative profitability with 0% net margin and -110.73% ROE
- Unavailable WACC and zero interest coverage signal financial stress
- Poor asset turnover and fixed asset turnover at zero
- No dividend yield and unfavorable global ratios overall
Ecolab demonstrates solid profitability and diversified global operations but carries valuation risks and moderate leverage. Albemarle shows strong liquidity and no debt but suffers from weak profitability and asset utilization, indicating operational and financial challenges.
The Moat Duel: Analyzing Competitive Defensibility
A structural moat protects long-term profits from relentless competition and margin erosion in commodity and specialty chemicals sectors:
Ecolab Inc.: Intangible Assets and Network Effects Moat
Ecolab’s moat stems from strong intangible assets and extensive network effects, reflected in a 3.4% ROIC premium over WACC and stable 44.5% gross margins. Its global footprint and specialized hygiene solutions deepen this moat in 2026.
Albemarle Corporation: Resource Control and Cost Advantage Moat
Albemarle relies on resource control in lithium and catalysts but shows a declining ROIC trend, signaling weakening cost advantages. Its growth hinges on expanding lithium markets, yet its recent financials reveal vulnerability compared to Ecolab.
Verdict: Intangible Assets vs. Resource Control in Specialty Chemicals
Ecolab possesses a wider, more sustainable moat supported by growing ROIC and margin stability. Albemarle’s declining returns and volatile revenue growth weaken its competitive defense. Ecolab stands better poised to defend market share in 2026.
Which stock offers better returns?
Both Ecolab Inc. and Albemarle Corporation show notable price appreciation over the past year, with accelerating bullish momentum and increasing trading volumes shaping their market dynamics.
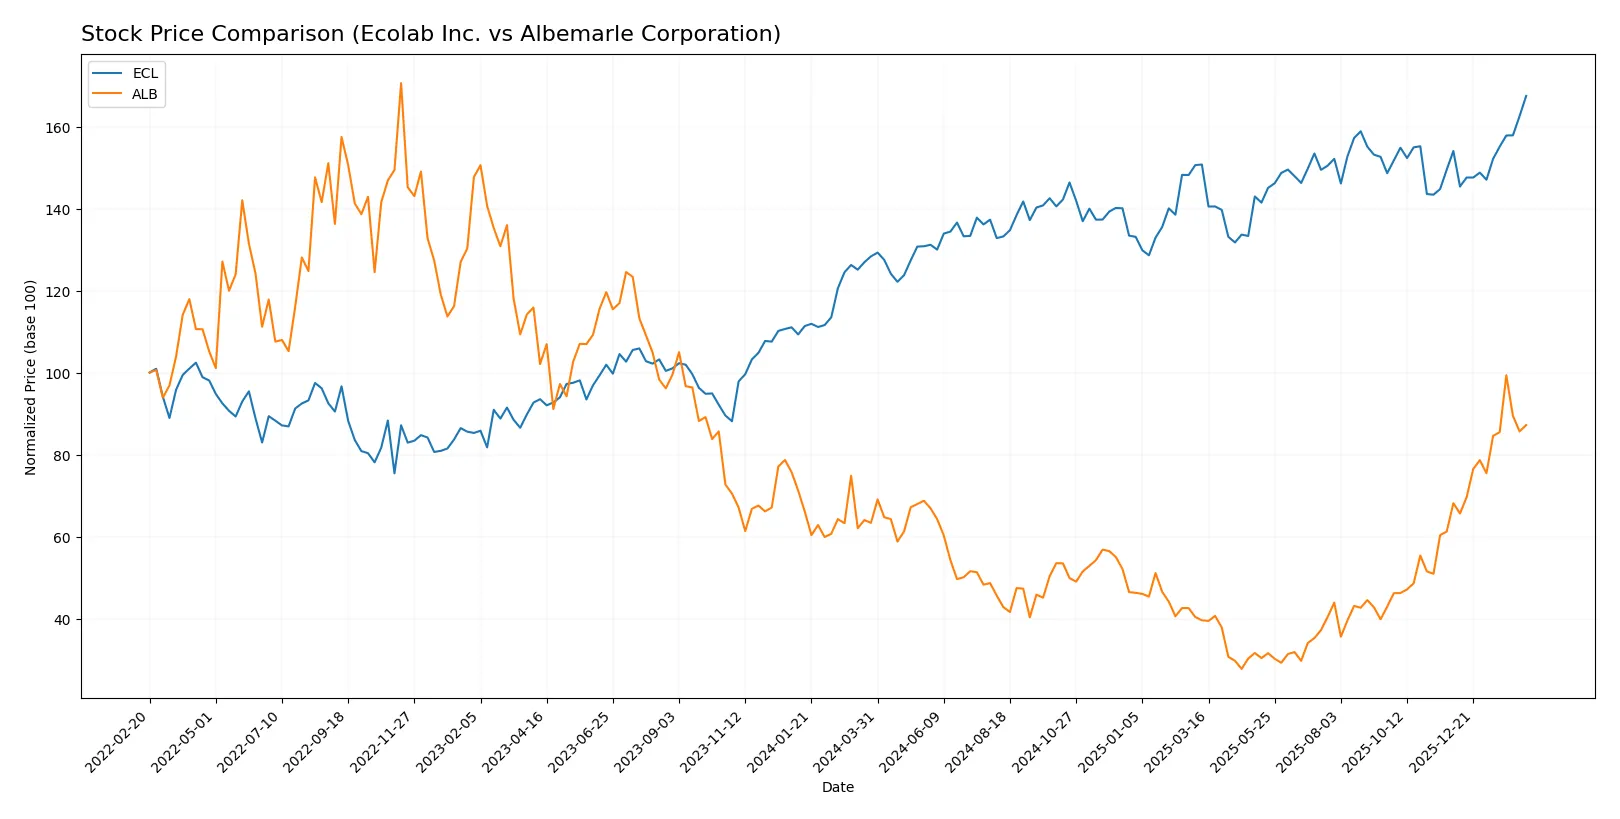
Trend Comparison
Ecolab’s stock rose 30.49% over the past 12 months, marking a bullish trend with accelerating gains and moderate volatility, peaking at 299.17 and bottoming at 218.16.
Albemarle’s stock gained 37.64% over the same period, also bullish with accelerating momentum but higher volatility, reaching a high of 189.51 and a low of 52.91.
Albemarle outperformed Ecolab in 12-month returns, delivering stronger price appreciation despite greater price fluctuations.
Target Prices
Analysts present a cautiously optimistic consensus on Ecolab Inc. and Albemarle Corporation.
| Company | Target Low | Target High | Consensus |
|---|---|---|---|
| Ecolab Inc. | 300 | 345 | 325.1 |
| Albemarle Corp. | 136 | 210 | 188 |
Ecolab’s target consensus sits about 8.6% above its current price, signaling moderate upside potential. Albemarle’s consensus target exceeds its price by roughly 13%, reflecting stronger expected growth but with higher volatility risk.

Don’t Let Luck Decide Your Entry Point
Optimize your entry points with our advanced ProRealTime indicators. You’ll get efficient buy signals with precise price targets for maximum performance. Start outperforming now!
How do institutions grade them?
Ecolab Inc. Grades
The following table summarizes recent grades given to Ecolab Inc. by major grading companies.
| Grading Company | Action | New Grade | Date |
|---|---|---|---|
| BNP Paribas | maintain | Outperform | 2026-02-12 |
| Exane BNP Paribas | maintain | Outperform | 2026-02-12 |
| JP Morgan | maintain | Neutral | 2026-02-11 |
| RBC Capital | maintain | Outperform | 2026-02-11 |
| Citigroup | maintain | Buy | 2026-02-11 |
| Stifel | maintain | Buy | 2026-02-11 |
| Jefferies | maintain | Buy | 2026-02-11 |
| Wells Fargo | maintain | Equal Weight | 2026-02-11 |
| UBS | maintain | Neutral | 2026-02-11 |
| Citigroup | maintain | Buy | 2026-01-21 |
Albemarle Corporation Grades
The table below shows recent grades assigned to Albemarle Corporation by recognized grading institutions.
| Grading Company | Action | New Grade | Date |
|---|---|---|---|
| Citigroup | maintain | Neutral | 2026-02-13 |
| Mizuho | maintain | Neutral | 2026-02-12 |
| JP Morgan | maintain | Neutral | 2026-01-28 |
| Jefferies | maintain | Buy | 2026-01-28 |
| Wells Fargo | maintain | Equal Weight | 2026-01-26 |
| Citigroup | maintain | Neutral | 2026-01-21 |
| Truist Securities | upgrade | Buy | 2026-01-21 |
| Oppenheimer | maintain | Outperform | 2026-01-21 |
| Deutsche Bank | upgrade | Buy | 2026-01-13 |
| UBS | maintain | Buy | 2026-01-12 |
Which company has the best grades?
Ecolab Inc. holds more consistent Outperform and Buy ratings from multiple firms, while Albemarle shows a mix of Neutral and Buy grades. Investors may see Ecolab’s stronger consensus as a sign of greater analyst confidence.
Risks specific to each company
The following categories identify the critical pressure points and systemic threats facing both firms in the 2026 market environment:
1. Market & Competition
Ecolab Inc.
- Operates in diverse industrial and healthcare sectors with strong specialty chemical positioning.
Albemarle Corporation
- Focused on lithium and specialty chemicals amid intense EV battery market competition and cyclicality.
2. Capital Structure & Debt
Ecolab Inc.
- Moderate debt-to-assets at 35.77%, DE ratio 0.9; interest coverage strong at 11.57x.
Albemarle Corporation
- No reported debt, very favorable leverage, but zero interest coverage raises concern on profitability.
3. Stock Volatility
Ecolab Inc.
- Beta near 1 (0.992) indicates market-level volatility.
Albemarle Corporation
- Beta elevated at 1.449, implying higher price swings and risk exposure.
4. Regulatory & Legal
Ecolab Inc.
- Subject to stringent regulations in hygiene and chemical sectors globally.
Albemarle Corporation
- Lithium extraction and chemical manufacturing face tightening environmental and safety regulations.
5. Supply Chain & Operations
Ecolab Inc.
- Complex global supply chains servicing diverse industries, risk of disruptions moderate.
Albemarle Corporation
- Heavy reliance on lithium supply chains vulnerable to geopolitical and resource scarcity risks.
6. ESG & Climate Transition
Ecolab Inc.
- Provides water and energy management solutions, aligning with sustainability trends.
Albemarle Corporation
- Faces pressure to decarbonize lithium production and manage environmental impact amid green transition.
7. Geopolitical Exposure
Ecolab Inc.
- Operates internationally but with a balanced US base reducing geopolitical risk concentration.
Albemarle Corporation
- Global lithium markets expose it to geopolitical tensions, especially in resource-rich regions.
Which company shows a better risk-adjusted profile?
Ecolab’s most impactful risk lies in moderate leverage coupled with valuation concerns, while Albemarle faces severe profitability and operational risks amidst volatile lithium markets. I see Ecolab demonstrating a better risk-adjusted profile, supported by its strong Altman Z-Score (5.2, safe zone) and stable operating segments. Albemarle’s zero net margin and negative ROE starkly expose its financial fragility. The recent surge in Albemarle’s stock volatility (beta 1.45) underscores risk from lithium market instability, justifying investor caution.
Final Verdict: Which stock to choose?
Ecolab Inc. (ECL) stands out as a cash-generating powerhouse with a strong and growing economic moat. Its efficient capital allocation delivers consistent value creation, supporting a robust competitive position. A point of vigilance remains its elevated valuation multiples, which could pressure returns if growth stalls. ECL fits well in portfolios seeking steady, long-term growth with quality.
Albemarle Corporation (ALB) offers a strategic moat rooted in its niche chemical market position, combined with a solid liquidity profile. While it appears riskier due to recent profitability challenges and volatile returns, its accelerating price trend suggests potential upside. ALB may suit investors pursuing growth at a reasonable price with a tolerance for operational turnaround risks.
If you prioritize durable value creation and stable profitability, Ecolab outshines as the compelling choice due to its proven economic moat and consistent cash flow. However, if you seek higher growth potential with a willingness to accept elevated risk, Albemarle offers better upside momentum despite its current financial headwinds. Both present distinct analytical scenarios for different investor profiles.
Disclaimer: Investment carries a risk of loss of initial capital. The past performance is not a reliable indicator of future results. Be sure to understand risks before making an investment decision.
Go Further
I encourage you to read the complete analyses of Ecolab Inc. and Albemarle Corporation to enhance your investment decisions: