Home > Comparison > Basic Materials > DD vs ALB
The strategic rivalry between DuPont de Nemours, Inc. and Albemarle Corporation shapes the specialty chemicals sector’s evolution. DuPont operates as a diversified technology-driven materials provider with broad industrial applications. Albemarle focuses on engineered specialty chemicals, emphasizing lithium and bromine segments critical to energy storage and advanced manufacturing. This analysis contrasts their operational models and strategic positioning to identify which offers superior risk-adjusted returns for diversified portfolios in 2026.
Table of contents
Companies Overview
DuPont de Nemours and Albemarle Corporation both command significant roles in the specialty chemicals sector. Their innovations influence multiple industries worldwide, from electronics to energy storage.
DuPont de Nemours, Inc.: Technology-Driven Materials Innovator
DuPont de Nemours dominates specialty chemicals with a diversified portfolio across Electronics & Industrial, Mobility & Materials, and Water & Protection segments. Its core revenue stems from advanced materials and solutions for semiconductors, transportation, and water purification. In 2026, the company prioritizes innovation in semiconductor materials and sustainable protection systems to maintain its competitive edge.
Albemarle Corporation: Leader in Engineered Specialty Chemicals
Albemarle Corporation excels in lithium, bromine, and catalysts, supplying critical materials for batteries, fire safety, and refining. Its revenue engine centers on lithium compounds for electric vehicles and consumer electronics. The 2026 strategy focuses on expanding lithium production capacity to capitalize on the booming energy storage market and meet growing demand.
Strategic Collision: Similarities & Divergences
Both firms focus on specialty chemicals but diverge in end-market emphasis—DuPont targets broad industrial innovation, Albemarle zeroes in on energy storage and refining. They compete primarily in advanced materials for high-growth sectors like electronics and clean energy. DuPont’s diversified portfolio contrasts with Albemarle’s lithium specialization, defining distinct investment profiles shaped by sector exposure and growth drivers.
Income Statement Comparison
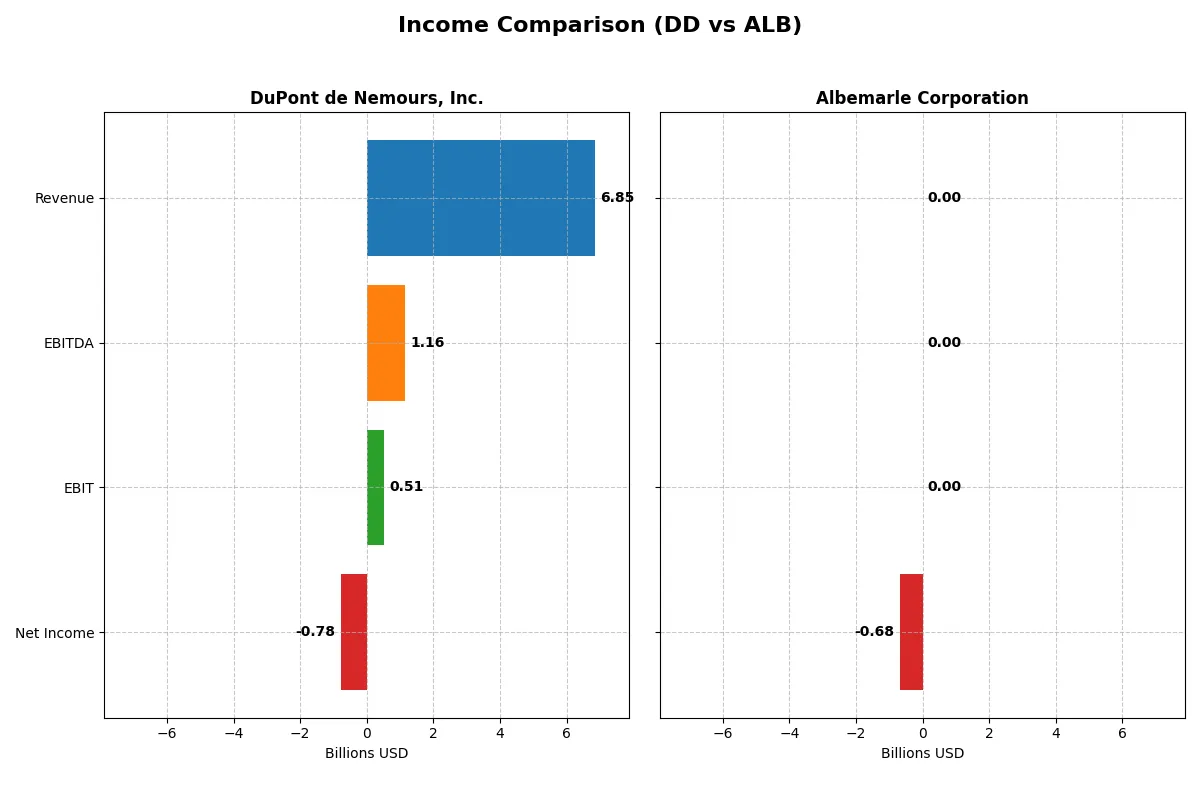
The following data dissects the core profitability and scalability of both corporate engines to reveal who dominates the bottom line:
| Metric | DuPont de Nemours, Inc. (DD) | Albemarle Corporation (ALB) |
|---|---|---|
| Revenue | 6.8B | 0 |
| Cost of Revenue | 4.8B | 0 |
| Operating Expenses | 1.2B | 0 |
| Gross Profit | 2.1B | 0 |
| EBITDA | 1.2B | 0 |
| EBIT | 513M | 0 |
| Interest Expense | 313M | 0 |
| Net Income | -779M | -677M |
| EPS | -1.87 | -5.76 |
| Fiscal Year | 2025 | 2025 |
Income Statement Analysis: The Bottom-Line Duel
This income statement comparison reveals the true efficiency and financial momentum of each company’s core business engine over recent years.
DuPont de Nemours, Inc. Analysis
DuPont’s revenue declined sharply from 13B in 2022 to 6.8B in 2025, dragging net income into a -779M loss last year. Gross margin remains solid at 30.25%, but net margin sank to -11.37%, reflecting high costs and operational challenges. The sharp drop in EBIT and EPS signals weakening efficiency and mounting headwinds.
Albemarle Corporation Analysis
Albemarle’s revenue fell from 9.6B in 2023 to zero in 2025, wiping out gross profit and pushing net income to a -677M loss. The absence of reported 2025 revenue distorts margin metrics, but the 2024 gross margin was razor-thin at 1.6%. Despite a negative trend, Albemarle showed a favorable 1-year EBIT and net margin growth due to base effects, yet overall performance remains weak.
Margin Resilience vs. Revenue Collapse
DuPont sustains stronger gross margins despite steep revenue drops, but its net income turned sharply negative in 2025. Albemarle’s top-line collapse to zero revenue obliterated profitability. DuPont’s profile suggests more operational resilience, while Albemarle faces structural challenges. Investors seeking margin stability may prefer DuPont’s profile, though both face significant recovery risks.
Financial Ratios Comparison
These vital ratios act as a diagnostic tool to expose the underlying fiscal health, valuation premiums, and capital efficiency of the companies compared below:
| Ratios | DuPont de Nemours, Inc. (DD) | Albemarle Corporation (ALB) |
|---|---|---|
| ROE | -5.60% | -110.73% |
| ROIC | 2.18% | 0% |
| P/E | -21.54 | 0 |
| P/B | 1.21 | 0 |
| Current Ratio | 2.42 | 3.16 |
| Quick Ratio | 1.91 | 1.54 |
| D/E | 0.23 | 0 |
| Debt-to-Assets | 14.80% | 0% |
| Interest Coverage | 2.75 | 0 |
| Asset Turnover | 0.32 | 0 |
| Fixed Asset Turnover | 1.98 | 0 |
| Payout ratio | -76.64% | -13.84% |
| Dividend yield | 3.56% | 0% |
| Fiscal Year | 2025 | 2025 |
Efficiency & Valuation Duel: The Vital Signs
Financial ratios serve as a company’s DNA, exposing hidden risks and operational strengths essential for investor insight.
DuPont de Nemours, Inc.
DuPont reveals weak profitability with a -5.6% ROE and negative net margin, indicating operational challenges. Yet, it trades at a favorable P/E and P/B ratio, suggesting valuation appeal. The firm supports shareholders with a 3.56% dividend yield, reflecting stable income despite stretched returns.
Albemarle Corporation
Albemarle shows deep profitability woes, with a -110.7% ROE and zero net margin. Its valuation metrics are largely unavailable or neutral, signaling uncertainty. The company lacks dividends and struggles operationally, reflected in unfavorable asset turnover and interest coverage, posing notable risks for investors.
Valuation Appeal vs. Profitability Challenge
DuPont offers a better balance by combining attractive valuation with shareholder dividends despite profitability issues. Albemarle’s financial weakness and lack of returns present higher risk. Investors seeking income might prefer DuPont, while risk-tolerant profiles may consider Albemarle’s turnaround potential.
Which one offers the Superior Shareholder Reward?
I compare DuPont de Nemours, Inc. (DD) and Albemarle Corporation (ALB) based on their 2025 capital return strategies. DD pays a 3.56% dividend yield with a high payout ratio near 90%, signaling strong free cash flow coverage. It also maintains modest buybacks, supporting total returns sustainably. ALB, by contrast, suspended dividends in 2025 but reinvests heavily in R&D and capex, showing a focus on long-term growth. However, ALB’s free cash flow is inconsistent, raising sustainability concerns. I see DD’s balanced dividend and buyback approach as more reliable for shareholder reward in 2026.
Comparative Score Analysis: The Strategic Profile
The radar chart reveals the fundamental DNA and trade-offs of both DuPont de Nemours, Inc. and Albemarle Corporation, highlighting their financial strengths and vulnerabilities:
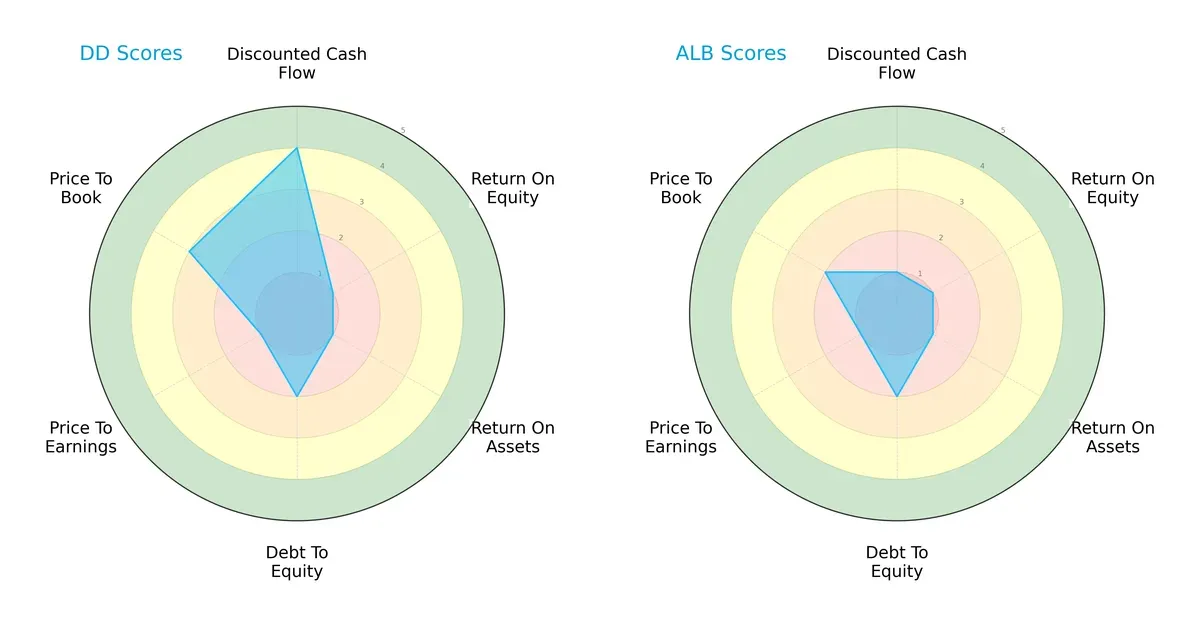
DuPont exhibits a more balanced profile with a favorable DCF score of 4 and moderate price-to-book valuation, despite weak returns and a higher debt load. Albemarle leans heavily on a similar debt profile but struggles with low scores across DCF, ROE, ROA, and valuation metrics, indicating reliance on limited financial edges and overall unfavorable positioning.
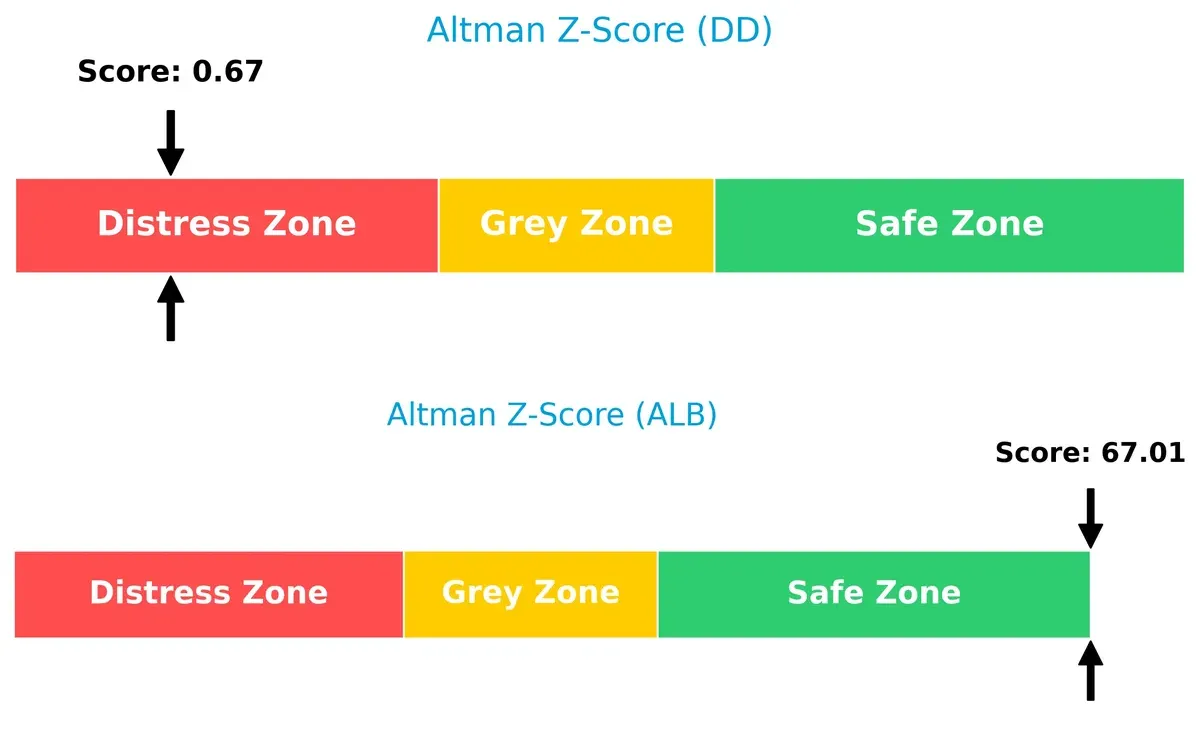
Bankruptcy Risk: Solvency Showdown
DuPont’s Altman Z-Score of 0.67 signals distress, implying a high bankruptcy risk in this cycle. Albemarle’s score of 67.0 places it securely in the safe zone, demonstrating robust solvency and long-term survival prospects:
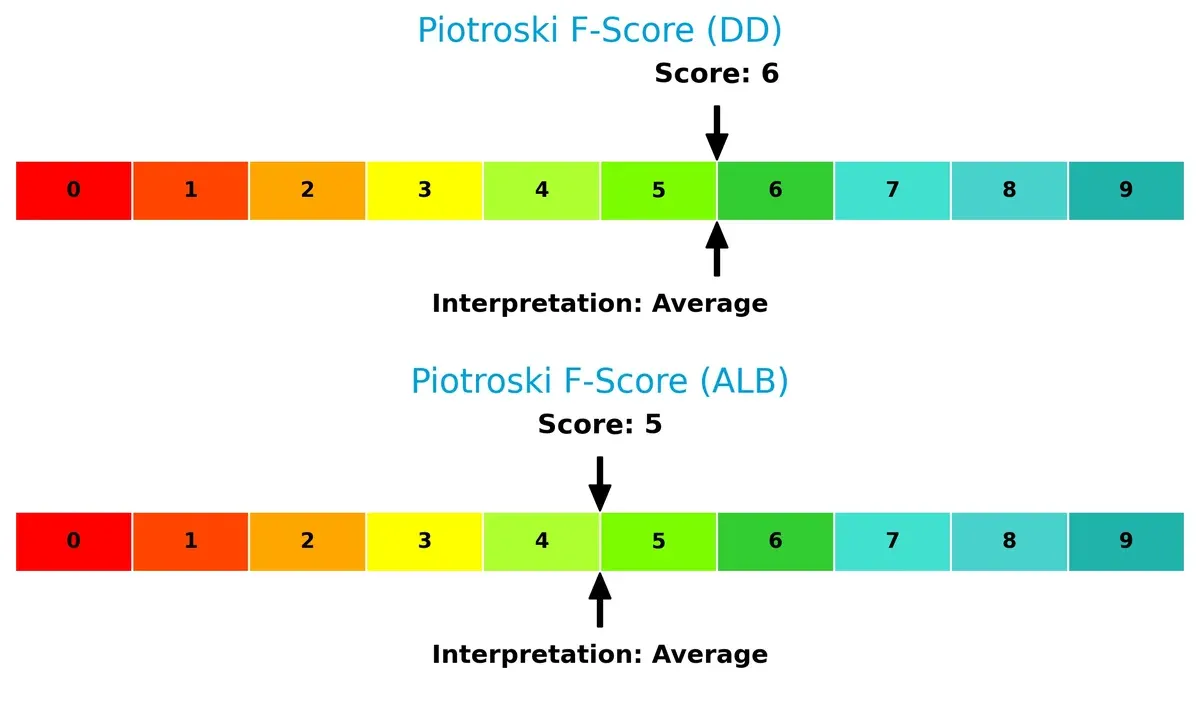
Financial Health: Quality of Operations
Both companies show average Piotroski F-Scores, with DuPont at 6 and Albemarle at 5. This suggests moderate financial health but highlights no clear red flags in operational quality for either firm:
How are the two companies positioned?
This section dissects the operational DNA of DD and ALB by comparing their revenue distribution and internal dynamics. The goal is to confront their economic moats to identify which model offers the most resilient and sustainable advantage today.
Revenue Segmentation: The Strategic Mix
This visual comparison dissects how DuPont de Nemours and Albemarle diversify their income streams and where their primary sector bets lie:
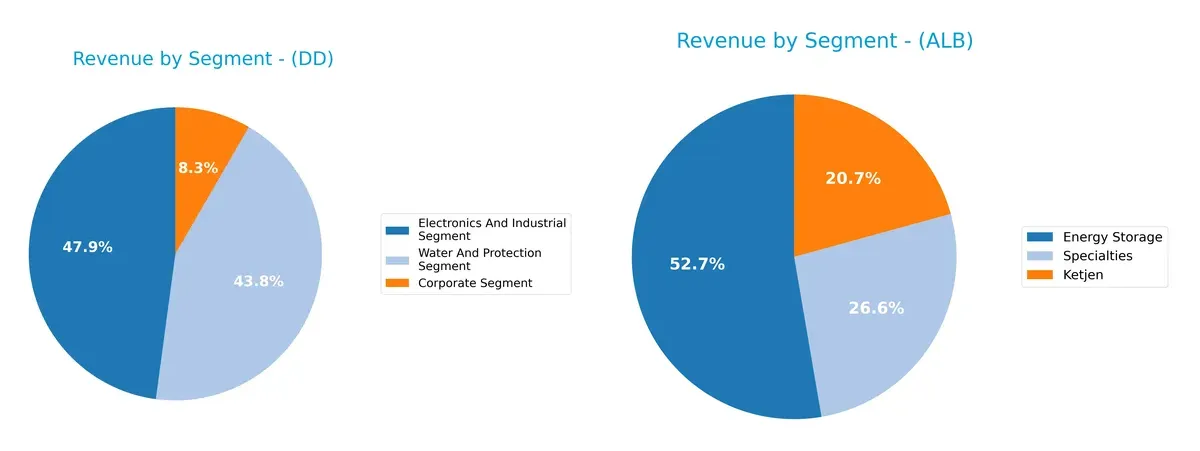
DuPont de Nemours anchors its revenue in a balanced three-segment mix: Electronics and Industrial ($5.93B), Water and Protection ($5.42B), and Corporate ($1.03B). Albemarle, however, pivots heavily on Energy Storage ($3.02B in 2024), dwarfing its Ketjen ($1.04B) and Specialties ($1.33B) segments. DuPont’s diversified base reduces concentration risk, while Albemarle’s focus signals a strategic bet on lithium-ion battery growth and energy transition dominance.
Strengths and Weaknesses Comparison
This table compares the strengths and weaknesses of DuPont de Nemours, Inc. (DD) and Albemarle Corporation (ALB):
DD Strengths
- Diverse segments including Electronics, Water Protection, and Corporate
- Strong global presence with significant Asia Pacific and U.S. & Canada sales
- Favorable leverage ratios with low debt to assets and debt/equity
- Solid liquidity with current ratio at 2.42 and quick ratio at 1.91
ALB Strengths
- Focused segments in Energy Storage, Ketjen, and Specialties with clear revenue drivers
- Favorable debt structure with zero debt to assets and no debt/equity
- Quick ratio favorable at 1.54 indicating liquidity
- Favorable valuation ratios despite some unavailable metrics
DD Weaknesses
- Negative profitability metrics: net margin -11.37% and ROE -5.6%
- ROIC at 2.18% below WACC at 8.77% indicating weak capital efficiency
- Interest coverage low at 1.64 signaling potential difficulty servicing debt
- Asset turnover low at 0.32 showing inefficient asset use
ALB Weaknesses
- Negative ROE at -110.73% and zero net margin highlight profitability challenges
- Unavailable WACC and zero dividend yield raise transparency and return concerns
- Current ratio unusually high at 3.16, possibly signaling inefficient capital use
- Asset turnover and fixed asset turnover at zero indicate operational inefficiency
DuPont’s strengths lie in its diversified business model and strong liquidity, but profitability and capital efficiency remain concerns. Albemarle shows strong balance sheet conservatism but faces significant operational and profitability challenges that may constrain growth strategies.
The Moat Duel: Analyzing Competitive Defensibility
Only a structural moat can protect long-term profits from relentless competition and margin erosion. Let’s dissect the key moats of DuPont de Nemours and Albemarle Corporation:
DuPont de Nemours, Inc.: Innovation-Driven Intangible Asset Moat
DuPont’s moat stems from advanced materials and technology patents that sustain high gross margins near 30%. Yet, declining ROIC and revenue signal rising competitive pressure in 2026. New markets in semiconductors may offer partial relief.
Albemarle Corporation: Resource-Centric Cost Advantage Moat
Albemarle relies on lithium and specialty chemicals with cost advantages in energy storage markets. However, 2025’s revenue collapse and negative ROIC trend expose vulnerability. Expansion in EV battery materials could revive its moat if executed well.
Innovation Moat vs. Resource Cost Edge: Who Holds the Line?
DuPont’s intangible assets deliver a wider moat with stable margins despite recent setbacks. Albemarle’s cost advantage erodes sharply amid revenue declines. DuPont appears better equipped to defend market share through innovation-driven diversification.
Which stock offers better returns?
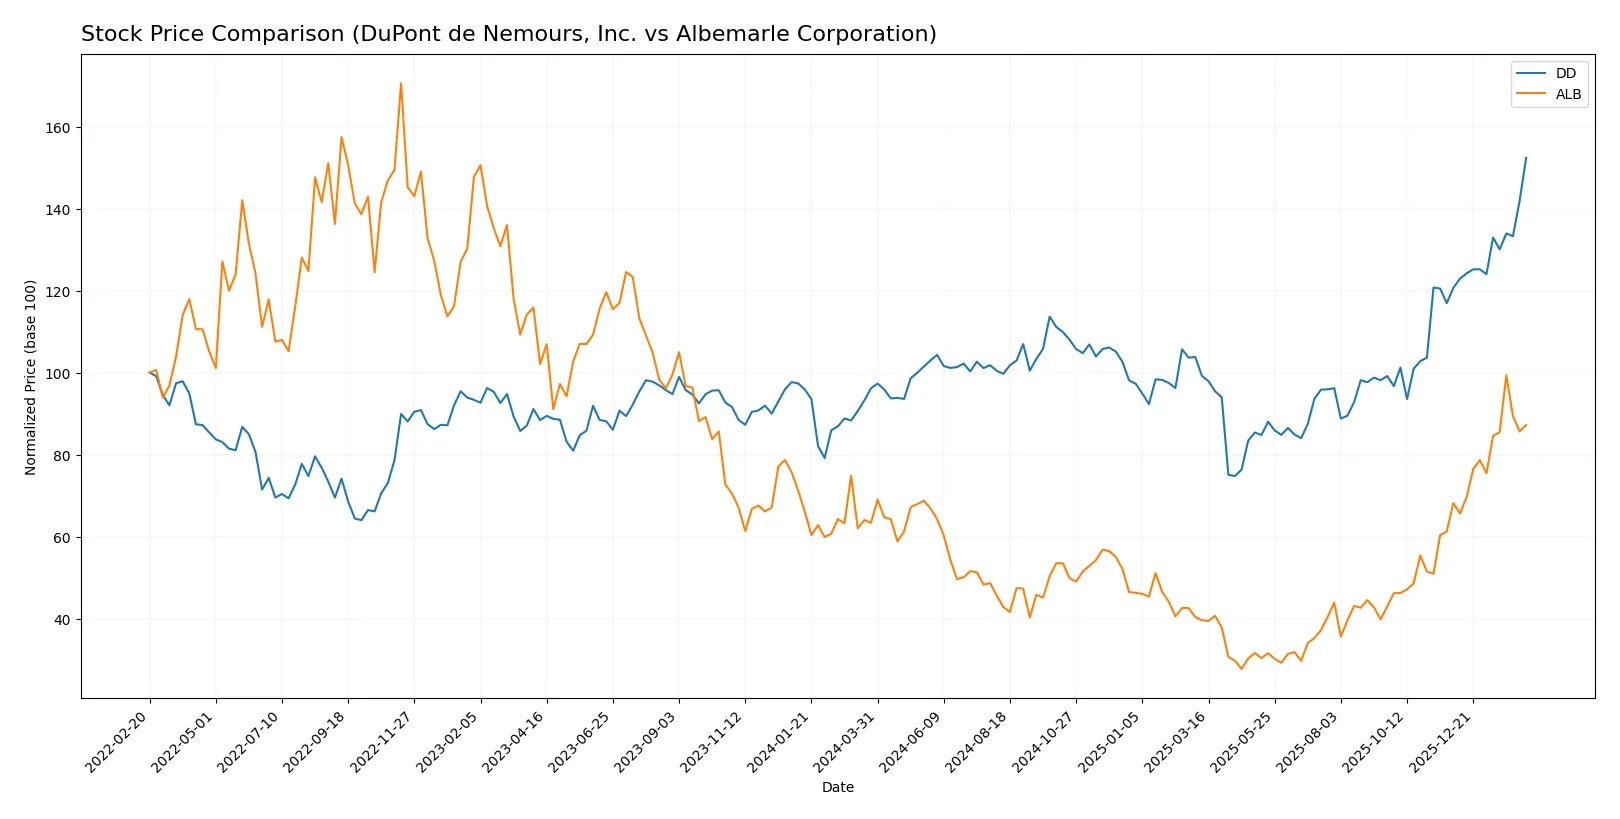
The past year shows strong bullish trends for both stocks, with DuPont de Nemours accelerating from a 24.64 low to a 50.22 peak, while Albemarle exhibited wider price swings and a higher peak near 190.
Trend Comparison
DuPont de Nemours, Inc. (DD) gained 58.47% over the past 12 months, showing bullish acceleration and moderate volatility with a standard deviation of 4.48.
Albemarle Corporation (ALB) rose 37.64% over the same period, also bullish with accelerating momentum but much higher volatility, reflected in its 28.67 standard deviation.
DuPont’s 58.47% rise surpasses Albemarle’s 37.64%, making DD the stronger performer in market returns over the last year.
Target Prices
Analysts present a broad but insightful target price range for DuPont de Nemours and Albemarle Corporation.
| Company | Target Low | Target High | Consensus |
|---|---|---|---|
| DuPont de Nemours, Inc. | 46 | 161 | 73.88 |
| Albemarle Corporation | 136 | 210 | 188 |
DuPont’s consensus target of $73.88 is well above its current $50.22 price, indicating potential upside. Albemarle’s $188 consensus target surpasses the current $166.35, reflecting strong analyst confidence despite recent volatility.

Don’t Let Luck Decide Your Entry Point
Optimize your entry points with our advanced ProRealTime indicators. You’ll get efficient buy signals with precise price targets for maximum performance. Start outperforming now!
How do institutions grade them?
The following tables summarize recent institutional grades for DuPont de Nemours, Inc. and Albemarle Corporation:
DuPont de Nemours, Inc. Grades
Institutional grades for DuPont, reflecting mostly buy-oriented recommendations:
| Grading Company | Action | New Grade | Date |
|---|---|---|---|
| BMO Capital | maintain | Outperform | 2026-02-12 |
| Jefferies | maintain | Buy | 2026-02-11 |
| UBS | maintain | Buy | 2026-02-11 |
| Wells Fargo | maintain | Overweight | 2026-02-11 |
| Citigroup | maintain | Buy | 2026-02-11 |
| Keybanc | maintain | Overweight | 2026-02-11 |
| Citigroup | maintain | Buy | 2026-01-21 |
| JP Morgan | maintain | Overweight | 2026-01-16 |
| Keybanc | maintain | Overweight | 2026-01-09 |
| UBS | maintain | Buy | 2026-01-07 |
Albemarle Corporation Grades
Institutional grades for Albemarle show a mix of neutral and buy recommendations with some upgrades:
| Grading Company | Action | New Grade | Date |
|---|---|---|---|
| Citigroup | maintain | Neutral | 2026-02-13 |
| Mizuho | maintain | Neutral | 2026-02-12 |
| JP Morgan | maintain | Neutral | 2026-01-28 |
| Jefferies | maintain | Buy | 2026-01-28 |
| Wells Fargo | maintain | Equal Weight | 2026-01-26 |
| Citigroup | maintain | Neutral | 2026-01-21 |
| Truist Securities | upgrade | Buy | 2026-01-21 |
| Oppenheimer | maintain | Outperform | 2026-01-21 |
| Deutsche Bank | upgrade | Buy | 2026-01-13 |
| UBS | maintain | Buy | 2026-01-12 |
Which company has the best grades?
DuPont de Nemours consistently receives buy or outperform ratings from multiple major firms, indicating stronger institutional confidence. Albemarle’s grades include neutral and buy ratings with some recent upgrades. This suggests DuPont currently holds a more favorable institutional view, potentially influencing investor sentiment positively.
Risks specific to each company
The following categories identify the critical pressure points and systemic threats facing both firms in the 2026 market environment:
1. Market & Competition
DuPont de Nemours, Inc.
- Faces intense specialty chemicals competition with modest ROIC of 2.18%, below WACC of 8.77%, signaling weak capital efficiency.
Albemarle Corporation
- Operates in lithium and specialty chemicals with volatile demand; zero net margin and poor ROIC suggest profitability challenges.
2. Capital Structure & Debt
DuPont de Nemours, Inc.
- Low debt-to-equity at 0.23 and debt-to-assets 14.8% indicate conservative leverage and manageable financial risk.
Albemarle Corporation
- No debt reported, implying a clean balance sheet but possibly underleveraged for growth.
3. Stock Volatility
DuPont de Nemours, Inc.
- Beta of 1.16 suggests moderate volatility, typical for chemicals sector stocks.
Albemarle Corporation
- Higher beta at 1.45 indicates greater stock price fluctuations and higher market risk.
4. Regulatory & Legal
DuPont de Nemours, Inc.
- Subject to stringent environmental and safety regulations across multiple regions, adding compliance costs.
Albemarle Corporation
- Lithium production faces increasing scrutiny over mining impacts and export controls, creating regulatory uncertainty.
5. Supply Chain & Operations
DuPont de Nemours, Inc.
- Complex global supply chain spanning chemicals and materials sectors; potential disruption risks from geopolitical tensions.
Albemarle Corporation
- Supply chain concentrated on lithium sourcing, vulnerable to raw material price swings and geopolitical supply risks.
6. ESG & Climate Transition
DuPont de Nemours, Inc.
- ESG initiatives critical due to chemical industry footprint; transition risks from tightening regulations and consumer pressure.
Albemarle Corporation
- Strong exposure to clean energy transition via lithium; however, environmental impact of mining remains a reputational risk.
7. Geopolitical Exposure
DuPont de Nemours, Inc.
- Operations across Americas, Asia-Pacific, Europe; exposed to trade policy shifts and tariffs.
Albemarle Corporation
- Heavy reliance on global lithium markets exposes firm to geopolitical tensions and export restrictions.
Which company shows a better risk-adjusted profile?
DuPont’s most impactful risk is its weak profitability and low ROIC, jeopardizing long-term value creation. Albemarle faces greater volatility and regulatory uncertainty around lithium mining, threatening growth stability. Despite DuPont’s financial distress signals, its diversified operations and moderate leverage offer a more balanced risk profile. Albemarle’s superior Altman Z-Score signals financial safety, but its operational and regulatory vulnerabilities weigh heavily. I remain cautious on Albemarle’s stock volatility and DuPont’s earnings weakness as primary risk drivers in 2026.
Final Verdict: Which stock to choose?
DuPont de Nemours, Inc. (DD) demonstrates a superpower in maintaining solid liquidity and a favorable dividend yield, positioning itself as a resilient cash generator. However, its declining profitability and value destruction are points of vigilance. DD might suit portfolios seeking steady income with some tolerance for operational challenges.
Albemarle Corporation (ALB) leverages a strategic moat through its low debt and strong balance sheet safety, providing a cushion against market turbulence. Despite unfavorable earnings trends, its financial stability appears stronger than DD’s. ALB could appeal to investors focused on risk management with a long-term view.
If you prioritize income generation and moderate risk, DD offers a compelling scenario given its liquidity and dividend consistency. However, if you seek capital preservation and financial safety amid uncertainty, ALB outshines with a sturdier balance sheet and less leverage. Both stocks require careful monitoring of profitability risks.
Disclaimer: Investment carries a risk of loss of initial capital. The past performance is not a reliable indicator of future results. Be sure to understand risks before making an investment decision.
Go Further
I encourage you to read the complete analyses of DuPont de Nemours, Inc. and Albemarle Corporation to enhance your investment decisions: