In the fast-evolving cloud security and infrastructure software sector, Zscaler, Inc. (ZS) and Akamai Technologies, Inc. (AKAM) stand out as key players shaping the future of digital protection and performance. Both companies deliver innovative cloud solutions to secure and optimize internet traffic, making them direct competitors with overlapping markets. This article will help you decide which company presents the most compelling investment opportunity in 2026.

Table of contents
Companies Overview
I will begin the comparison between Zscaler and Akamai by providing an overview of these two companies and their main differences.
Zscaler Overview
Zscaler, Inc. is a cloud security company headquartered in San Jose, California. Its mission is to provide secure access to externally managed applications and internally hosted resources through its cloud platform. Zscaler serves multiple industries, offering solutions like Internet Access, Private Access, Digital Experience, and workload segmentation to enhance security and compliance across diverse environments.
Akamai Overview
Akamai Technologies, Inc., based in Cambridge, Massachusetts, delivers cloud services focused on securing, delivering, and optimizing internet content and business applications. The company offers cybersecurity, web and mobile performance, media delivery, and edge compute solutions. Akamai supports various industries globally with services designed to protect infrastructure and improve user experience over the internet.
Key similarities and differences
Both Zscaler and Akamai operate in the Software – Infrastructure industry, providing cloud-based security and performance solutions. Zscaler emphasizes secure access and workload segmentation within cloud and private environments, while Akamai focuses on content delivery, cybersecurity protection, and edge computing. Their business models share a cloud services foundation, but they target different aspects of internet infrastructure and security.
Income Statement Comparison
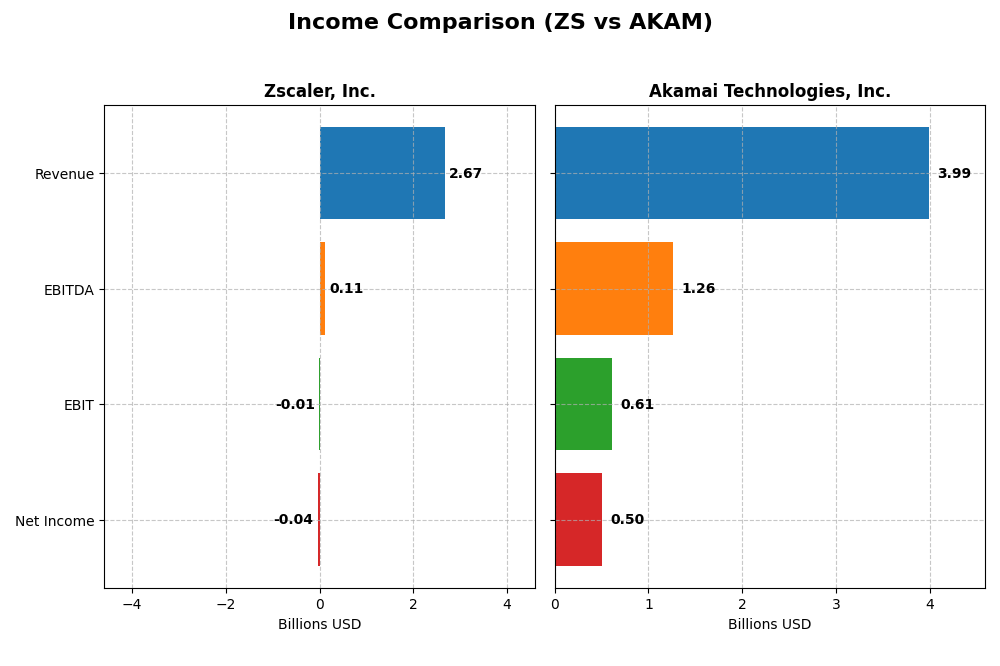
This table presents a side-by-side comparison of the most recent full fiscal year income statement figures for Zscaler, Inc. and Akamai Technologies, Inc.
| Metric | Zscaler, Inc. (ZS) | Akamai Technologies, Inc. (AKAM) |
|---|---|---|
| Market Cap | 34.1B | 13.4B |
| Revenue | 2.67B | 3.99B |
| EBITDA | 112M | 1.26B |
| EBIT | -8.8M | 614M |
| Net Income | -41.5M | 505M |
| EPS | -0.27 | 3.34 |
| Fiscal Year | 2025 | 2024 |
Income Statement Interpretations
Zscaler, Inc.
Zscaler’s revenue surged from $673M in 2021 to $2.67B in 2025, reflecting a robust 297% growth over five years. Despite consistent gross margin strength near 77%, the company has struggled with negative net and EBIT margins, though these improved in 2025. The latest fiscal year showed a favorable 23.3% revenue increase and a 41.7% net margin improvement, signaling operational progress.
Akamai Technologies, Inc.
Akamai’s revenue grew modestly from $3.2B in 2020 to $4.0B in 2024, a 25% increase. It maintained stable, favorable margins with a gross margin near 59% and a positive net margin of 12.65% in 2024. However, the company faced a slight EBIT decline and a neutral 4.7% revenue growth in the latest year, alongside unfavorable trends in net income and earnings per share.
Which one has the stronger fundamentals?
Zscaler demonstrates stronger growth fundamentals with substantial revenue and net income increases alongside improving margins, despite recent losses. Akamai shows consistent profitability and stable margins but weak growth and declining net income metrics. Overall, Zscaler’s dynamic expansion contrasts with Akamai’s slower, less favorable recent performance trends.
Financial Ratios Comparison
The table below presents the latest key financial ratios for Zscaler, Inc. (ZS) and Akamai Technologies, Inc. (AKAM) based on their most recent fiscal year data.
| Ratios | Zscaler, Inc. (ZS) 2025 | Akamai Technologies, Inc. (AKAM) 2024 |
|---|---|---|
| ROE | -2.31% | 10.35% |
| ROIC | -3.18% | 4.74% |
| P/E | -1063 | 28.68 |
| P/B | 24.51 | 2.97 |
| Current Ratio | 2.01 | 1.23 |
| Quick Ratio | 2.01 | 1.23 |
| D/E (Debt-to-Equity) | 1.00 | 0.95 |
| Debt-to-Assets | 27.98% | 44.70% |
| Interest Coverage | -13.49 | 19.67 |
| Asset Turnover | 0.42 | 0.38 |
| Fixed Asset Turnover | 4.22 | 1.33 |
| Payout ratio | 0% | 0% |
| Dividend yield | 0% | 0% |
Interpretation of the Ratios
Zscaler, Inc.
Zscaler presents a mixed ratio profile with several unfavorable financial metrics, including negative net margin (-1.55%) and return on equity (-2.31%), indicating profitability challenges. However, liquidity ratios like current and quick ratio at 2.01 are favorable, reflecting solid short-term financial health. The company does not pay dividends, likely prioritizing reinvestment and growth, with no yield or payout concerns.
Akamai Technologies, Inc.
Akamai shows generally healthier profitability with a favorable net margin of 12.65% and a positive but neutral ROE of 10.35%. The interest coverage ratio at 22.65 is strong, implying good debt servicing ability. Akamai also does not pay dividends, which might reflect a focus on reinvestment or other capital uses despite having a neutral dividend yield status.
Which one has the best ratios?
Comparing both, Akamai holds a more balanced and neutral ratio stance with better profitability and interest coverage, while Zscaler struggles with negative returns and several unfavorable metrics despite strong liquidity. Overall, Akamai’s ratios offer a more stable financial outlook, whereas Zscaler shows more risk and volatility in its financial performance.
Strategic Positioning
This section compares the strategic positioning of Zscaler and Akamai, focusing on Market position, Key segments, and Exposure to technological disruption:
Zscaler, Inc.
- Positioned as a cloud security leader with growing market presence in SaaS and private cloud access.
- Focuses on cloud security solutions, workload segmentation, and digital experience across diverse industries.
- Faces disruption from evolving cloud security needs, emphasizing secure access and workload segmentation.
Akamai Technologies, Inc.
- Established cloud services provider focusing on content delivery, security, and edge computing.
- Provides cloud security, media delivery, web performance, and carrier services globally.
- Exposed to disruption in cloud optimization, cybersecurity, and edge computing innovation.
Zscaler, Inc. vs Akamai Technologies, Inc. Positioning
Zscaler adopts a concentrated strategy in cloud security and workload segmentation, supporting diverse industries. Akamai pursues a more diversified cloud services approach, including content delivery and edge computing. Both face technological disruption but differ in segment focus and scale.
Which has the best competitive advantage?
Both companies are shedding value, but Zscaler shows a growing ROIC trend, indicating improving profitability. Akamai exhibits declining ROIC and profitability, suggesting a weaker competitive moat over the evaluated periods.
Stock Comparison
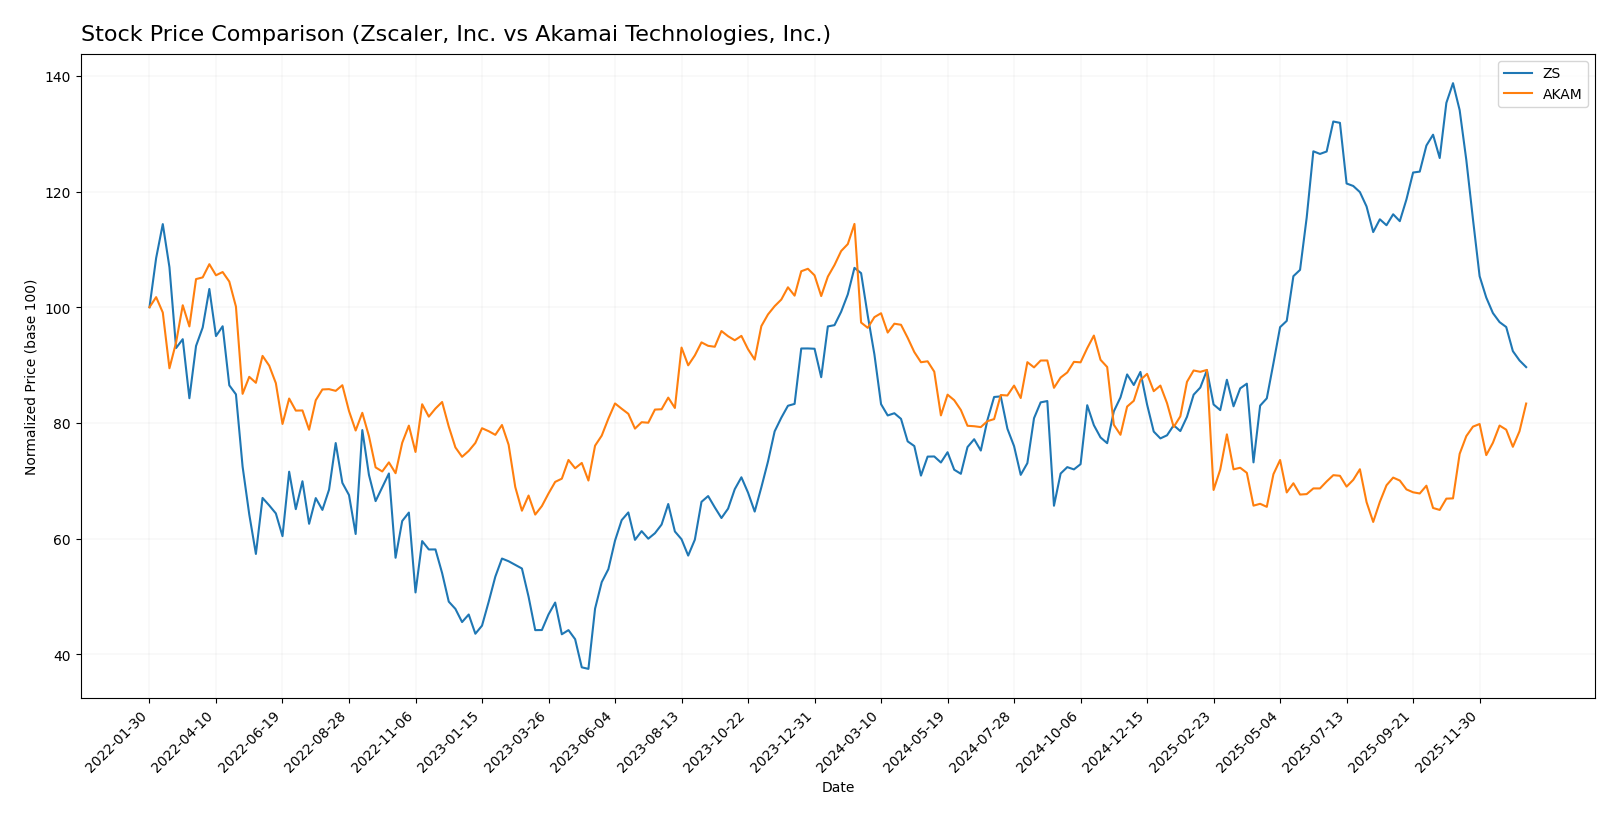
The stock price movements of Zscaler, Inc. and Akamai Technologies, Inc. over the past year reveal contrasting trading dynamics, with notable declines and recent divergent trends in market momentum.
Trend Analysis
Zscaler, Inc. experienced a bearish trend over the past 12 months with a -9.03% price change and decelerating decline, reaching a high of 331.14 and a low of 156.78. Recent trends show a sharper fall of -35.38%.
Akamai Technologies, Inc. also exhibited a bearish trend over the last year with a -13.57% price change but with accelerating downward momentum. However, recent data indicate a 24.49% price increase, suggesting a rebound phase.
Comparing both, Akamai’s stock delivered weaker overall performance but showed stronger recent recovery versus Zscaler, which declined more sharply in the recent period.
Target Prices
Analyst consensus target prices indicate potential upside for both Zscaler, Inc. and Akamai Technologies, Inc.
| Company | Target High | Target Low | Consensus |
|---|---|---|---|
| Zscaler, Inc. | 360 | 260 | 311.41 |
| Akamai Technologies, Inc. | 115 | 89 | 104.8 |
The consensus targets suggest that Zscaler’s stock price, currently around 214 USD, has significant growth potential, while Akamai’s current price near 93.5 USD is also expected to appreciate moderately according to analysts.
Analyst Opinions Comparison
This section compares analysts’ ratings and grades for Zscaler, Inc. and Akamai Technologies, Inc.:
Rating Comparison
ZS Rating
- Rating: C-, considered very favorable overall.
- Discounted Cash Flow Score: 4, rated favorable.
- ROE Score: 1, rated very unfavorable.
- ROA Score: 1, rated very unfavorable.
- Debt To Equity Score: 1, rated very unfavorable.
- Overall Score: 1, rated very unfavorable.
AKAM Rating
- Rating: B, considered very favorable overall.
- Discounted Cash Flow Score: 5, rated very favorable.
- ROE Score: 3, rated moderate.
- ROA Score: 3, rated moderate.
- Debt To Equity Score: 1, rated very unfavorable.
- Overall Score: 3, rated moderate.
Which one is the best rated?
Based on the data, Akamai holds higher ratings with a B overall grade and better scores in discounted cash flow, ROE, ROA, and overall score. Zscaler has lower scores except for a favorable discounted cash flow rating.
Scores Comparison
Here is a comparison of the Altman Z-Score and Piotroski Score for both companies:
Zscaler, Inc. Scores
- Altman Z-Score: 4.89, indicating a safe zone.
- Piotroski Score: 3, categorized as very weak.
Akamai Technologies, Inc. Scores
- Altman Z-Score: 2.46, indicating a grey zone.
- Piotroski Score: 7, categorized as strong.
Which company has the best scores?
Based on the provided data, Zscaler has a higher Altman Z-Score in the safe zone, while Akamai scores higher on the Piotroski scale with a strong rating. Each company shows strengths in different financial health assessments.
Grades Comparison
Here is the comparison of recent grades for Zscaler, Inc. and Akamai Technologies, Inc.:
Zscaler, Inc. Grades
The following table summarizes recent analyst grades for Zscaler, Inc.:
| Grading Company | Action | New Grade | Date |
|---|---|---|---|
| Citigroup | Maintain | Buy | 2026-01-13 |
| Keybanc | Maintain | Overweight | 2026-01-12 |
| Piper Sandler | Maintain | Neutral | 2026-01-05 |
| RBC Capital | Maintain | Outperform | 2026-01-05 |
| Mizuho | Upgrade | Outperform | 2025-12-16 |
| Bernstein | Downgrade | Market Perform | 2025-12-01 |
| Citigroup | Maintain | Buy | 2025-12-01 |
| JP Morgan | Maintain | Overweight | 2025-11-26 |
| Baird | Maintain | Outperform | 2025-11-26 |
| BTIG | Maintain | Buy | 2025-11-26 |
The grades for Zscaler indicate a generally positive outlook with mostly “Buy,” “Outperform,” and “Overweight” ratings, alongside a few neutral and one downgrade to “Market Perform.”
Akamai Technologies, Inc. Grades
The following table summarizes recent analyst grades for Akamai Technologies, Inc.:
| Grading Company | Action | New Grade | Date |
|---|---|---|---|
| Citigroup | Maintain | Neutral | 2026-01-16 |
| Morgan Stanley | Upgrade | Overweight | 2026-01-12 |
| Scotiabank | Maintain | Sector Outperform | 2026-01-09 |
| RBC Capital | Maintain | Sector Perform | 2026-01-05 |
| Piper Sandler | Maintain | Neutral | 2026-01-05 |
| Keybanc | Upgrade | Overweight | 2025-12-15 |
| TD Cowen | Maintain | Hold | 2025-11-13 |
| Citigroup | Maintain | Neutral | 2025-11-11 |
| Scotiabank | Maintain | Sector Outperform | 2025-11-07 |
| Piper Sandler | Maintain | Neutral | 2025-11-07 |
Akamai’s grades show a mix of “Neutral,” “Hold,” and “Sector Outperform” ratings, with recent upgrades to “Overweight” by Morgan Stanley and Keybanc.
Which company has the best grades?
Zscaler, Inc. holds a stronger consensus rating with 42 “Buy” ratings and a consensus of “Buy,” while Akamai Technologies, Inc. has a more mixed outlook with 24 “Buy” and 25 “Hold” ratings, resulting in an overall “Hold” consensus. This suggests that investors may perceive Zscaler as having higher growth or performance potential, though both companies maintain several positive analyst opinions.
Strengths and Weaknesses
Below is a comparative overview of key strengths and weaknesses for Zscaler, Inc. (ZS) and Akamai Technologies, Inc. (AKAM) based on their latest financial and strategic data.
| Criterion | Zscaler, Inc. (ZS) | Akamai Technologies, Inc. (AKAM) |
|---|---|---|
| Diversification | Moderate; focused on cloud security | Higher; broader digital content delivery |
| Profitability | Negative net margin (-1.55%), shedding value but improving ROIC trend | Positive net margin (12.65%), but ROIC declining and below WACC |
| Innovation | Strong innovation focus; growing ROIC trend suggests improving efficiency | Moderate innovation; profitability stable but ROIC declining |
| Global presence | Expanding global footprint, primarily cloud-centric | Established global presence across multiple sectors |
| Market Share | Smaller market share; growth potential | Larger market share in content delivery networks |
Key takeaways: Zscaler shows promise with improving profitability trends despite current losses, driven by innovation in cloud security. Akamai maintains profitability and a strong market position but faces declining efficiency and ROIC, signaling caution for long-term value creation.
Risk Analysis
Below is a comparative overview of key risks for Zscaler, Inc. (ZS) and Akamai Technologies, Inc. (AKAM) based on the most recent data from 2025 and 2024 respectively:
| Metric | Zscaler, Inc. (ZS) | Akamai Technologies, Inc. (AKAM) |
|---|---|---|
| Market Risk | Beta 1.02 indicates average volatility; software sector exposure to tech cycles | Beta 0.69 shows lower volatility; more stable market presence |
| Debt level | Debt-to-assets 28%, moderate leverage; interest coverage negative (-0.92) signals risk | Debt-to-assets 45%, higher leverage; strong interest coverage (22.65) mitigates risk |
| Regulatory Risk | Moderate, with global data privacy and cybersecurity regulations evolving | Moderate, similar exposure to data security laws and internet regulations |
| Operational Risk | High due to negative profitability (net margin -1.55%) and weak returns on equity/assets | Moderate with positive net margin (12.65%) and solid operational efficiency |
| Environmental Risk | Low direct impact; cloud infrastructure with limited physical footprint | Low direct impact; primarily cloud and edge services |
| Geopolitical Risk | Moderate, global customer base may face cross-border data restrictions | Moderate, similar international exposure and geopolitical uncertainties |
Zscaler’s most significant risk stems from operational challenges, highlighted by negative profitability and weak financial returns, compounded by poor interest coverage implying stress in servicing debt. Akamai, while carrying more leverage, benefits from robust earnings and interest coverage, reducing its financial risk. Market volatility is higher for Zscaler, demanding cautious risk management for investors.
Which Stock to Choose?
Zscaler, Inc. shows strong income growth with a 23.31% revenue increase in 2025 and favorable gross margin of 76.87%, yet it has negative profitability ratios, moderate debt levels, and a slightly unfavorable financial ratio profile. Its overall rating is very favorable, despite some weak score metrics.
Akamai Technologies, Inc. presents stable profitability with a 12.65% net margin and positive returns on equity and assets, but its growth is slower with a 4.7% revenue rise in 2024. Financial ratios are neutral overall, debt is moderate, and the rating is very favorable with stronger financial scores than Zscaler.
For those prioritizing rapid growth and improving profitability, Zscaler may appear attractive given its favorable income trends despite some financial weaknesses. Conversely, Akamai might suit investors seeking steadier returns and more balanced financial ratios, reflecting a more neutral risk profile.
Disclaimer: Investment carries a risk of loss of initial capital. The past performance is not a reliable indicator of future results. Be sure to understand risks before making an investment decision.
Go Further
I encourage you to read the complete analyses of Zscaler, Inc. and Akamai Technologies, Inc. to enhance your investment decisions: