Akamai Technologies, Inc. and Wix.com Ltd. are two prominent players in the software infrastructure sector, each driving innovation in cloud-based solutions. Akamai focuses on content delivery and cybersecurity, while Wix empowers users to create and manage websites with ease. Both companies share market overlap in enabling digital presence and performance. In this article, I will analyze which company offers the most compelling investment opportunity for your portfolio.

Table of contents
Companies Overview
I will begin the comparison between Akamai Technologies, Inc. and Wix.com Ltd. by providing an overview of these two companies and their main differences.
Akamai Technologies, Inc. Overview
Akamai Technologies, Inc. specializes in cloud services aimed at securing, delivering, and optimizing content and business applications globally. Positioned in the software infrastructure industry, it offers cybersecurity, media delivery, edge computing, and performance solutions to enhance website and application security and speed. The company operates through direct sales and channel partners and is headquartered in Cambridge, Massachusetts.
Wix.com Ltd. Overview
Wix.com Ltd. provides a cloud-based platform that enables users worldwide to create websites and web applications easily. The company offers visual editing tools, AI-driven website creation, payment solutions, and a suite of business applications. Operating in the software infrastructure sector, Wix supports over 222M registered users and 6M premium subscribers, with its headquarters in Tel Aviv, Israel.
Key similarities and differences
Both companies operate in the software infrastructure sector with cloud-focused services, but Akamai emphasizes cybersecurity and content delivery, while Wix focuses on website creation and business tools. Akamai’s business model centers on enterprise-level cloud security and performance, whereas Wix targets individual users and small businesses with accessible web development platforms. Their geographic bases and scale of operations also differ, reflecting distinct market approaches.
Income Statement Comparison
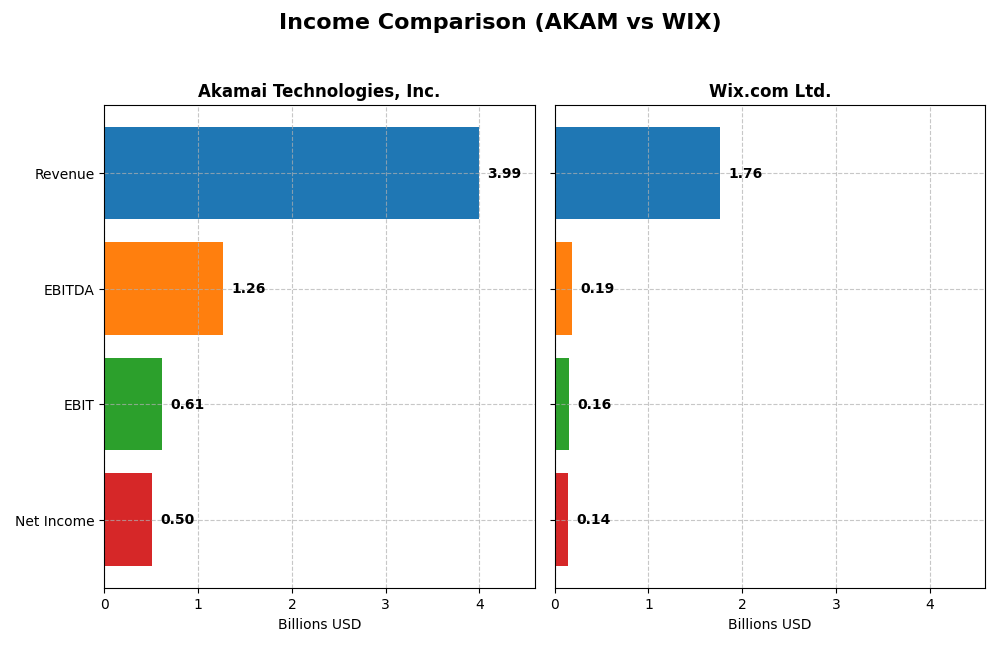
This table presents a side-by-side comparison of key income statement metrics for Akamai Technologies, Inc. and Wix.com Ltd. for the fiscal year 2024, highlighting their financial performance.
| Metric | Akamai Technologies, Inc. | Wix.com Ltd. |
|---|---|---|
| Market Cap | 13.4B | 4.5B |
| Revenue | 3.99B | 1.76B |
| EBITDA | 1.26B | 186M |
| EBIT | 614M | 155M |
| Net Income | 505M | 138M |
| EPS | 3.34 | 2.49 |
| Fiscal Year | 2024 | 2024 |
Income Statement Interpretations
Akamai Technologies, Inc.
Akamai’s revenue grew steadily from 3.2B in 2020 to nearly 4B in 2024, a 24.8% increase over five years. However, net income declined by 9.36% overall, with net margins slipping to 12.65% in 2024. The most recent year showed slowed growth, with revenue up 4.7% but EBIT and net margins falling, signaling margin pressure amid rising expenses.
Wix.com Ltd.
Wix demonstrated robust revenue growth, reaching 1.76B in 2024 from under 1B in 2020, a 78.86% increase. Net income improved dramatically, more than doubling over the period, with net margin rising to 7.86% in 2024. The latest year saw marked acceleration in revenue and profit growth, alongside expanding margins, reflecting operational leverage and cost control.
Which one has the stronger fundamentals?
Wix exhibits stronger fundamentals, with consistently favorable growth across revenue, net income, and margins, including a 270% net margin improvement last year. In contrast, Akamai shows mixed results: solid revenue gains but declining profitability and unfavorable margin trends. Wix’s positive momentum and margin expansion suggest a more robust income statement profile.
Financial Ratios Comparison
The table below compares key financial ratios for Akamai Technologies, Inc. and Wix.com Ltd. for the fiscal year 2024, providing a snapshot of their profitability, liquidity, leverage, efficiency, and dividend metrics.
| Ratios | Akamai Technologies, Inc. (AKAM) | Wix.com Ltd. (WIX) |
|---|---|---|
| ROE | 10.35% | -175.57% |
| ROIC | 4.74% | 9.13% |
| P/E | 28.68 | 86.21 |
| P/B | 2.97 | -151.35 |
| Current Ratio | 1.23 | 0.84 |
| Quick Ratio | 1.23 | 0.84 |
| D/E | 0.95 | -12.31 |
| Debt-to-Assets | 44.70% | 50.70% |
| Interest Coverage | 19.67 | 25.92 |
| Asset Turnover | 0.38 | 0.92 |
| Fixed Asset Turnover | 1.33 | 3.33 |
| Payout ratio | 0% | 0% |
| Dividend yield | 0% | 0% |
Interpretation of the Ratios
Akamai Technologies, Inc.
Akamai shows a balanced ratio profile with strong net margin (12.65%, favorable) and interest coverage (22.65, favorable), but faces challenges in return on invested capital (4.74%, unfavorable) and asset turnover (0.38, unfavorable). Its valuation metrics like PE ratio (28.68, unfavorable) suggest premium pricing. The company does not pay dividends, likely focusing on reinvestment and growth, as indicated by zero dividend yield.
Wix.com Ltd.
Wix exhibits mixed ratios, including a neutral net margin (7.86%) and unfavorable negative return on equity (-175.57%). It has a high PE ratio (86.21, unfavorable) and weak liquidity (current ratio 0.84, unfavorable). The company also does not pay dividends, possibly due to reinvestment priorities and a high-growth phase, despite favorable interest coverage and fixed asset turnover ratios.
Which one has the best ratios?
Akamai’s ratios are globally neutral with a more balanced financial position, contrasting Wix’s slightly unfavorable profile marked by significant liquidity concerns and negative equity returns. Akamai’s stable profitability and coverage metrics offer more consistent fundamentals, whereas Wix’s higher risk and valuation metrics reflect more volatility and reinvestment focus.
Strategic Positioning
This section compares the strategic positioning of Akamai Technologies, Inc. (AKAM) and Wix.com Ltd. (WIX) including market position, key segments, and exposure to technological disruption:
Akamai Technologies, Inc.
- Large market cap of $13.4B in software infrastructure with moderate competitive pressure.
- Focused on cloud services for content delivery, cybersecurity, media streaming, and edge compute.
- Positioned in cybersecurity and content delivery with edge computing, facing ongoing digital threats.
Wix.com Ltd.
- Smaller market cap of $4.5B, higher beta, facing dynamic competition in cloud-based platforms.
- Diversified cloud platform offering website creation, business solutions, payments, and apps.
- Leveraging AI and cloud tech for website building, business automation, and payment processing.
Akamai vs Wix Positioning
Akamai operates a concentrated business model focused on infrastructure and cybersecurity, delivering large-scale cloud solutions. Wix pursues a more diversified approach with multiple cloud-based business and creative subscription services, broadening its user base and revenue streams.
Which has the best competitive advantage?
Both companies currently shed value with ROIC below WACC, but Wix shows improving profitability trends, while Akamai experiences declining returns, indicating Wix may have a slightly more favorable moat trajectory.
Stock Comparison
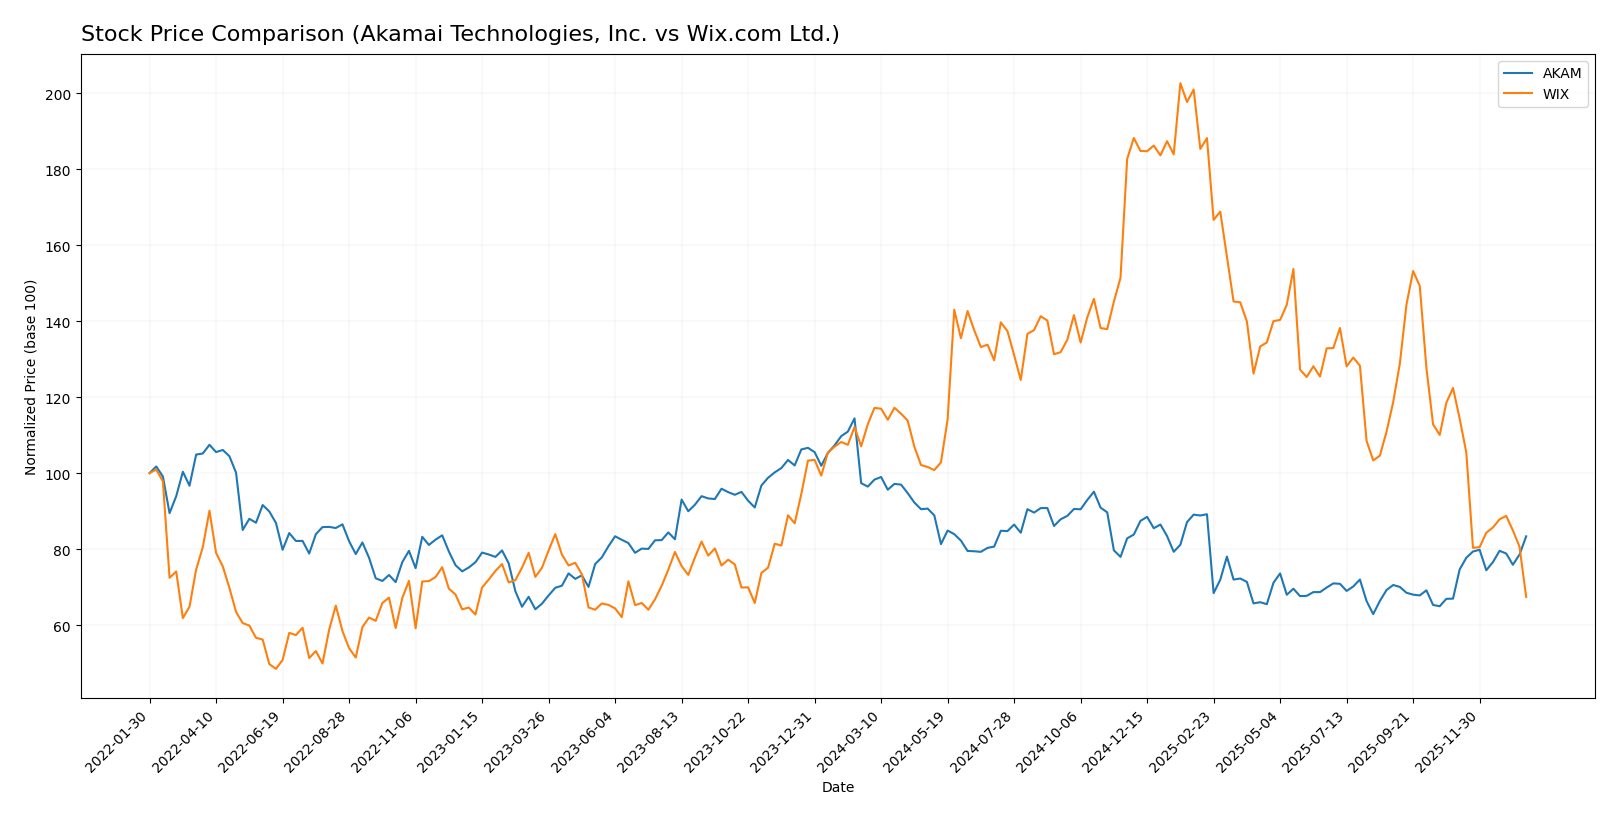
The stock prices of Akamai Technologies, Inc. (AKAM) and Wix.com Ltd. (WIX) have shown contrasting dynamics over the past 12 months, with AKAM experiencing a moderate recovery recently while WIX has faced continued declines and decelerating bearish momentum.
Trend Analysis
Akamai Technologies, Inc. (AKAM) recorded a 13.57% price drop over the past year, indicating a bearish trend with accelerating negative momentum. However, the recent two-and-a-half-month period shows a strong rebound of 24.49%, with buyer dominance and reduced volatility.
Wix.com Ltd. (WIX) showed a sharper decline of 40.28% over the past year, confirming a bearish trend with decelerating downward pressure. Its recent trend worsened with a 44.92% drop, accompanied by seller dominance and high volatility.
Comparing both stocks, AKAM delivered the highest market performance over the past year, supported by a recent bullish recovery, whereas WIX has experienced deeper losses and increasing seller pressure.
Target Prices
The current analyst consensus indicates promising upside potential for both Akamai Technologies, Inc. and Wix.com Ltd.
| Company | Target High | Target Low | Consensus |
|---|---|---|---|
| Akamai Technologies, Inc. | 115 | 89 | 104.8 |
| Wix.com Ltd. | 210 | 70 | 160.27 |
Analysts see Akamai’s stock climbing from its current price of $93.49 toward a consensus target of $104.8, signaling modest growth expectations. Wix.com’s consensus target of $160.27 suggests significant upside compared to its present price of $80.16, reflecting higher growth anticipation but with wider risk.
Analyst Opinions Comparison
This section compares analysts’ ratings and grades for Akamai Technologies, Inc. and Wix.com Ltd.:
Rating Comparison
AKAM Rating
- Rating: B, considered very favorable by analysts.
- Discounted Cash Flow Score: 5, indicating very favorable valuation based on future cash flows.
- ROE Score: 3, reflecting moderate efficiency in generating profit from equity.
- ROA Score: 3, showing moderate effectiveness in asset utilization.
- Debt To Equity Score: 1, signaling very unfavorable financial risk due to high leverage.
- Overall Score: 3, reflecting a moderate overall financial standing.
WIX Rating
- Rating: C, considered very favorable despite lower grade.
- Discounted Cash Flow Score: 3, showing a moderate valuation.
- ROE Score: 1, rated very unfavorable for profitability efficiency.
- ROA Score: 4, considered favorable for asset utilization.
- Debt To Equity Score: 1, also very unfavorable for financial risk.
- Overall Score: 2, indicating a moderate but lower overall standing than AKAM.
Which one is the best rated?
Based strictly on the provided data, Akamai Technologies holds a better overall rating (B vs. C) and higher scores in discounted cash flow and return on equity, while Wix shows strengths only in return on assets. AKAM is thus the better rated company.
Scores Comparison
Here is a comparison of the Altman Z-Score and Piotroski Score for Akamai Technologies and Wix.com Ltd.:
Akamai Scores
- Altman Z-Score of 2.46 places Akamai in the moderate risk grey zone.
- Piotroski Score of 7 indicates Akamai has strong financial health.
Wix Scores
- Altman Z-Score of 1.83 places Wix in the moderate risk grey zone.
- Piotroski Score of 6 indicates Wix has average financial health.
Which company has the best scores?
Akamai and Wix are both in the Altman Z-Score grey zone, indicating moderate bankruptcy risk. However, Akamai’s higher Piotroski Score (7 vs. 6) suggests stronger overall financial health compared to Wix.
Grades Comparison
Here is a comparison of recent grades and ratings from reputable financial institutions for both companies:
Akamai Technologies, Inc. Grades
The following table summarizes Akamai’s grades from major financial firms over the past few months.
| Grading Company | Action | New Grade | Date |
|---|---|---|---|
| Citigroup | Maintain | Neutral | 2026-01-16 |
| Morgan Stanley | Upgrade | Overweight | 2026-01-12 |
| Scotiabank | Maintain | Sector Outperform | 2026-01-09 |
| RBC Capital | Maintain | Sector Perform | 2026-01-05 |
| Piper Sandler | Maintain | Neutral | 2026-01-05 |
| Keybanc | Upgrade | Overweight | 2025-12-15 |
| TD Cowen | Maintain | Hold | 2025-11-13 |
| Citigroup | Maintain | Neutral | 2025-11-11 |
| Scotiabank | Maintain | Sector Outperform | 2025-11-07 |
| Piper Sandler | Maintain | Neutral | 2025-11-07 |
Akamai’s grades show a stable to slightly positive outlook with multiple maintained neutral and sector outperform ratings, alongside recent upgrades to overweight by notable firms.
Wix.com Ltd. Grades
Below is a summary of Wix.com’s grades from established financial analysts across recent months.
| Grading Company | Action | New Grade | Date |
|---|---|---|---|
| Morgan Stanley | Maintain | Overweight | 2026-01-15 |
| Wells Fargo | Maintain | Overweight | 2025-12-19 |
| Cantor Fitzgerald | Maintain | Overweight | 2025-12-11 |
| Wells Fargo | Maintain | Overweight | 2025-11-20 |
| Barclays | Maintain | Overweight | 2025-11-20 |
| Citizens | Maintain | Market Outperform | 2025-11-20 |
| Citigroup | Maintain | Buy | 2025-11-20 |
| Scotiabank | Maintain | Sector Outperform | 2025-11-20 |
| Needham | Maintain | Buy | 2025-11-20 |
| Evercore ISI Group | Maintain | Outperform | 2025-11-20 |
Wix.com consistently holds strong positive ratings, with multiple overweight and buy grades, indicating broad analyst confidence in its prospects.
Which company has the best grades?
Wix.com Ltd. has received noticeably stronger grades and a more favorable consensus (“Buy”) compared to Akamai Technologies, Inc.’s “Hold” consensus. This could suggest higher analyst conviction for Wix’s growth potential, potentially impacting investor sentiment and portfolio allocation preferences.
Strengths and Weaknesses
Below is a comparison of Akamai Technologies, Inc. (AKAM) and Wix.com Ltd. (WIX) based on their key strengths and weaknesses using the latest available data.
| Criterion | Akamai Technologies, Inc. (AKAM) | Wix.com Ltd. (WIX) |
|---|---|---|
| Diversification | Primarily focused on content delivery and cloud services with limited segmentation (3.99B USD revenue in one segment) | More diversified revenue streams: Business Solutions (495.7M USD) and Creative Subscription (1.26B USD) |
| Profitability | Net margin 12.65% (favorable), but ROIC 4.74% below WACC indicating value destruction | Net margin 7.86% (neutral), ROIC 9.13% slightly below WACC but showing improving profitability trend |
| Innovation | Long-standing market presence but facing declining ROIC (-44%) suggests innovation challenges | ROIC growing 159%, indicating improving returns likely fueled by product and service innovation |
| Global presence | Strong global CDN network presence but limited revenue segmentation | Expanding global footprint with diversified product lines and growing revenue segments |
| Market Share | Established player in CDN with stable market share but declining efficiency | Growing market share in website building and business solutions with increasing revenues |
Akamai shows strengths in profitability and a strong global content delivery network but suffers from declining operational efficiency and value destruction. Wix demonstrates a promising growth trajectory in innovation and diversification, though profitability remains slightly unfavorable. Investors should weigh Akamai’s stability against Wix’s growth potential and improving returns.
Risk Analysis
Below is a summary table of key risks for Akamai Technologies, Inc. (AKAM) and Wix.com Ltd. (WIX) based on their latest 2024 financial and operational data.
| Metric | Akamai Technologies, Inc. (AKAM) | Wix.com Ltd. (WIX) |
|---|---|---|
| Market Risk | Moderate (Beta 0.685, stable tech sector exposure) | Higher (Beta 1.418, volatile stock price range) |
| Debt Level | Moderate (Debt-to-Assets 44.7%, Debt-to-Equity Neutral) | Elevated (Debt-to-Assets 50.7%, Debt-to-Equity Unfavorable) |
| Regulatory Risk | Moderate (U.S.-based, global cloud services) | Elevated (Israel-based, international cloud platform) |
| Operational Risk | Moderate (Large workforce, complex cloud infrastructure) | Moderate (Smaller workforce, rapid product innovation) |
| Environmental Risk | Low (Tech industry, limited direct environmental impact) | Low (Cloud services, minimal direct environmental footprint) |
| Geopolitical Risk | Moderate (U.S. headquartered with global operations) | Higher (Israel headquartered with broad international reach) |
Akamai shows moderate exposure to market and geopolitical risks but maintains balanced debt levels and solid operational stability. Wix faces higher market volatility and financial leverage concerns, with significant regulatory and geopolitical risks due to its international footprint. Investors should monitor Wix’s debt metrics and geopolitical developments closely, as these pose the most likely and impactful risks to investment value.
Which Stock to Choose?
Akamai Technologies, Inc. (AKAM) shows moderate income growth with a 4.7% revenue increase in 2024 but faces declining profitability and net margin contraction. Its financial ratios are mixed, featuring favorable net margin and interest coverage, yet an unfavorable ROIC and balanced debt ratios, supported by a very favorable overall rating.
Wix.com Ltd. (WIX) exhibits strong income growth, with 12.74% revenue growth and robust margin expansion in 2024. However, it has a negative return on equity and weaker liquidity, reflected in unfavorable debt and valuation ratios. Its overall rating is slightly less favorable, with a less stable financial profile despite improving profitability.
For investors prioritizing income statement strength and growth, Wix may appear more appealing given its favorable income trends and improving profitability. Conversely, those valuing balanced financial ratios and ratings might find Akamai’s profile more neutral but stable. The choice could depend on whether an investor leans toward growth or financial stability considerations.
Disclaimer: Investment carries a risk of loss of initial capital. The past performance is not a reliable indicator of future results. Be sure to understand risks before making an investment decision.
Go Further
I encourage you to read the complete analyses of Akamai Technologies, Inc. and Wix.com Ltd. to enhance your investment decisions: