In the dynamic world of technology, Akamai Technologies, Inc. and Veritone, Inc. stand out as innovative players in the software infrastructure sector. Akamai focuses on cloud security and content delivery, while Veritone leads in artificial intelligence computing solutions. Their shared emphasis on cutting-edge technology and market overlap makes them compelling candidates for comparison. Join me as we explore which company offers the most attractive investment opportunity in 2026.
Table of contents
Companies Overview
I will begin the comparison between Akamai Technologies and Veritone by providing an overview of these two companies and their main differences.
Akamai Technologies Overview
Akamai Technologies, Inc. specializes in cloud services focused on securing, delivering, and optimizing internet content and business applications globally. It offers solutions to protect infrastructure, applications, and users from cyber threats while enhancing web and mobile performance. Akamai also provides media delivery, edge compute, and carrier services, supporting customers with integration and management. The company operates primarily through direct sales and channel partners.
Veritone Overview
Veritone, Inc. delivers artificial intelligence computing solutions via its aiWARE platform, which applies machine learning and cognitive processes to extract insights from structured and unstructured data. It serves diverse sectors including media, government, legal, and energy, offering AI-driven services such as transcription, recognition, and analytics. Veritone also provides media advertising agency services, engaging clients directly and through marketing intermediaries.
Key similarities and differences
Both companies operate within the software infrastructure industry, focusing on technology-driven solutions. Akamai emphasizes cloud security, content delivery, and performance optimization, while Veritone centers on AI-powered data analytics and media services. Akamai has a significantly larger workforce and market capitalization, reflecting its established global presence compared to Veritone’s specialized AI platform and smaller scale.
Income Statement Comparison
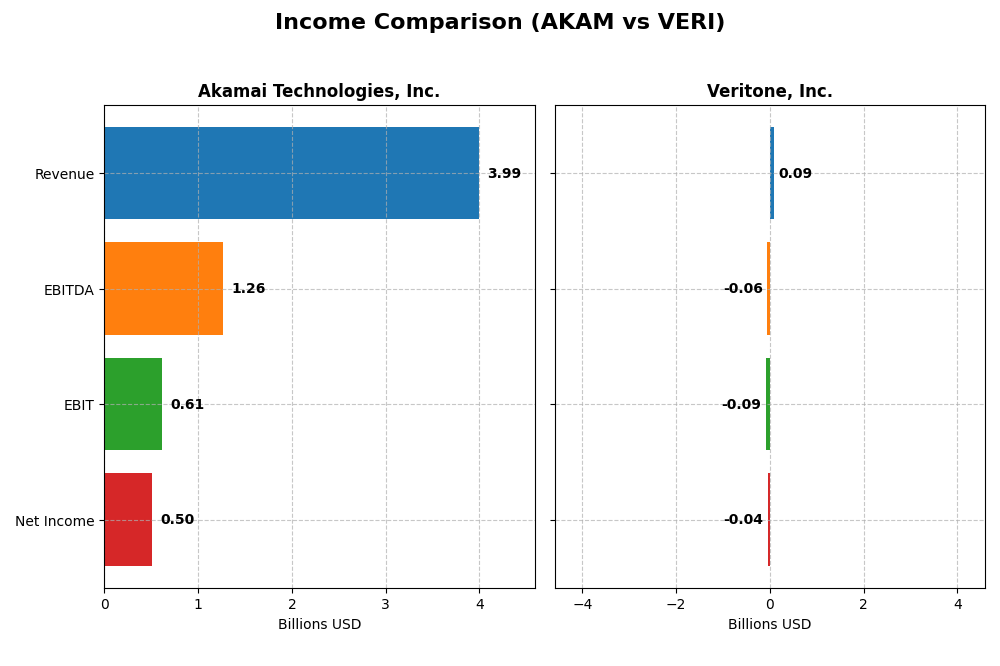
The table below presents a side-by-side comparison of key income statement metrics for Akamai Technologies, Inc. and Veritone, Inc. for the fiscal year 2024.
| Metric | Akamai Technologies, Inc. | Veritone, Inc. |
|---|---|---|
| Market Cap | 13.4B | 225M |
| Revenue | 3.99B | 93M |
| EBITDA | 1.26B | -59M |
| EBIT | 614M | -88M |
| Net Income | 505M | -37M |
| EPS | 3.34 | -0.98 |
| Fiscal Year | 2024 | 2024 |
Income Statement Interpretations
Akamai Technologies, Inc.
Akamai’s revenue shows steady growth from 2020 to 2024, increasing by 24.8%, yet net income declined by 9.36% over the same period. Margins remain strong with a gross margin of 59.39% and a net margin of 12.65%, though recent year metrics indicate a slowdown, with EBIT and net margin shrinking by 8.37% and 11.94%, respectively. Operating expenses rose in line with revenue, pressuring profitability in 2024.
Veritone, Inc.
Veritone’s revenue increased substantially by 60.53% from 2020 to 2024 but fell by 7.35% in the latest year. Despite high gross margins at 70.58%, the company shows negative EBIT and net margins of -95.13% and -40.36%, respectively. However, net margin and EPS improved significantly in 2024, growing by 31.17% and 38.36%, reflecting a partial recovery amid ongoing losses and elevated interest expenses.
Which one has the stronger fundamentals?
Akamai demonstrates more consistent profitability and stable margins, albeit with recent declines in income growth and margins, indicating some pressure on earnings. Veritone exhibits rapid revenue growth and improving profitability metrics recently but remains unprofitable overall with large negative margins and high interest expenses. Fundamentally, Akamai shows stronger earnings stability, while Veritone’s growth is offset by persistent losses.
Financial Ratios Comparison
The table below presents a side-by-side comparison of key financial ratios for Akamai Technologies, Inc. and Veritone, Inc. based on their most recent fiscal year data from 2024.
| Ratios | Akamai Technologies, Inc. (AKAM) | Veritone, Inc. (VERI) |
|---|---|---|
| ROE | 10.35% | -277.91% |
| ROIC | 4.74% | -58.27% |
| P/E | 28.68 | -3.34 |
| P/B | 2.97 | 9.27 |
| Current Ratio | 1.23 | 0.97 |
| Quick Ratio | 1.23 | 0.97 |
| D/E (Debt-to-Equity) | 0.95 | 8.91 |
| Debt-to-Assets | 44.70% | 60.54% |
| Interest Coverage | 19.67 | -7.31 |
| Asset Turnover | 0.38 | 0.47 |
| Fixed Asset Turnover | 1.33 | 8.51 |
| Payout ratio | 0 | 0 |
| Dividend yield | 0 | 0 |
Interpretation of the Ratios
Akamai Technologies, Inc.
Akamai’s ratios reflect a generally balanced financial position with 28.57% favorable and 28.57% unfavorable indicators, resulting in a neutral global evaluation. Net margin at 12.65% is favorable, but return on invested capital (4.74%) and asset turnover (0.38) are less strong. The company does not pay dividends, indicating a focus likely on reinvestment and growth rather than shareholder payouts.
Veritone, Inc.
Veritone’s financial ratios are predominantly weak, with 78.57% unfavorable and only 14.29% favorable metrics, leading to a very unfavorable overall assessment. Negative net margin (-40.36%), return on equity (-277.91%), and a high debt-to-equity ratio (8.91) highlight significant financial challenges. The absence of dividends aligns with ongoing losses and priority on R&D and expansion.
Which one has the best ratios?
Comparing both, Akamai exhibits a more stable and balanced ratio profile with a neutral rating, while Veritone faces considerable financial difficulties reflected in mostly unfavorable ratios. Akamai’s stronger profitability and coverage ratios contrast with Veritone’s high leverage and negative returns, marking Akamai as having the better ratio set between the two.
Strategic Positioning
This section compares the strategic positioning of Akamai Technologies, Inc. and Veritone, Inc. in terms of market position, key segments, and exposure to technological disruption:
Akamai Technologies, Inc.
- Large market cap of 13.4B, operating in cloud infrastructure with moderate beta of 0.685.
- Core business in cloud security, content delivery, edge compute, and web performance solutions.
- Positioned in cloud services with offerings in cybersecurity and edge computing, facing disruption risks in AI.
Veritone, Inc.
- Small market cap of 225M, focused on AI computing solutions with higher beta of 2.05, indicating volatility.
- Business driven by AI platform services, media advertising, and managed AI-powered solutions across sectors.
- AI-centric firm reliant on machine learning and cognitive processing, highly exposed to rapid AI technology changes.
Akamai vs Veritone Positioning
Akamai has a diversified cloud infrastructure portfolio with significant scale, while Veritone concentrates on AI and media advertising. Akamai’s broad service offering contrasts with Veritone’s niche focus, reflecting different market scopes and volatility profiles.
Which has the best competitive advantage?
Both companies show very unfavorable MOAT evaluations with declining ROIC and capital inefficiency, indicating neither currently sustains a strong competitive advantage based on value creation metrics.
Stock Comparison
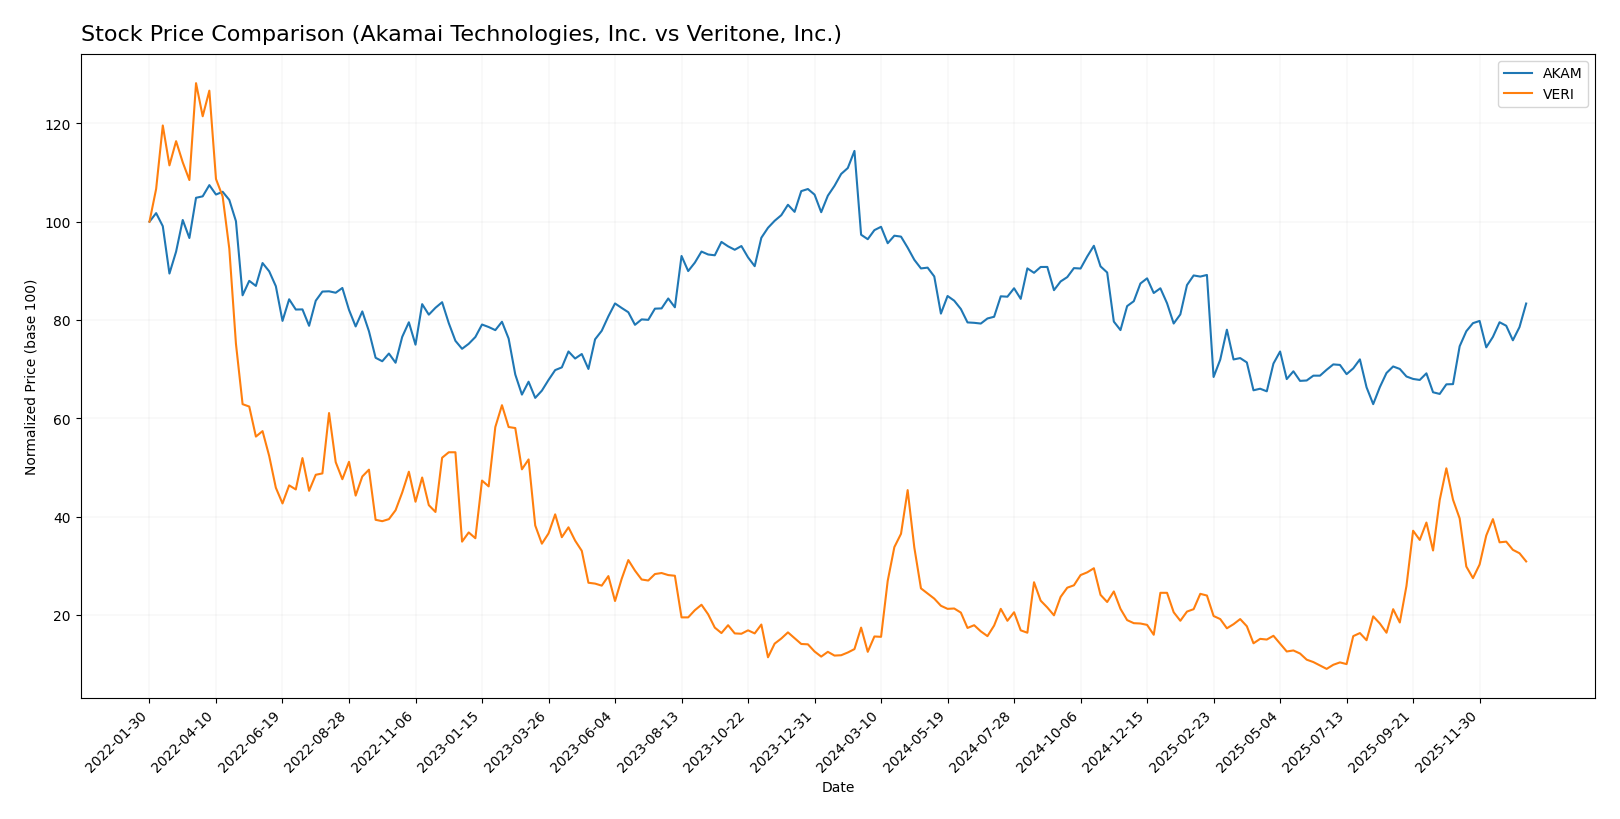
The stock price chart highlights significant divergences in price movements and trading dynamics between Akamai Technologies, Inc. and Veritone, Inc. over the past year.
Trend Analysis
Akamai Technologies, Inc. exhibited a bearish trend over the past 12 months, with a price decline of -13.57%, showing acceleration and a high volatility of 10.92. The stock ranged between 70.53 and 111.0.
Veritone, Inc. showed a strong bullish trend over the same period, with a 147.22% price increase but deceleration in momentum. Volatility was low at 1.26, with prices fluctuating between 1.3 and 7.18.
Comparing both, Veritone delivered the highest market performance with a substantial price gain, while Akamai experienced a notable decline despite recent short-term gains.
Target Prices
Here is the target price consensus from verified analysts for Akamai Technologies, Inc. and Veritone, Inc.:
| Company | Target High | Target Low | Consensus |
|---|---|---|---|
| Akamai Technologies, Inc. | 115 | 89 | 104.8 |
| Veritone, Inc. | 10 | 9 | 9.5 |
Analysts expect Akamai’s stock to trade moderately above its current price of 93.49 USD, suggesting upside potential. Veritone’s consensus target significantly exceeds its current price of 4.45 USD, indicating bullish sentiment.
Analyst Opinions Comparison
This section compares analysts’ ratings and financial scores for Akamai Technologies, Inc. and Veritone, Inc.:
Rating Comparison
AKAM Rating
- Rating: B, indicating a very favorable evaluation overall.
- Discounted Cash Flow Score: 5, very favorable, showing strong future cash flow prospects.
- ROE Score: 3, moderate efficiency in generating profit from equity.
- ROA Score: 3, moderate effectiveness in asset utilization.
- Debt To Equity Score: 1, very unfavorable, suggesting high financial risk.
- Overall Score: 3, moderate overall financial standing.
VERI Rating
- Rating: C, indicating a very favorable evaluation overall.
- Discounted Cash Flow Score: 5, very favorable, showing strong future cash flow prospects.
- ROE Score: 1, very unfavorable, indicating low profitability on equity.
- ROA Score: 1, very unfavorable, showing poor asset utilization.
- Debt To Equity Score: 1, very unfavorable, indicating high financial risk.
- Overall Score: 2, moderate overall financial standing but lower than AKAM.
Which one is the best rated?
Based strictly on the provided data, Akamai Technologies holds a higher rating of B compared to Veritone’s C. AKAM also scores better in ROE, ROA, and overall score, despite both sharing a very unfavorable debt-to-equity rating.
Scores Comparison
Here is a comparison of the Altman Z-Score and Piotroski Score for Akamai Technologies, Inc. and Veritone, Inc.:
AKAM Scores
- Altman Z-Score: 2.46, in the grey zone indicating moderate bankruptcy risk.
- Piotroski Score: 7, classified as strong financial health.
VERI Scores
- Altman Z-Score: -0.07, in the distress zone indicating high bankruptcy risk.
- Piotroski Score: 3, classified as very weak financial health.
Which company has the best scores?
Based on the provided data, Akamai Technologies has better scores with a grey zone Altman Z-Score and a strong Piotroski Score. Veritone shows a distress zone Altman Z-Score and a very weak Piotroski Score, indicating weaker financial health.
Grades Comparison
The following tables and summaries present the latest reliable grades for Akamai Technologies, Inc. and Veritone, Inc.:
Akamai Technologies, Inc. Grades
This table summarizes recent grades from recognized financial institutions for Akamai Technologies, Inc.
| Grading Company | Action | New Grade | Date |
|---|---|---|---|
| Citigroup | Maintain | Neutral | 2026-01-16 |
| Morgan Stanley | Upgrade | Overweight | 2026-01-12 |
| Scotiabank | Maintain | Sector Outperform | 2026-01-09 |
| RBC Capital | Maintain | Sector Perform | 2026-01-05 |
| Piper Sandler | Maintain | Neutral | 2026-01-05 |
| Keybanc | Upgrade | Overweight | 2025-12-15 |
| TD Cowen | Maintain | Hold | 2025-11-13 |
| Citigroup | Maintain | Neutral | 2025-11-11 |
| Scotiabank | Maintain | Sector Outperform | 2025-11-07 |
| Piper Sandler | Maintain | Neutral | 2025-11-07 |
Overall, Akamai’s grades reflect a stable to moderately positive outlook with multiple maintains and a couple of upgrades toward overweight ratings.
Veritone, Inc. Grades
This table presents recent grades for Veritone, Inc. from recognized grading entities.
| Grading Company | Action | New Grade | Date |
|---|---|---|---|
| D. Boral Capital | Maintain | Buy | 2025-12-09 |
| D. Boral Capital | Maintain | Buy | 2025-12-04 |
| Needham | Maintain | Buy | 2025-12-02 |
| D. Boral Capital | Maintain | Buy | 2025-12-02 |
| D. Boral Capital | Maintain | Buy | 2025-11-07 |
| D. Boral Capital | Maintain | Buy | 2025-10-28 |
| HC Wainwright & Co. | Maintain | Buy | 2025-10-20 |
| D. Boral Capital | Maintain | Buy | 2025-10-15 |
| D. Boral Capital | Maintain | Buy | 2025-09-24 |
| D. Boral Capital | Maintain | Buy | 2025-09-09 |
Veritone’s ratings consistently show a strong buy bias with all recent grades maintaining a Buy status across multiple firms.
Which company has the best grades?
Veritone, Inc. has received consistently higher grades with unanimous Buy ratings from multiple sources, compared to Akamai Technologies, Inc., whose grades mostly range from Hold to Overweight. This suggests Veritone is viewed more favorably by analysts, which may imply higher confidence in its prospects and could influence investor sentiment accordingly.
Strengths and Weaknesses
Below is a comparative overview of the key strengths and weaknesses of Akamai Technologies, Inc. (AKAM) and Veritone, Inc. (VERI) based on their latest financial performance and market positioning.
| Criterion | Akamai Technologies, Inc. (AKAM) | Veritone, Inc. (VERI) |
|---|---|---|
| Diversification | High revenue from a broad product segment (~$3.99B) | Moderate diversification across licenses, managed services, and software (~$110M total) |
| Profitability | Positive net margin (12.65%) but declining ROIC (4.74%, unfavorable) | Negative net margin (-40.36%) and very unfavorable ROIC (-58.27%) |
| Innovation | Established tech infrastructure, moderate innovation (neutral ROE 10.35%) | Focus on AI-driven software products but struggling financially (unfavorable ROE -277.91%) |
| Global presence | Strong global footprint with stable operational metrics | Smaller scale with niche AI and media services, limited global reach |
| Market Share | Significant market share in content delivery and cloud services | Smaller player in AI and software services, limited market penetration |
Key takeaways: Akamai shows stronger market presence and diversification with moderate profitability decline, while Veritone faces severe profitability challenges despite its innovative AI focus. Investors should weigh Akamai’s stability against Veritone’s high risk and growth uncertainty.
Risk Analysis
Below is a comparative table summarizing key risk metrics for Akamai Technologies, Inc. (AKAM) and Veritone, Inc. (VERI) as of 2024:
| Metric | Akamai Technologies, Inc. (AKAM) | Veritone, Inc. (VERI) |
|---|---|---|
| Market Risk | Beta 0.685 (lower volatility) | Beta 2.052 (high volatility) |
| Debt Level | Debt/Equity 0.95 (neutral) | Debt/Equity 8.91 (very high) |
| Regulatory Risk | Moderate (technology sector) | Moderate (AI and media) |
| Operational Risk | Moderate (large scale cloud ops) | High (early-stage AI platform) |
| Environmental Risk | Low | Low |
| Geopolitical Risk | Moderate (global internet infra) | Moderate (US/UK focus) |
Summary: Veritone faces significantly higher financial risk with heavy debt levels, negative profitability, and a distress Altman Z-Score, making bankruptcy risk elevated. Akamai’s risks center more on operational scale and moderate debt but benefits from stable margins and lower market volatility. Veritone’s high beta and financial distress present the most impactful and likely risks for investors.
Which Stock to Choose?
Akamai Technologies, Inc. (AKAM) shows a moderate income growth over five years with a 24.8% revenue increase but a decline in net income and profitability metrics. Financial ratios are mixed, with favorable net margin and interest coverage but unfavorable ROIC and valuation multiples. Debt levels remain moderate, and the overall rating is very favorable, supported by a strong DCF score but moderate leverage concerns.
Veritone, Inc. (VERI) exhibits a favorable income trend with significant revenue and net income growth over five years despite negative profitability margins. Most financial ratios are unfavorable, including net margin, ROE, and debt ratios, reflecting financial distress. The company’s rating is very favorable due to a strong DCF score but offset by weak profitability and high leverage. Its Altman Z-Score indicates distress risk.
Considering the ratings and financial assessments, AKAM’s stable rating and neutral overall ratios might appeal more to investors prioritizing moderate risk and quality. In contrast, VERI’s favorable income growth but very unfavorable ratios and distress signals could be more suited to risk-tolerant investors seeking growth opportunities despite financial challenges.
Disclaimer: Investment carries a risk of loss of initial capital. The past performance is not a reliable indicator of future results. Be sure to understand risks before making an investment decision.
Go Further
I encourage you to read the complete analyses of Akamai Technologies, Inc. and Veritone, Inc. to enhance your investment decisions: