Home > Comparison > Technology > VRSN vs AKAM
The strategic rivalry between VeriSign, Inc. and Akamai Technologies, Inc. shapes the future of the software infrastructure sector. VeriSign operates as a capital-efficient domain name registry and internet infrastructure provider. Akamai offers high-scale cloud services focusing on cybersecurity, content delivery, and edge computing. This head-to-head highlights a contrast between foundational internet infrastructure and cloud-driven security solutions. This analysis will reveal which trajectory delivers superior risk-adjusted returns for a diversified portfolio.
Table of contents
Companies Overview
VeriSign and Akamai lead the software infrastructure market with distinct strategic roles and global reach.
VeriSign, Inc.: The Internet’s Domain Gatekeeper
VeriSign dominates as the domain name registry for key domains like .com and .net. Its core revenue derives from registration and authoritative resolution services, sustaining global e-commerce. In 2026, VeriSign focuses on maintaining internet security and stability by operating critical root zone servers and expanding its resilient internet infrastructure.
Akamai Technologies, Inc.: Cloud Security and Delivery Powerhouse
Akamai excels in cloud services that protect and accelerate internet content and applications worldwide. It generates revenue through cybersecurity, content delivery, and edge computing solutions. In the latest year, Akamai prioritizes enhancing cloud security and performance, empowering developers with edge compute while defending against cyber threats.
Strategic Collision: Similarities & Divergences
Both companies underpin internet functionality but diverge in scope: VeriSign secures internet navigation through a centralized domain registry, while Akamai offers a distributed cloud platform for content and security. Their primary battleground is internet infrastructure resilience versus cloud service agility. This contrast creates distinct investment profiles—VeriSign offers stability and monopoly-like control; Akamai delivers growth potential in cloud innovation.
Income Statement Comparison
This data dissects the core profitability and scalability of both corporate engines to reveal who dominates the bottom line:
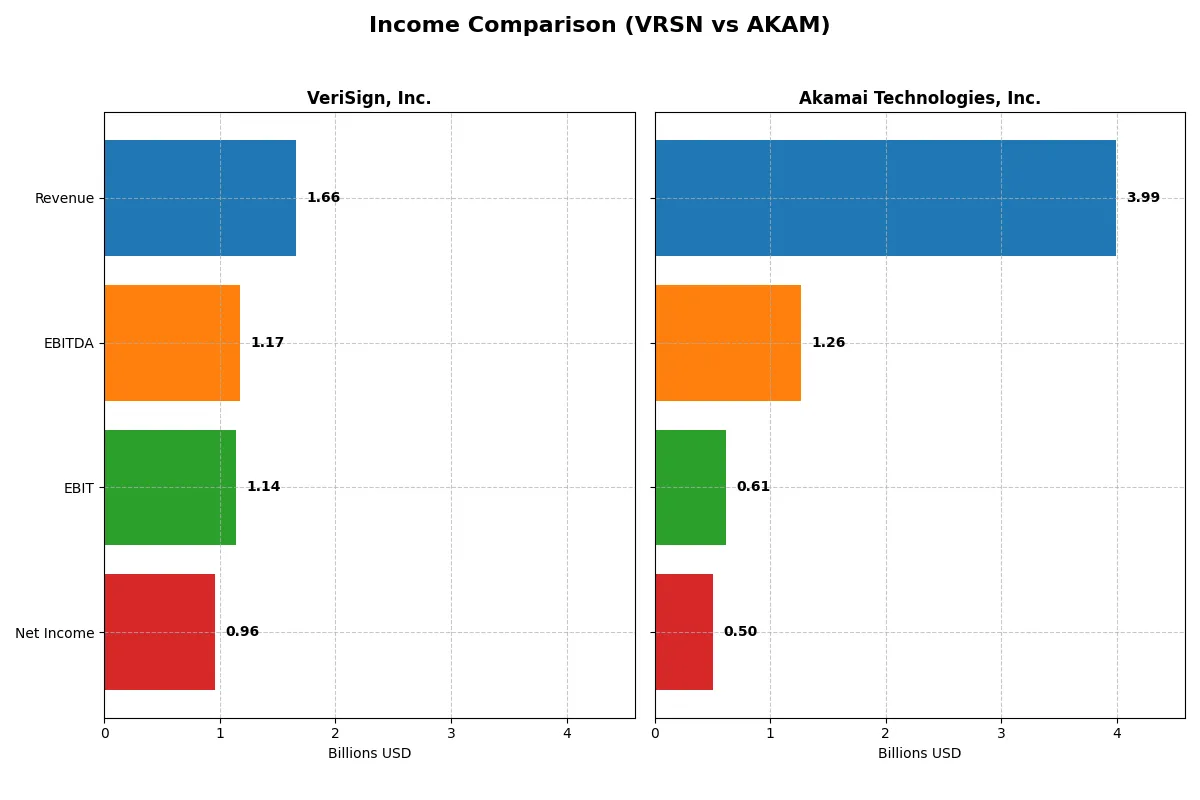
| Metric | VeriSign, Inc. (VRSN) | Akamai Technologies, Inc. (AKAM) |
|---|---|---|
| Revenue | 1.66B | 3.99B |
| Cost of Revenue | 196.3M | 1.62B |
| Operating Expenses | 339.3M | 1.84B |
| Gross Profit | 1.46B | 2.37B |
| EBITDA | 1.17B | 1.26B |
| EBIT | 1.14B | 614.1M |
| Interest Expense | 77.0M | 27.1M |
| Net Income | 955.5M | 504.9M |
| EPS | 8.83 | 3.34 |
| Fiscal Year | 2025 | 2024 |
Income Statement Analysis: The Bottom-Line Duel
This income statement comparison exposes the true efficiency and profitability of each company’s business engine through recent performance metrics.
VeriSign, Inc. Analysis
VeriSign’s revenue steadily climbs, reaching $1.66B in 2025, with net income surging to $955M. Its gross margin remains robust at 88%, and net margin impresses at 58%. The 2025 year showcases strong momentum, with favorable growth in earnings per share and net income, reflecting disciplined cost control and operational efficiency.
Akamai Technologies, Inc. Analysis
Akamai posts higher revenue at $3.99B in 2024 but delivers a slimmer net income of $505M. Its gross margin stands at 59%, and net margin at just 13%. Recent trends reveal margin compression and declining profitability, with net income and EPS showing negative growth, indicating challenges in scaling profits despite revenue gains.
Margin Strength vs. Top-Line Scale
VeriSign dominates in profitability and margin expansion, while Akamai leads in revenue scale but struggles with margin pressure and earnings decline. VeriSign’s higher efficiency and robust bottom-line growth make it the clearer fundamental winner. Investors seeking profit quality and margin resilience may find VeriSign’s profile more attractive.
Financial Ratios Comparison
These vital ratios act as a diagnostic tool to expose the underlying fiscal health, valuation premiums, and capital efficiency of the companies compared below:
| Ratios | VeriSign, Inc. (VRSN) | Akamai Technologies, Inc. (AKAM) |
|---|---|---|
| ROE | -0.65 | 0.10 |
| ROIC | -1.52 | 0.05 |
| P/E | 23.49 | 28.68 |
| P/B | -15.23 | 2.97 |
| Current Ratio | 0.49 | 1.23 |
| Quick Ratio | 0.49 | 1.23 |
| D/E (Debt-to-Equity) | -1.21 | 0.95 |
| Debt-to-Assets | 2.66 | 0.45 |
| Interest Coverage | 14.56 | 19.67 |
| Asset Turnover | 2.46 | 0.38 |
| Fixed Asset Turnover | 7.75 | 1.33 |
| Payout ratio | 0.23 | 0 |
| Dividend yield | 0.96% | 0% |
| Fiscal Year | 2025 | 2024 |
Efficiency & Valuation Duel: The Vital Signs
Financial ratios act as a company’s DNA, exposing hidden operational strengths and risks that shape investment decisions.
VeriSign, Inc.
VeriSign reveals a strong net margin at 58%, yet it suffers from negative ROE and ROIC, signaling profitability challenges. The P/E ratio at 23.5 appears fairly priced, reflecting neutral valuation. A modest dividend yield of 0.96% offers some shareholder return, while ongoing R&D investments suggest a growth focus despite operational headwinds.
Akamai Technologies, Inc.
Akamai posts a modest 12.7% net margin and positive ROE near 10%, indicating moderate profitability. However, its elevated P/E of 28.7 marks the stock as expensive relative to earnings. The company pays no dividend, opting instead to reinvest heavily in R&D, underlining a growth-oriented capital allocation strategy amid mixed efficiency metrics.
Premium Valuation vs. Operational Safety
VeriSign shows operational strength in margins but struggles with returns on equity and capital, balanced by a reasonable valuation and dividend. Akamai trades at a higher premium with steadier returns but lacks income distribution. VeriSign fits investors seeking income with caution; Akamai suits those prioritizing growth despite valuation risk.
Which one offers the Superior Shareholder Reward?
VeriSign pays a modest 0.96% dividend yield with a conservative 22.5% payout ratio, supported by strong free cash flow of 11.56/share. It pairs dividends with steady buybacks, ensuring shareholder returns without compromising growth. Akamai, by contrast, pays no dividends and invests heavily in R&D and acquisitions, with a slimmer free cash flow of 5.5/share and no buybacks. VeriSign’s disciplined distribution model offers a more sustainable and attractive total return profile in 2026.
Comparative Score Analysis: The Strategic Profile
The radar chart reveals the fundamental DNA and trade-offs of VeriSign, Inc. and Akamai Technologies, Inc., highlighting their financial strengths and vulnerabilities:
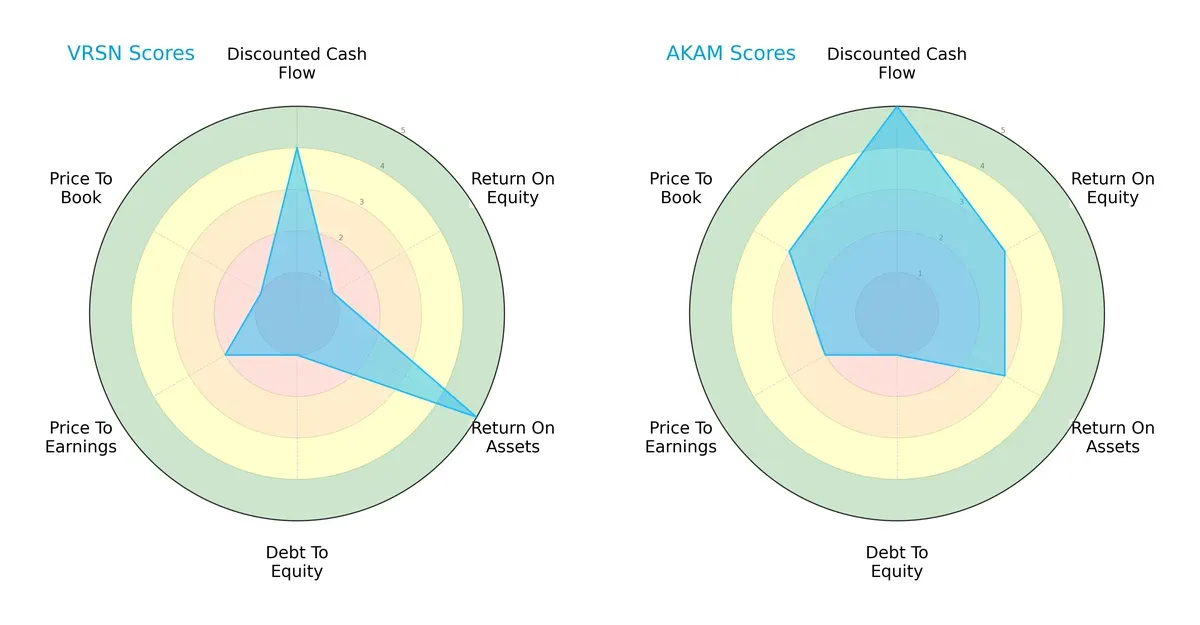
VeriSign shines in return on assets (score 5) and discounted cash flow (4), but struggles with return on equity (1) and leverage (debt-to-equity 1). Akamai offers a more balanced profile with moderate scores in ROE (3), ROA (3), and DCF (5). However, both firms share a weak debt-to-equity score (1), signaling elevated financial risk. Akamai’s stronger price-to-book score (3) suggests better valuation metrics, contrasting VeriSign’s very unfavorable valuation scores.
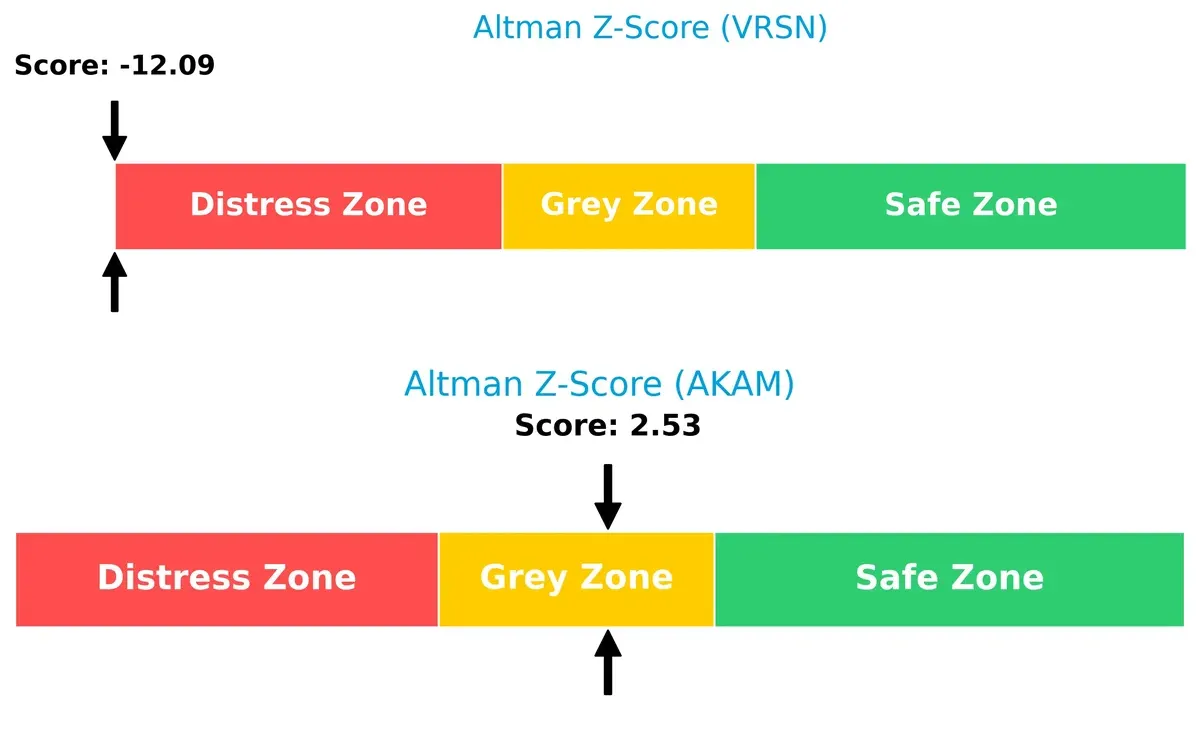
Bankruptcy Risk: Solvency Showdown
VeriSign’s Altman Z-Score at -12.1 signals severe financial distress, implying high bankruptcy risk in this cycle. Akamai’s 2.53 places it in the grey zone, indicating moderate survival prospects:
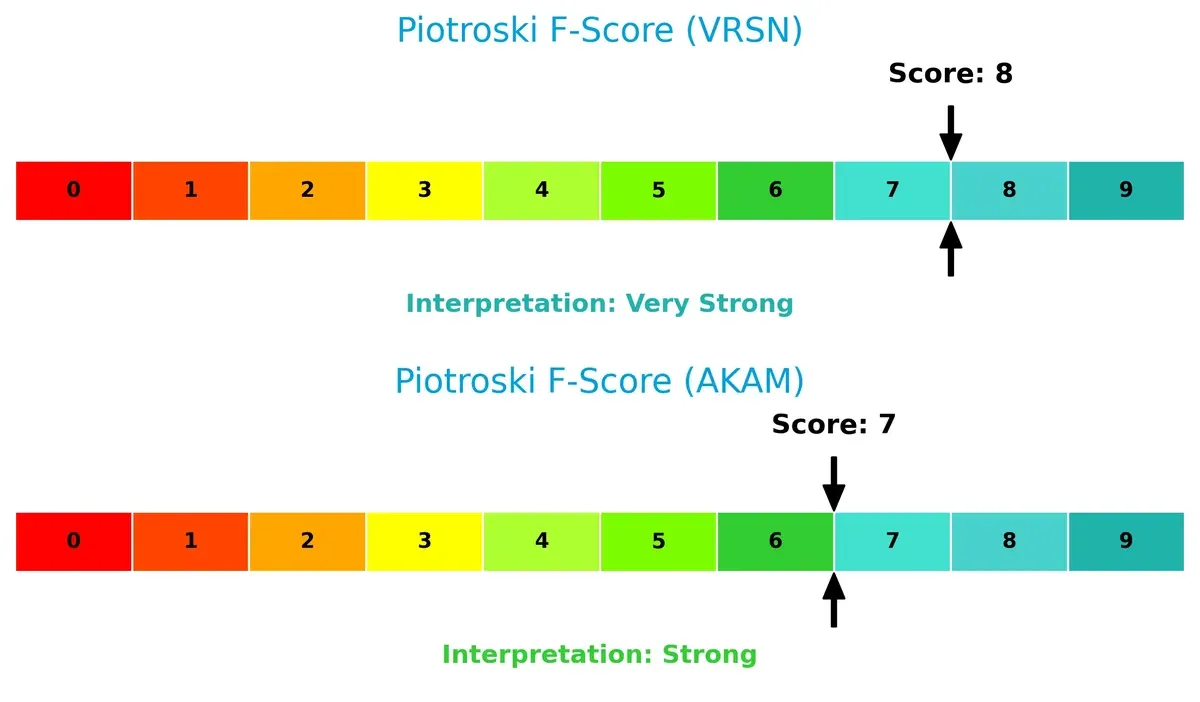
Financial Health: Quality of Operations
VeriSign’s Piotroski F-Score of 8 shows very strong financial health, outperforming Akamai’s strong 7. Despite VeriSign’s distress signal, operational metrics remain robust, suggesting underlying quality:
How are the two companies positioned?
This section dissects the operational DNA of VeriSign and Akamai by comparing their revenue distribution and internal dynamics. The objective is to confront their economic moats to identify which model offers a more resilient, sustainable competitive advantage today.
Strengths and Weaknesses Comparison
This table compares the Strengths and Weaknesses of VeriSign and Akamai Technologies:
VeriSign Strengths
- Very high net margin at 57.68%
- Favorable WACC at 7.02% below industry average
- Strong asset and fixed asset turnover ratios
- High interest coverage ratio at 14.81
- Significant global revenue diversification across US, EMEA, Asia Pacific
Akamai Strengths
- Positive net margin of 12.65%
- Favorable WACC at 6.23%
- Good interest coverage ratio at 22.65
- Healthy quick ratio at 1.23 indicates liquidity
- Balanced geographic revenue split between US and Non-US markets
VeriSign Weaknesses
- Negative ROE and ROIC indicating poor capital returns
- Low current and quick ratios at 0.49 signaling liquidity risks
- Excessive debt-to-assets ratio at 265.55%, a red flag
- Negative PB ratio suggests market valuation concerns
- Low dividend yield at 0.96%
Akamai Weaknesses
- ROIC below WACC at 4.74%, indicating value destruction
- Elevated P/E ratio at 28.68, possibly overvalued
- Asset turnover at 0.38 is low, showing inefficiency
- No dividend yield reduces income appeal
- Neutral to unfavorable debt ratios limit financial flexibility
VeriSign shows strong profitability and operational efficiency but faces serious financial structure and liquidity concerns. Akamai maintains steadier financial health and liquidity but struggles with capital efficiency and valuation. Both must balance growth with prudent capital allocation and risk management.
The Moat Duel: Analyzing Competitive Defensibility
A structural moat is the only shield protecting long-term profits from relentless competition and market disruption. Here’s how VeriSign and Akamai defend their turf:
VeriSign, Inc.: Domain Registry Dominance
VeriSign’s moat stems from intangible assets—its control over critical domain registries like .com and .net. This translates into high gross margins (88%) and stable net margins (58%), but declining ROIC signals weakening capital efficiency. In 2026, new internet infrastructure trends could pressure this position.
Akamai Technologies, Inc.: Cloud Security and Edge Computing
Akamai’s moat relies on cost advantage and network effects in cloud content delivery and cybersecurity. Its lower margins (59% gross, 13% net) reflect reinvestment intensity. ROIC also declines, but expanding edge compute services may create fresh competitive barriers.
Registry Control vs. Cloud Edge: Moat Resilience in Question
Both companies suffer declining ROIC and value destruction, signaling eroding moats. VeriSign’s intangible asset moat is historically deeper, but Akamai’s diversification into edge computing offers a dynamic growth path. VeriSign remains better positioned to defend its core domain registry market share.
Which stock offers better returns?
Over the past 12 months, VeriSign’s shares gained 17.83% with a decelerating bullish trend, while Akamai’s stock declined 11.35% despite accelerating bearish momentum.
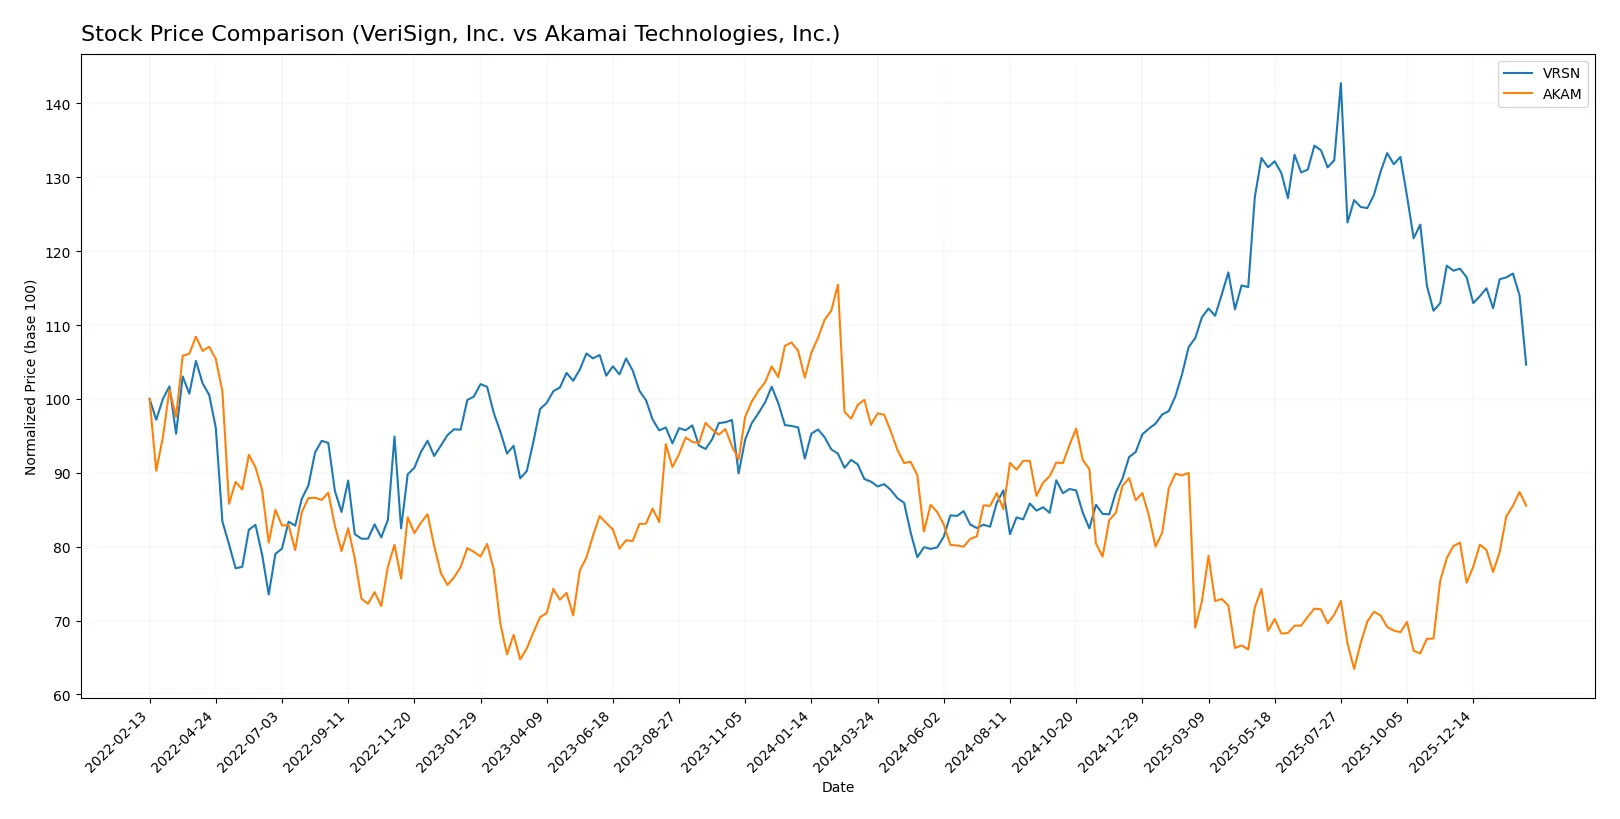
Trend Comparison
VeriSign’s 12-month trend shows a 17.83% price increase, marking a bullish stance with deceleration. Its volatility is high at 40.67, with a peak at 305.79 and a trough of 168.32.
Akamai’s stock fell 11.35% over the same period, confirming a bearish trend that accelerates. Volatility is moderate at 10.38, with a high of 108.97 and a low of 70.53.
VeriSign outperformed Akamai with a strong positive return versus Akamai’s decline, delivering superior market performance over the past year.
Target Prices
Analysts set clear upside targets for VeriSign and Akamai, signaling confidence in both names.
| Company | Target Low | Target High | Consensus |
|---|---|---|---|
| VeriSign, Inc. | 325 | 325 | 325 |
| Akamai Technologies, Inc. | 89 | 115 | 107.8 |
VeriSign’s target price sits 45% above its current 224 price, indicating strong growth expectations. Akamai’s consensus target implies a 13% upside from its 95 current price, reflecting moderate optimism.
How do institutions grade them?
The following grades from reputable institutions provide insight into each company’s market standing:
VeriSign, Inc. Grades
This table summarizes recent grades assigned to VeriSign by respected financial institutions.
| Grading Company | Action | New Grade | Date |
|---|---|---|---|
| JP Morgan | Maintain | Neutral | 2026-01-06 |
| Baird | Maintain | Outperform | 2025-07-01 |
| Baird | Maintain | Outperform | 2025-04-25 |
| Baird | Maintain | Outperform | 2025-04-01 |
| Citigroup | Maintain | Buy | 2025-02-04 |
| Citigroup | Maintain | Buy | 2025-01-03 |
| Baird | Upgrade | Outperform | 2024-12-09 |
| Baird | Maintain | Neutral | 2024-06-27 |
| Baird | Maintain | Neutral | 2024-04-26 |
| Citigroup | Maintain | Buy | 2024-04-02 |
Akamai Technologies, Inc. Grades
The following grades reflect Akamai’s current analyst evaluations from leading firms.
| Grading Company | Action | New Grade | Date |
|---|---|---|---|
| Citigroup | Maintain | Neutral | 2026-01-16 |
| Morgan Stanley | Upgrade | Overweight | 2026-01-12 |
| Scotiabank | Maintain | Sector Outperform | 2026-01-09 |
| RBC Capital | Maintain | Sector Perform | 2026-01-05 |
| Piper Sandler | Maintain | Neutral | 2026-01-05 |
| Keybanc | Upgrade | Overweight | 2025-12-15 |
| TD Cowen | Maintain | Hold | 2025-11-13 |
| Citigroup | Maintain | Neutral | 2025-11-11 |
| Scotiabank | Maintain | Sector Outperform | 2025-11-07 |
| Piper Sandler | Maintain | Neutral | 2025-11-07 |
Which company has the best grades?
Akamai has seen recent upgrades to Overweight and Sector Outperform, suggesting growing analyst confidence. VeriSign consistently earns Outperform and Buy ratings but with more Neutral grades recently. Akamai’s stronger upgrades may attract investors seeking positive momentum signals.

Don’t Let Luck Decide Your Entry Point
Optimize your entry points with our advanced ProRealTime indicators. You’ll get efficient buy signals with precise price targets for maximum performance. Start outperforming now!
Risks specific to each company
The following categories highlight critical pressure points and systemic threats facing VeriSign, Inc. and Akamai Technologies, Inc. in the 2026 market environment:
1. Market & Competition
VeriSign, Inc.
- Dominates niche domain registry with strong .com/.net control but faces limited growth scope.
Akamai Technologies, Inc.
- Competes in crowded cloud security and CDN markets with innovation pressure and margin constraints.
2. Capital Structure & Debt
VeriSign, Inc.
- High debt-to-assets ratio (265.55%) signals aggressive leverage and balance sheet risk.
Akamai Technologies, Inc.
- Moderate debt levels with 44.7% debt-to-assets, maintaining manageable financial risk.
3. Stock Volatility
VeriSign, Inc.
- Beta 0.75 indicates moderate stock volatility, somewhat insulated from market swings.
Akamai Technologies, Inc.
- Beta 0.72 also shows moderate volatility, reflecting stable investor sentiment.
4. Regulatory & Legal
VeriSign, Inc.
- Operates critical internet infrastructure, subject to stringent regulations and cybersecurity scrutiny.
Akamai Technologies, Inc.
- Faces evolving cybersecurity regulations and privacy laws impacting product compliance.
5. Supply Chain & Operations
VeriSign, Inc.
- Relies on robust, distributed network infrastructure with limited physical supply chain risks.
Akamai Technologies, Inc.
- Complex global operations depend on diverse suppliers and data centers, vulnerable to disruptions.
6. ESG & Climate Transition
VeriSign, Inc.
- Limited public ESG footprint; climate transition risks are indirect through data center energy use.
Akamai Technologies, Inc.
- Increasing ESG focus with initiatives to reduce energy intensity and carbon footprint in data centers.
7. Geopolitical Exposure
VeriSign, Inc.
- Primarily US-based but critical internet infrastructure role exposes it to geopolitical tensions.
Akamai Technologies, Inc.
- Global footprint with significant international revenues exposes it to geopolitical and trade risks.
Which company shows a better risk-adjusted profile?
VeriSign’s largest risk is its highly leveraged capital structure, which threatens financial stability despite operational dominance. Akamai’s key risk is intense market competition limiting margin expansion. Akamai’s moderate leverage and stronger Altman Z-Score (2.53, grey zone) reflect a better risk-adjusted profile than VeriSign’s distress zone (-12.08). VeriSign’s aggressive debt and weak ROE spotlight urgent balance sheet concerns.
Final Verdict: Which stock to choose?
VeriSign, Inc. wields unmatched efficiency in its niche, generating robust cash flows despite a challenging balance sheet. Its low liquidity ratio is a point of vigilance, signaling potential short-term constraints. This stock suits portfolios seeking aggressive growth fueled by operational strength and market dominance.
Akamai Technologies, Inc. boasts a strategic moat anchored in cloud service reliability and recurring revenues. It offers a comparatively safer financial profile with better liquidity and moderate leverage. Akamai fits growth-at-a-reasonable-price (GARP) portfolios valuing steadier cash flow and risk management.
If you prioritize aggressive growth and operational cash generation, VeriSign is the compelling choice due to its dominant market position and strong cash flow despite balance sheet risks. However, if you seek better stability with a strategic moat in cloud infrastructure, Akamai offers superior financial resilience and a more balanced risk profile.
Disclaimer: Investment carries a risk of loss of initial capital. The past performance is not a reliable indicator of future results. Be sure to understand risks before making an investment decision.
Go Further
I encourage you to read the complete analyses of VeriSign, Inc. and Akamai Technologies, Inc. to enhance your investment decisions: