In the fast-evolving technology sector, Akamai Technologies, Inc. and UiPath Inc. stand out as leaders in software infrastructure, each pushing innovation in cloud security and automation. Akamai specializes in content delivery and cybersecurity, while UiPath pioneers robotic process automation with AI integration. Their market overlap and growth potential make them compelling investment candidates. Join me as we explore which company offers the most promising opportunity for your portfolio in 2026.
Table of contents
Companies Overview
I will begin the comparison between Akamai Technologies and UiPath by providing an overview of these two companies and their main differences.
Akamai Technologies Overview
Akamai Technologies, Inc. specializes in cloud services aimed at securing, delivering, and optimizing content and business applications over the internet globally. Founded in 1998 and headquartered in Cambridge, Massachusetts, Akamai offers solutions in cybersecurity, web and mobile performance, media delivery, and edge computing. The company serves a broad range of industries by enhancing infrastructure security and application performance, supported by direct sales and channel partners.
UiPath Overview
UiPath Inc. provides an end-to-end robotic process automation (RPA) platform that integrates artificial intelligence to automate business processes across various sectors including banking, healthcare, and government. Established in 2005 and based in New York City, UiPath offers software tools for automation design, deployment, management, and compliance. Its platform enables users to build attended and unattended automations with minimal coding, supported by professional services like training and implementation.
Key similarities and differences
Both Akamai and UiPath operate within the software infrastructure industry, focusing on technology solutions that improve enterprise efficiency and security. Akamai emphasizes cloud-based content delivery and cybersecurity services, whereas UiPath centers on automation through RPA and AI-driven process management. While Akamai has a larger workforce and market cap, UiPath targets automation with a specialized software suite, reflecting differing approaches to enhancing business operations and technological integration.
Income Statement Comparison
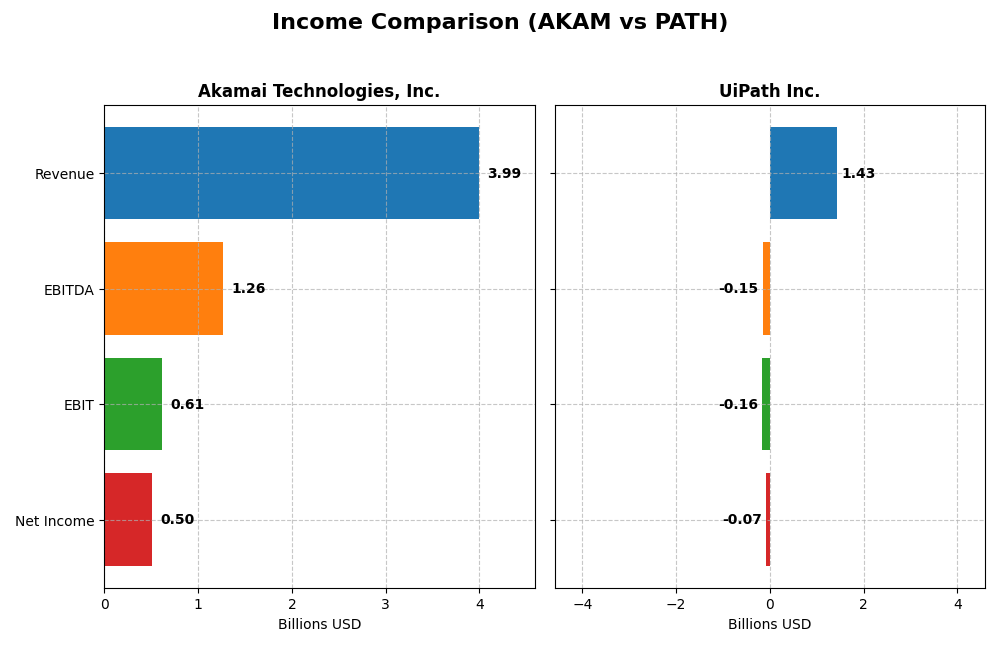
Below is a side-by-side comparison of key income statement metrics for Akamai Technologies, Inc. and UiPath Inc. for their most recent fiscal years.
| Metric | Akamai Technologies, Inc. | UiPath Inc. |
|---|---|---|
| Market Cap | 13.4B | 7.7B |
| Revenue | 3.99B | 1.43B |
| EBITDA | 1.26B | -145M |
| EBIT | 614M | -163M |
| Net Income | 505M | -74M |
| EPS | 3.34 | -0.13 |
| Fiscal Year | 2024 | 2025 |
Income Statement Interpretations
Akamai Technologies, Inc.
Akamai’s revenue showed steady growth from 3.2B in 2020 to nearly 4B in 2024, a 24.8% increase over five years. However, net income declined by 9.36% over the same period, with net margin shrinking by 27.37%. In 2024, revenue growth slowed to 4.7%, while net income fell 8.0%, reflecting pressure on profit margins despite a stable gross margin near 59%.
UiPath Inc.
UiPath’s revenue rose rapidly from 608M in 2021 to 1.43B in 2025, a 135.3% increase, with net income shifting from negative to a less severe loss of -74M in 2025. Gross margin remained strong above 82%, but the company still posted negative EBIT and net margins. Recent growth in revenue (9.3%) and EPS (18.75%) indicate improving operational leverage and margin expansion.
Which one has the stronger fundamentals?
UiPath presents stronger fundamentals in terms of revenue and net income growth, with favorable margin improvements and a positive trajectory in EPS. Akamai shows more stable profitability but faces declining net income and margins, signaling challenges in sustaining profit growth. UiPath’s rapid expansion contrasts with Akamai’s mature but pressured income statement.
Financial Ratios Comparison
The table below compares key financial ratios for Akamai Technologies, Inc. and UiPath Inc. based on their most recent fiscal year data, providing a snapshot of profitability, liquidity, leverage, and operational efficiency.
| Ratios | Akamai Technologies, Inc. (2024) | UiPath Inc. (2025) |
|---|---|---|
| ROE | 10.35% | -3.99% |
| ROIC | 4.74% | -7.41% |
| P/E | 28.68 | -108.04 |
| P/B | 2.97 | 4.31 |
| Current Ratio | 1.23 | 2.93 |
| Quick Ratio | 1.23 | 2.93 |
| D/E (Debt-to-Equity) | 0.95 | 0.04 |
| Debt-to-Assets | 44.70% | 2.72% |
| Interest Coverage | 19.67 | 0 |
| Asset Turnover | 0.38 | 0.50 |
| Fixed Asset Turnover | 1.33 | 14.41 |
| Payout Ratio | 0 | 0 |
| Dividend Yield | 0 | 0 |
Interpretation of the Ratios
Akamai Technologies, Inc.
Akamai shows a mixed ratio profile with favorable net margin (12.65%) and interest coverage (22.65), but an unfavorable ROIC (4.74%) and asset turnover (0.38). The price-to-earnings ratio is high at 28.68, suggesting valuation concerns. Akamai does not pay dividends, likely focusing on reinvestment and growth, with no reported payouts or buybacks.
UiPath Inc.
UiPath’s ratios reflect challenges with negative net margin (-5.15%), ROE (-3.99%), and ROIC (-7.41%), indicating weak profitability and returns. It has strong liquidity (current ratio 2.93) and low leverage (debt-to-equity 0.04). UiPath also does not pay dividends, consistent with its negative earnings and prioritization of growth and R&D investments.
Which one has the best ratios?
Akamai presents a more balanced financial profile, with several favorable ratios and moderate risks, while UiPath faces multiple unfavorable profitability metrics despite solid liquidity. Overall, Akamai’s ratio evaluation is neutral, whereas UiPath’s is slightly unfavorable, reflecting higher financial challenges.
Strategic Positioning
This section compares the strategic positioning of Akamai Technologies and UiPath Inc., focusing on market position, key segments, and exposure to technological disruption:
Akamai Technologies, Inc.
- Established player in cloud services with global footprint and moderate competitive pressure.
- Primarily serves cloud security, content delivery, media streaming, and edge computing segments.
- Operates in cloud infrastructure with steady innovation but exposed to evolving cyber threats.
UiPath Inc.
- Emerging automation platform provider facing higher competitive intensity and market volatility.
- Focuses on robotic process automation with licenses, subscription services, and professional services.
- Positioned in AI-driven automation, leveraging AI integration and low-code environments for disruption.
Akamai Technologies vs UiPath Inc. Positioning
Akamai has a diversified cloud services portfolio focused on security and performance, while UiPath concentrates on automation software. Akamai benefits from scale and varied offerings; UiPath’s narrower focus targets growing RPA markets but with higher market risk.
Which has the best competitive advantage?
Both companies currently shed value relative to their cost of capital. Akamai shows declining profitability with a very unfavorable moat, whereas UiPath’s profitability is improving despite value destruction, indicating a slightly unfavorable moat position.
Stock Comparison
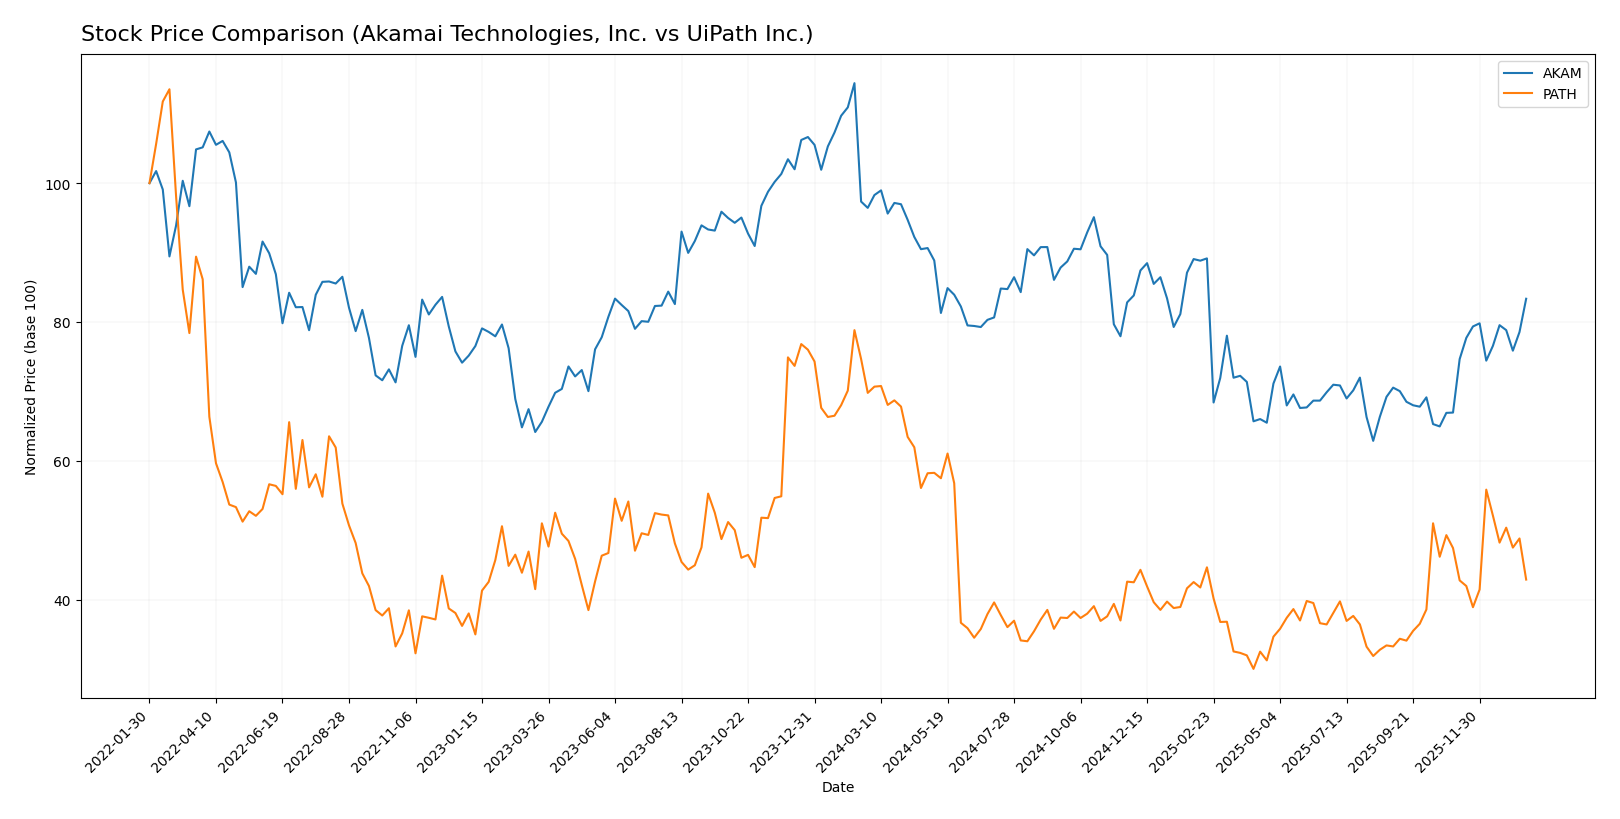
The stock price chart over the past year highlights a bearish trend for both Akamai Technologies, Inc. and UiPath Inc., with Akamai showing recent acceleration in positive momentum, contrasting UiPath’s continued downward trajectory.
Trend Analysis
Akamai Technologies, Inc. experienced a bearish trend over the past 12 months with a -13.57% price change, showing acceleration despite significant volatility (std. dev. 10.92). The stock’s price ranged from $70.53 to $111.0, with a recent rebound of +24.49%.
UiPath Inc. also faced a bearish trend over the same period with a -38.53% price change and moderate volatility (std. dev. 3.33). The price fluctuated between $10.04 and $23.66, with a recent further decline of -9.58%.
Comparing the two, Akamai delivered the highest market performance over the past year, showing less severe losses and a recent positive price momentum unlike UiPath’s persistent decline.
Target Prices
The current analyst consensus for target prices suggests moderate upside potential for both Akamai Technologies, Inc. and UiPath Inc.
| Company | Target High | Target Low | Consensus |
|---|---|---|---|
| Akamai Technologies, Inc. | 115 | 89 | 104.8 |
| UiPath Inc. | 19 | 14 | 16.6 |
Analysts expect Akamai’s price to rise from $93.49 to around $104.8 on average, indicating moderate growth potential. UiPath’s consensus target is $16.6, slightly above its current $14.34 price, suggesting cautious optimism.
Analyst Opinions Comparison
This section compares analysts’ ratings and grades for Akamai Technologies, Inc. and UiPath Inc.:
Rating Comparison
AKAM Rating
- Rating: B, considered very favorable by analysts.
- Discounted Cash Flow Score: 5, indicating a very favorable valuation based on future cash flows.
- ROE Score: 3, showing moderate efficiency in generating profit from shareholders’ equity.
- ROA Score: 3, moderate effectiveness in utilizing assets to generate earnings.
- Debt To Equity Score: 1, very unfavorable due to higher financial risk.
- Overall Score: 3, reflecting a moderate overall financial standing.
PATH Rating
- Rating: B+, also regarded as very favorable by analysts.
- Discounted Cash Flow Score: 3, reflecting a moderate valuation assessment.
- ROE Score: 4, indicating favorable efficiency in profit generation from equity.
- ROA Score: 4, favorable effectiveness in asset utilization for earnings.
- Debt To Equity Score: 4, favorable financial stability with lower reliance on debt.
- Overall Score: 3, also indicating a moderate overall financial standing.
Which one is the best rated?
UiPath Inc. holds a better rating overall with a B+ compared to Akamai’s B. PATH shows stronger scores in ROE, ROA, and debt-to-equity, while AKAM leads in discounted cash flow score. Both share a moderate overall score.
Scores Comparison
Here is a comparison of the Altman Z-Score and Piotroski Score for Akamai Technologies and UiPath Inc.:
Akamai Scores
- Altman Z-Score: 2.46, indicating moderate bankruptcy risk in the grey zone.
- Piotroski Score: 7, indicating strong financial health.
UiPath Scores
- Altman Z-Score: 5.27, indicating low bankruptcy risk in the safe zone.
- Piotroski Score: 7, indicating strong financial health.
Which company has the best scores?
UiPath has a better Altman Z-Score, placing it in the safe zone, while both have equal strong Piotroski Scores. UiPath shows a lower bankruptcy risk based on these scores.
Grades Comparison
Here is the comparison of recent stock grades for Akamai Technologies, Inc. and UiPath Inc.:
Akamai Technologies, Inc. Grades
The following table summarizes recent grades from reputable financial institutions for Akamai Technologies, Inc.:
| Grading Company | Action | New Grade | Date |
|---|---|---|---|
| Citigroup | Maintain | Neutral | 2026-01-16 |
| Morgan Stanley | Upgrade | Overweight | 2026-01-12 |
| Scotiabank | Maintain | Sector Outperform | 2026-01-09 |
| RBC Capital | Maintain | Sector Perform | 2026-01-05 |
| Piper Sandler | Maintain | Neutral | 2026-01-05 |
| Keybanc | Upgrade | Overweight | 2025-12-15 |
| TD Cowen | Maintain | Hold | 2025-11-13 |
| Citigroup | Maintain | Neutral | 2025-11-11 |
| Scotiabank | Maintain | Sector Outperform | 2025-11-07 |
| Piper Sandler | Maintain | Neutral | 2025-11-07 |
Overall, Akamai shows a balance of neutral to positive grades, including upgrades to overweight from notable firms, indicating cautious optimism.
UiPath Inc. Grades
The following table presents recent grades from recognized financial firms for UiPath Inc.:
| Grading Company | Action | New Grade | Date |
|---|---|---|---|
| Barclays | Maintain | Equal Weight | 2026-01-12 |
| RBC Capital | Maintain | Sector Perform | 2026-01-05 |
| RBC Capital | Maintain | Sector Perform | 2025-12-10 |
| Morgan Stanley | Maintain | Equal Weight | 2025-12-09 |
| DA Davidson | Maintain | Neutral | 2025-12-05 |
| Canaccord Genuity | Maintain | Buy | 2025-12-04 |
| Mizuho | Maintain | Neutral | 2025-12-04 |
| RBC Capital | Maintain | Sector Perform | 2025-12-04 |
| Wells Fargo | Maintain | Equal Weight | 2025-12-04 |
| Evercore ISI Group | Maintain | In Line | 2025-12-04 |
The consensus for UiPath remains mostly neutral to equal weight with some buy ratings, reflecting a steady but cautious stance.
Which company has the best grades?
Akamai Technologies has received more positive upgrades, including overweight ratings from Morgan Stanley and Keybanc, compared to UiPath’s predominantly neutral and equal weight grades. This suggests Akamai may be viewed more favorably by analysts, potentially influencing investor confidence and portfolio positioning.
Strengths and Weaknesses
Below is a comparison of key strengths and weaknesses for Akamai Technologies, Inc. (AKAM) and UiPath Inc. (PATH) based on their recent financial and strategic data:
| Criterion | Akamai Technologies, Inc. (AKAM) | UiPath Inc. (PATH) |
|---|---|---|
| Diversification | Moderate; primarily focused on content delivery and cloud security services, generating $3.99B in 2024 revenue | More diversified product segmentation with licenses, professional services, and subscription services totaling ~$1.46B in 2025 |
| Profitability | Positive net margin (12.65%), but ROIC (4.74%) below WACC (6.14%), indicating value destruction | Negative net margin (-5.15%) and ROIC (-7.41%), but showing improving profitability trend |
| Innovation | Stable innovation in cybersecurity and cloud acceleration, but declining ROIC trend signals challenges | Strong innovation evidenced by a 65% ROIC growth trend, despite current losses |
| Global presence | Established global footprint with a strong customer base in enterprise and media sectors | Growing global presence supported by subscription-based model and expanding service offerings |
| Market Share | Solid market position in content delivery networks but facing competitive pressures | Emerging player in robotic process automation with increasing market penetration |
Key takeaways: Akamai shows stable profitability but struggles with declining capital efficiency, signaling caution. UiPath is less profitable currently but demonstrates strong growth potential and improving returns, making it a more speculative yet promising choice. Risk management suggests careful monitoring of both companies’ evolving financial health before investment.
Risk Analysis
Below is a comparison of key risks for Akamai Technologies, Inc. (AKAM) and UiPath Inc. (PATH) based on the most recent data available in 2026.
| Metric | Akamai Technologies, Inc. (AKAM) | UiPath Inc. (PATH) |
|---|---|---|
| Market Risk | Moderate (Beta 0.685) – less volatile than market | Higher (Beta 1.079) – more sensitive to market swings |
| Debt level | Moderate (Debt-to-Equity ~0.95) | Low (Debt-to-Equity ~0.04) |
| Regulatory Risk | Moderate – operates globally, subject to cybersecurity laws | Moderate – operates in automation software, compliance evolving |
| Operational Risk | Moderate – complex cloud infrastructure, cybersecurity threats | Moderate to high – reliance on AI and automation platform stability |
| Environmental Risk | Low – primarily digital services | Low – primarily digital services |
| Geopolitical Risk | Moderate – international operations exposed to global tensions | Moderate – presence in US, Romania, Japan; geopolitical shifts can impact |
Akamai’s main risk is moderate market exposure and operational challenges inherent in cybersecurity infrastructure. UiPath faces higher market volatility and operational risks tied to AI platform deployment but benefits from low debt. Geopolitical and regulatory risks affect both, with UiPath more exposed due to its global footprint and emerging tech sector dynamics.
Which Stock to Choose?
Akamai Technologies, Inc. (AKAM) shows modest revenue growth of 4.7% in 2024 with a neutral to favorable income ratio profile, including a 12.65% net margin and a balanced debt ratio. However, its overall income and ROIC trends are unfavorable, and it carries a moderate financial rating B with some risk signs in debt-to-equity.
UiPath Inc. (PATH) demonstrates strong revenue and net income growth over recent years, with a favorable income statement and improving profitability metrics despite negative net margins. It maintains a low debt burden and a very favorable rating B+ but faces challenges from negative ROIC compared to WACC, though this is improving.
For investors prioritizing stable cash flow and moderate financial risk, AKAM’s solid rating and income quality might appear preferable. Conversely, those with a tolerance for risk and seeking growth potential could find PATH’s accelerating profitability and stronger balance sheet more appealing, despite its current value destruction status.
Disclaimer: Investment carries a risk of loss of initial capital. The past performance is not a reliable indicator of future results. Be sure to understand risks before making an investment decision.
Go Further
I encourage you to read the complete analyses of Akamai Technologies, Inc. and UiPath Inc. to enhance your investment decisions: