Investors seeking exposure in the software infrastructure sector often consider Synopsys, Inc. (SNPS) and Akamai Technologies, Inc. (AKAM) due to their significant roles in technology innovation. Synopsys specializes in electronic design automation and semiconductor IP, while Akamai excels in cloud security and content delivery services. Both companies serve overlapping markets focused on advanced digital solutions, making this comparison vital. Let’s explore which company presents the most compelling investment opportunity for your portfolio.
Table of contents
Companies Overview
I will begin the comparison between Synopsys, Inc. and Akamai Technologies, Inc. by providing an overview of these two companies and their main differences.
Synopsys Overview
Synopsys, Inc. specializes in electronic design automation software, offering products that support the design and testing of integrated circuits. Its portfolio includes digital design implementation, verification tools, FPGA design products, and intellectual property solutions for various applications. With a market cap near 99B USD and 20K employees, Synopsys serves diverse sectors like electronics, automotive, and medicine from its headquarters in Mountain View, California.
Akamai Overview
Akamai Technologies, Inc. provides cloud-based services focused on securing, delivering, and optimizing internet content and business applications globally. Its offerings include cybersecurity, web and mobile performance solutions, media delivery, and edge computing. Headquartered in Cambridge, Massachusetts, Akamai has about 11K employees and a market cap of roughly 13.4B USD, serving clients through direct sales and channel partners.
Key similarities and differences
Both Synopsys and Akamai operate in the software infrastructure industry, emphasizing technology solutions that enhance digital processes. Synopsys centers on electronic design automation and IP solutions for hardware design, while Akamai focuses on cloud security, content delivery, and edge computing services. Their business models differ by target market and product scope, although both invest heavily in innovation to support digital transformation.
Income Statement Comparison
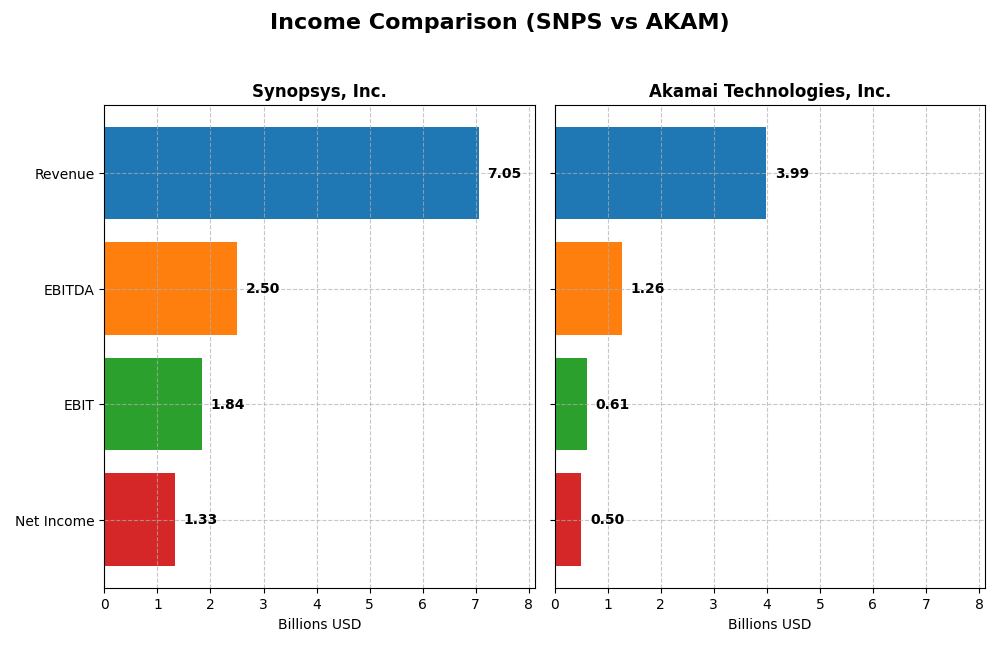
The table below presents the most recent fiscal year income statement figures for Synopsys, Inc. and Akamai Technologies, Inc., enabling a clear comparison of their financial performance.
| Metric | Synopsys, Inc. (SNPS) | Akamai Technologies, Inc. (AKAM) |
|---|---|---|
| Market Cap | 98.8B | 13.4B |
| Revenue | 7.05B | 3.99B |
| EBITDA | 2.50B | 1.26B |
| EBIT | 1.84B | 614M |
| Net Income | 1.33B | 505M |
| EPS | 8.13 | 3.34 |
| Fiscal Year | 2025 | 2024 |
Income Statement Interpretations
Synopsys, Inc.
Synopsys showed strong revenue and net income growth from 2021 to 2025, with revenue rising from $4.2B to $7.1B and net income increasing by 75.9% overall. Margins remained favorable, with a gross margin near 77% and an EBIT margin above 26%. In 2025, revenue growth accelerated 15.1%, but net margin and EPS declined significantly, reflecting margin pressure despite higher sales.
Akamai Technologies, Inc.
Akamai’s revenue grew steadily by 24.8% over 2020-2024, reaching $4.0B in 2024, but net income declined by 9.4% during that time. Margins stayed favorable but lower than Synopsys, with a 59.4% gross margin and a 15.4% EBIT margin. In 2024, revenue growth slowed to 4.7%, while net margin, EBIT, and EPS all decreased, indicating profitability challenges despite top-line gains.
Which one has the stronger fundamentals?
Synopsys demonstrates stronger fundamentals with robust overall growth in revenue and net income alongside high and stable margins, despite recent margin headwinds. Akamai, while maintaining positive revenue momentum, faces declining net income and margin contraction, weakening its profitability profile. Synopsys’s higher margin levels and more favorable growth trends give it a stronger financial position relative to Akamai.
Financial Ratios Comparison
The table below compares key financial ratios for Synopsys, Inc. (SNPS) and Akamai Technologies, Inc. (AKAM) based on their most recent fiscal year data.
| Ratios | Synopsys, Inc. (2025) | Akamai Technologies, Inc. (2024) |
|---|---|---|
| ROE | 4.72% | 10.35% |
| ROIC | 1.97% | 4.74% |
| P/E | 54.36 | 28.68 |
| P/B | 2.57 | 2.97 |
| Current Ratio | 1.62 | 1.23 |
| Quick Ratio | 1.52 | 1.23 |
| D/E (Debt-to-Equity) | 0.50 | 0.95 |
| Debt-to-Assets | 29.64% | 44.70% |
| Interest Coverage | 2.05 | 19.67 |
| Asset Turnover | 0.15 | 0.38 |
| Fixed Asset Turnover | 5.04 | 1.33 |
| Payout Ratio | 0 | 0 |
| Dividend Yield | 0 | 0 |
Interpretation of the Ratios
Synopsys, Inc.
Synopsys shows a mixed financial profile with a favorable net margin at 18.96% and solid liquidity ratios, current at 1.62 and quick at 1.52. However, return on equity (4.72%) and return on invested capital (1.97%) are weak, alongside a high price-to-earnings ratio of 54.36. The company does not pay dividends, likely focusing on reinvestment and R&D given its sector and growth phase.
Akamai Technologies, Inc.
Akamai’s ratios present a balanced picture with a favorable net margin of 12.65% and strong interest coverage at 22.65. Its return on equity is moderate at 10.35%, with some ratios like return on invested capital less favorable at 4.74%. The company does not distribute dividends, possibly prioritizing reinvestment and maintaining financial flexibility amid its growth and operational strategies.
Which one has the best ratios?
Both companies exhibit a neutral global ratio opinion with strengths and weaknesses. Synopsys excels in profitability margins and liquidity but struggles with returns and valuation metrics. Akamai demonstrates strong interest coverage and a more moderate return on equity but faces challenges in capital efficiency. Neither stands out definitively as superior based on the provided ratios.
Strategic Positioning
This section compares the strategic positioning of Synopsys and Akamai, focusing on Market position, Key segments, and exposure to disruption:
Synopsys, Inc.
- Market leader in electronic design automation software with strong competitive pressure from industry peers.
- Key segments include software licenses, maintenance, and technology services primarily targeting electronics and industrial sectors.
- Exposure to technological disruption through evolving semiconductor design and security testing technologies.
Akamai Technologies, Inc.
- Provides cloud services for content security and delivery facing competition in cloud infrastructure market.
- Focuses on cloud security, content delivery, media streaming, and edge computing as main business drivers.
- Faces disruption risks from advancements in cloud security and edge computing technologies.
Synopsys vs Akamai Positioning
Synopsys pursues a diversified approach with a broad product portfolio across semiconductor design and IP solutions, while Akamai concentrates on cloud-based security and delivery services. Synopsys’s broader sector exposure contrasts with Akamai’s focused cloud infrastructure niche, each with specific competitive challenges.
Which has the best competitive advantage?
Both companies exhibit very unfavorable MOAT evaluations, shedding value with declining ROIC trends. Neither currently demonstrates a sustainable competitive advantage based on efficient capital use or profitability growth.
Stock Comparison
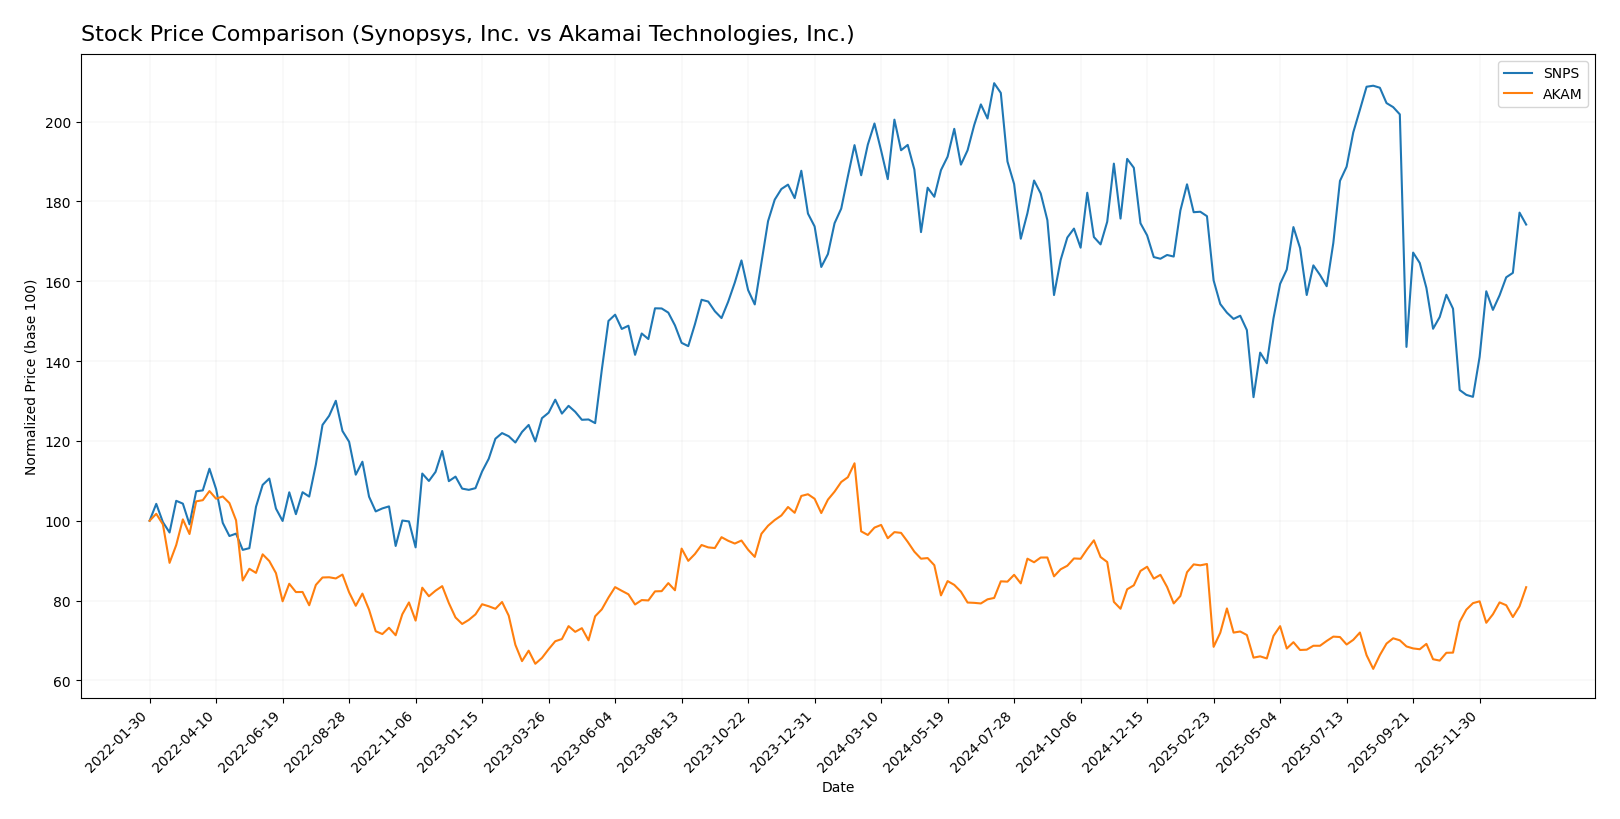
The stock price movements of Synopsys, Inc. and Akamai Technologies, Inc. over the past year reveal contrasting bearish trends with recent periods of notable recovery, reflecting shifting trading dynamics and market sentiment.
Trend Analysis
Synopsys, Inc. experienced a bearish trend over the past 12 months with a -10.31% price change and accelerating decline. Recent weeks show a strong rebound of +13.77%, indicating a short-term bullish correction.
Akamai Technologies, Inc. also showed a bearish trend with a -13.57% loss over the last year and accelerating downward momentum. Its recent +24.49% gain suggests a more pronounced short-term recovery.
Comparing both, Akamai delivered the strongest market performance in the recent period, outperforming Synopsys despite both stocks’ annual declines.
Target Prices
The consensus target prices suggest moderate upside potential for both Synopsys, Inc. and Akamai Technologies, Inc.
| Company | Target High | Target Low | Consensus |
|---|---|---|---|
| Synopsys, Inc. | 600 | 425 | 530 |
| Akamai Technologies, Inc. | 115 | 89 | 104.8 |
Analysts expect Synopsys to trade slightly above its current price of $516.31, indicating cautious optimism. Akamai’s consensus target of $104.8 also suggests a potential increase from its current price of $93.49, reflecting positive market sentiment.
Analyst Opinions Comparison
This section compares analysts’ ratings and grades for Synopsys, Inc. and Akamai Technologies, Inc.:
Rating Comparison
Synopsys, Inc. Rating
- Rating: B- with a very favorable status
- Discounted Cash Flow Score: 3 (moderate)
- ROE Score: 3 (moderate)
- ROA Score: 3 (moderate)
- Debt To Equity Score: 2 (moderate)
- Overall Score: 3 (moderate)
Akamai Technologies, Inc. Rating
- Rating: B with a very favorable status
- Discounted Cash Flow Score: 5 (very favorable)
- ROE Score: 3 (moderate)
- ROA Score: 3 (moderate)
- Debt To Equity Score: 1 (very unfavorable)
- Overall Score: 3 (moderate)
Which one is the best rated?
Akamai holds a higher overall rating (B) than Synopsys (B-), driven mainly by a superior discounted cash flow score. However, Synopsys has a better debt-to-equity score, indicating lower financial risk. Overall scores are equal.
Scores Comparison
Here is a comparison of the Altman Z-Score and Piotroski Score for Synopsys, Inc. and Akamai Technologies, Inc.:
Synopsys Scores
- Altman Z-Score: 3.54, indicating a safe zone status
- Piotroski Score: 4, showing average financial strength
Akamai Scores
- Altman Z-Score: 2.46, indicating a grey zone status
- Piotroski Score: 7, showing strong financial strength
Which company has the best scores?
Synopsys shows a stronger Altman Z-Score in the safe zone, while Akamai has a significantly higher Piotroski Score, indicating stronger financial health by that measure. Each company leads in a different score category.
Grades Comparison
The grades from multiple reputable firms for Synopsys, Inc. and Akamai Technologies, Inc. are summarized as follows:
Synopsys, Inc. Grades
The table below presents the latest grades and actions issued by recognized financial institutions for Synopsys, Inc.:
| Grading Company | Action | New Grade | Date |
|---|---|---|---|
| Piper Sandler | Downgrade | Neutral | 2026-01-13 |
| Morgan Stanley | Maintain | Overweight | 2025-12-12 |
| Rosenblatt | Maintain | Buy | 2025-12-11 |
| Keybanc | Maintain | Overweight | 2025-12-11 |
| Piper Sandler | Maintain | Overweight | 2025-12-11 |
| Needham | Maintain | Buy | 2025-12-11 |
| B of A Securities | Upgrade | Buy | 2025-12-11 |
| JP Morgan | Maintain | Overweight | 2025-12-11 |
| Wells Fargo | Maintain | Equal Weight | 2025-12-11 |
| Rosenblatt | Upgrade | Buy | 2025-12-09 |
Overall, Synopsys shows a majority of “Buy” and “Overweight” grades with a recent slight downgrade to “Neutral” from Piper Sandler, indicating generally positive sentiment with some caution.
Akamai Technologies, Inc. Grades
The table below summarizes recent grades and changes from reputable grading companies for Akamai Technologies, Inc.:
| Grading Company | Action | New Grade | Date |
|---|---|---|---|
| Citigroup | Maintain | Neutral | 2026-01-16 |
| Morgan Stanley | Upgrade | Overweight | 2026-01-12 |
| Scotiabank | Maintain | Sector Outperform | 2026-01-09 |
| RBC Capital | Maintain | Sector Perform | 2026-01-05 |
| Piper Sandler | Maintain | Neutral | 2026-01-05 |
| Keybanc | Upgrade | Overweight | 2025-12-15 |
| TD Cowen | Maintain | Hold | 2025-11-13 |
| Citigroup | Maintain | Neutral | 2025-11-11 |
| Scotiabank | Maintain | Sector Outperform | 2025-11-07 |
| Piper Sandler | Maintain | Neutral | 2025-11-07 |
Akamai’s grades cluster mostly around “Neutral” and “Hold” with some upgrades to “Overweight” and “Sector Outperform,” reflecting a more cautious but stable outlook.
Which company has the best grades?
Synopsys has consistently received stronger grades, including multiple “Buy” and “Overweight” ratings, compared to Akamai’s predominance of “Neutral” and “Hold.” For investors, Synopsys’s better grades suggest greater confidence from analysts, potentially indicating higher expected performance or lower perceived risk.
Strengths and Weaknesses
Below is a comparison of Synopsys, Inc. (SNPS) and Akamai Technologies, Inc. (AKAM) highlighting their key strengths and weaknesses based on the latest financial and operational data.
| Criterion | Synopsys, Inc. (SNPS) | Akamai Technologies, Inc. (AKAM) |
|---|---|---|
| Diversification | High – Revenue from Licenses, Maintenance, and Technology Services totaling over 5.5B USD in 2025 | Moderate – Single reportable segment with 4B USD revenue in 2024 |
| Profitability | Mixed – Strong net margin (~19%) but very unfavorable ROIC and declining profitability | Moderate – Lower net margin (12.65%), unfavorable ROIC but better interest coverage |
| Innovation | Strong – Leading in semiconductor software tools with steady R&D investment | Moderate – Focus on cloud and security, but profitability challenges persist |
| Global presence | Strong – Broad global client base in semiconductor industry | Strong – Global content delivery and cloud network presence |
| Market Share | Leading in EDA software market with significant licensing revenues | Significant player in CDN and cloud services but faces intense competition |
Key takeaways: Synopsys demonstrates solid diversification and a strong market position but struggles with declining capital efficiency and value destruction. Akamai has a robust global presence and stable operations, yet both companies face challenges in sustaining profitability and return on invested capital. Investors should weigh growth potential against these risks carefully.
Risk Analysis
Below is a comparative table of key risks for Synopsys, Inc. (SNPS) and Akamai Technologies, Inc. (AKAM) for the most recent fiscal years.
| Metric | Synopsys, Inc. (SNPS) | Akamai Technologies, Inc. (AKAM) |
|---|---|---|
| Market Risk | Beta 1.12 indicates moderate market volatility | Beta 0.69 shows lower market sensitivity |
| Debt level | Debt-to-assets 29.6%, moderate leverage | Debt-to-assets 44.7%, higher leverage risk |
| Regulatory Risk | Moderate, tech sector compliance required | Moderate, cloud security regulations apply |
| Operational Risk | Moderate due to complex software development | Moderate, dependency on cloud infrastructure |
| Environmental Risk | Low, limited direct environmental impact | Low, mainly digital services |
| Geopolitical Risk | Moderate, global supply chain exposure | Moderate, international cloud service delivery |
Synopsys faces moderate market volatility and manageable debt, but its high P/E ratio and moderate operational complexity pose caution. Akamai shows lower market volatility but higher debt leverage, though strong interest coverage mitigates immediate financial risk. The most impactful risks are market shifts affecting Synopsys and debt levels for Akamai. Both require monitoring regulatory and geopolitical dynamics in tech infrastructure.
Which Stock to Choose?
Synopsys, Inc. (SNPS) shows a generally favorable income evolution with 15.12% revenue growth in the last year and a 75.87% net income increase over five years. Its profitability is strong with an 18.89% net margin, though recent net margin and EPS growth are negative. Financial ratios are mixed: a favorable net margin and liquidity, but unfavorable ROE and ROIC; debt levels are moderate with a neutral debt-to-equity ratio. The overall rating is very favorable with a B- grade, yet the company’s MOAT evaluation signals value destruction due to declining ROIC.
Akamai Technologies, Inc. (AKAM) presents a more subdued income evolution with 4.7% revenue growth last year and a negative net income growth of -9.36% over five years. Profitability remains favorable with a 12.65% net margin but has contracted recently. Financial ratios show balanced strengths and weaknesses: a favorable WACC and interest coverage but moderate to neutral returns and elevated debt-to-equity ratio. The rating is very favorable with a B grade, supported by a strong Piotroski score, though its MOAT evaluation also indicates declining ROIC and value loss.
Investors prioritizing growth and income statement strength might find Synopsys’s higher revenue and net income growth more appealing despite its unfavorable ROE and MOAT status. Conversely, those favoring financial stability and strong cash flow metrics may see Akamai’s more stable rating and stronger financial scores as advantageous, though its income growth is less robust. Both companies demonstrate cautious signals in their MOAT evaluations, implying challenges in sustaining competitive advantages.
Disclaimer: Investment carries a risk of loss of initial capital. The past performance is not a reliable indicator of future results. Be sure to understand risks before making an investment decision.
Go Further
I encourage you to read the complete analyses of Synopsys, Inc. and Akamai Technologies, Inc. to enhance your investment decisions: