Investors seeking growth in the technology sector must carefully evaluate companies driving innovation in software infrastructure. Akamai Technologies, Inc. (AKAM) and StoneCo Ltd. (STNE) both operate in this dynamic field, yet serve distinct markets—Akamai focuses on global cloud security and content delivery, while StoneCo specializes in fintech solutions for Brazilian merchants. This article will analyze their strengths and risks to identify the most compelling investment opportunity for your portfolio.
Table of contents
Companies Overview
I will begin the comparison between Akamai Technologies and StoneCo by providing an overview of these two companies and their main differences.
Akamai Technologies Overview
Akamai Technologies, Inc. specializes in cloud services focused on securing, delivering, and optimizing internet content and business applications globally. The company offers solutions including cybersecurity, web and mobile performance, media delivery, edge computing, and carrier services. Established in 1998 and headquartered in Cambridge, Massachusetts, Akamai operates in the software infrastructure industry with a market cap of about 13.4B USD.
StoneCo Overview
StoneCo Ltd. provides financial technology solutions to merchants and partners across in-store, online, and mobile commerce in Brazil. It serves primarily small and medium businesses through hyper-local Stone Hubs and a sales force. Founded in 2000 and based in George Town, Cayman Islands, StoneCo operates as a subsidiary of HR Holdings, LLC, with a market cap of roughly 3.9B USD in the software infrastructure sector.
Key similarities and differences
Both companies operate within the software infrastructure industry but focus on distinct markets and services. Akamai targets global cloud security and content delivery, emphasizing internet performance and protection, while StoneCo concentrates on fintech solutions for Brazilian merchants. Akamai’s business is more diversified across technology services, whereas StoneCo centers on payment and commerce solutions with a regional approach.
Income Statement Comparison
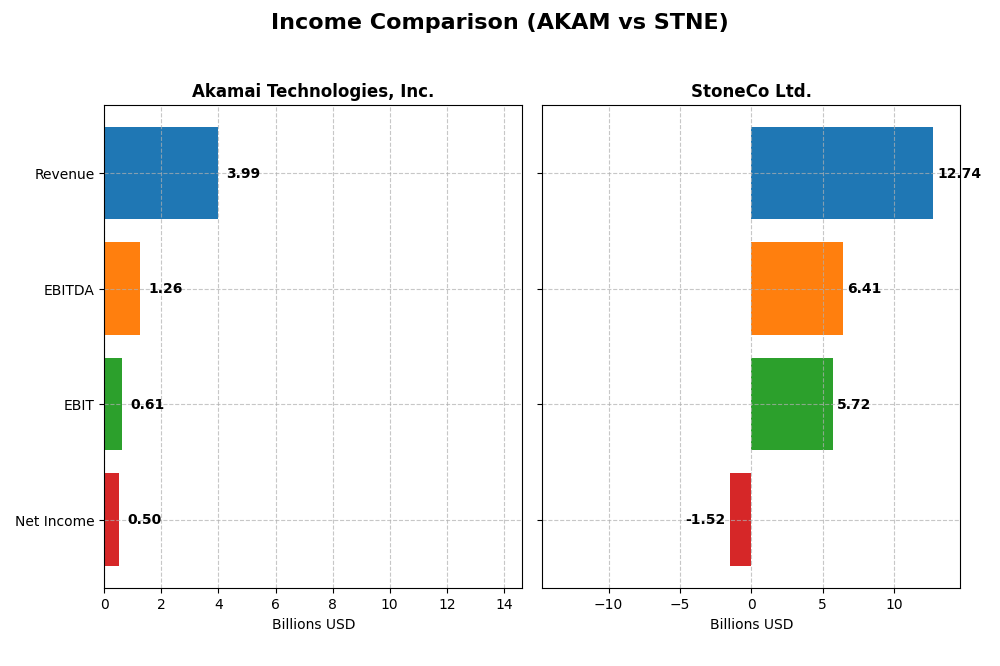
The table below presents a side-by-side comparison of key income statement metrics for Akamai Technologies, Inc. and StoneCo Ltd. for the fiscal year 2024.
| Metric | Akamai Technologies, Inc. (AKAM) | StoneCo Ltd. (STNE) |
|---|---|---|
| Market Cap | 13.4B USD | 3.9B BRL |
| Revenue | 3.99B USD | 12.7B BRL |
| EBITDA | 1.26B USD | 6.41B BRL |
| EBIT | 614M USD | 5.72B BRL |
| Net Income | 505M USD | -1.52B BRL |
| EPS | 3.34 USD | -5.02 BRL |
| Fiscal Year | 2024 | 2024 |
Income Statement Interpretations
Akamai Technologies, Inc.
Akamai showed consistent revenue growth from 3.2B in 2020 to nearly 4B in 2024, but net income declined from 557M to 505M over the same period. Gross and net margins remained favorable, around 59% and 12.7% respectively, although the net margin fell by 27% overall. In 2024, revenue growth slowed to 4.7% while net income and EPS declined, indicating margin pressures.
StoneCo Ltd.
StoneCo’s revenue surged significantly from 3.2B BRL in 2020 to 12.7B BRL in 2024, supported by a strong gross margin of 73.4%. Despite this, net income turned sharply negative in 2024 at -1.5B BRL, reflecting prolonged net margin weakness and high interest expenses. The company posted positive EBIT margin growth and revenue gains in 2024 but suffered declining net margin and EPS.
Which one has the stronger fundamentals?
Akamai maintains stable profitability with favorable gross and net margins despite recent earnings decline, showing resilience and prudent cost management. StoneCo exhibits extraordinary top-line growth and strong operating margins but faces significant net losses and volatile earnings. Akamai’s more consistent income statement fundamentals contrast with StoneCo’s growth at the cost of profitability challenges.
Financial Ratios Comparison
Below is a comparison of key financial ratios for Akamai Technologies, Inc. (AKAM) and StoneCo Ltd. (STNE) based on the most recent fiscal year data available (2024).
| Ratios | Akamai Technologies, Inc. (AKAM) | StoneCo Ltd. (STNE) |
|---|---|---|
| ROE | 10.35% | -12.87% |
| ROIC | 4.74% | 22.41% |
| P/E | 28.68 | -9.84 |
| P/B | 2.97 | 1.27 |
| Current Ratio | 1.23 | 1.37 |
| Quick Ratio | 1.23 | 1.37 |
| D/E (Debt-to-Equity) | 0.95 | 1.10 |
| Debt-to-Assets | 44.70% | 23.53% |
| Interest Coverage | 19.67 | 5.57 |
| Asset Turnover | 0.38 | 0.23 |
| Fixed Asset Turnover | 1.33 | 6.95 |
| Payout Ratio | 0% | 0% |
| Dividend Yield | 0% | 0% |
Interpretation of the Ratios
Akamai Technologies, Inc.
Akamai’s ratios show a balanced profile with favorable net margin (12.65%) and interest coverage (22.65), but concerns arise from an unfavorable return on invested capital (4.74%) and a high price-to-earnings ratio (28.68). The company does not pay dividends, reflecting a likely reinvestment strategy or growth focus, with no share buybacks indicated.
StoneCo Ltd.
StoneCo presents mixed ratios with unfavorable net margin (-11.89%) and return on equity (-12.87%), but favorable return on invested capital (22.41%) and price-to-book ratio (1.27). The company also does not distribute dividends, likely due to negative profitability, prioritizing reinvestment or expansion, and maintains some debt levels with favorable interest coverage.
Which one has the best ratios?
StoneCo displays more favorable ratios overall (50% favorable) compared to Akamai’s 28.57%, particularly in capital efficiency and valuation metrics. However, StoneCo faces profitability challenges, while Akamai shows steadier margins but weaker capital returns. The choice depends on weighing growth potential against current profitability and financial stability.
Strategic Positioning
This section compares the strategic positioning of Akamai Technologies, Inc. and StoneCo Ltd., including market position, key segments, and exposure to technological disruption:
Akamai Technologies, Inc.
- Leading cloud services provider with significant market cap of 13.4B, facing moderate competitive pressure.
- Focuses on cloud security, content delivery, web/mobile performance, media delivery, and edge computing.
- Positioned in software infrastructure with evolving cloud and cybersecurity technologies, facing ongoing tech disruption.
StoneCo Ltd.
- Fintech solutions leader in Brazil with a smaller 3.9B market cap, operating in a competitive local market.
- Concentrates on financial technology for merchants across in-store, online, and mobile commerce channels.
- Operates in fintech with reliance on digital payments, exposed to fast technological shifts in commerce solutions.
Akamai Technologies, Inc. vs StoneCo Ltd. Positioning
Akamai has a diversified technology portfolio spanning cloud security and content delivery, offering broad business drivers, whereas StoneCo concentrates on fintech solutions primarily for Brazilian merchants. Akamai’s global scale contrasts with StoneCo’s regional focus, impacting competitive dynamics.
Which has the best competitive advantage?
StoneCo shows a very favorable moat with growing ROIC and value creation, indicating a durable competitive advantage. Akamai displays a very unfavorable moat with declining ROIC, signaling value destruction and weakening profitability.
Stock Comparison
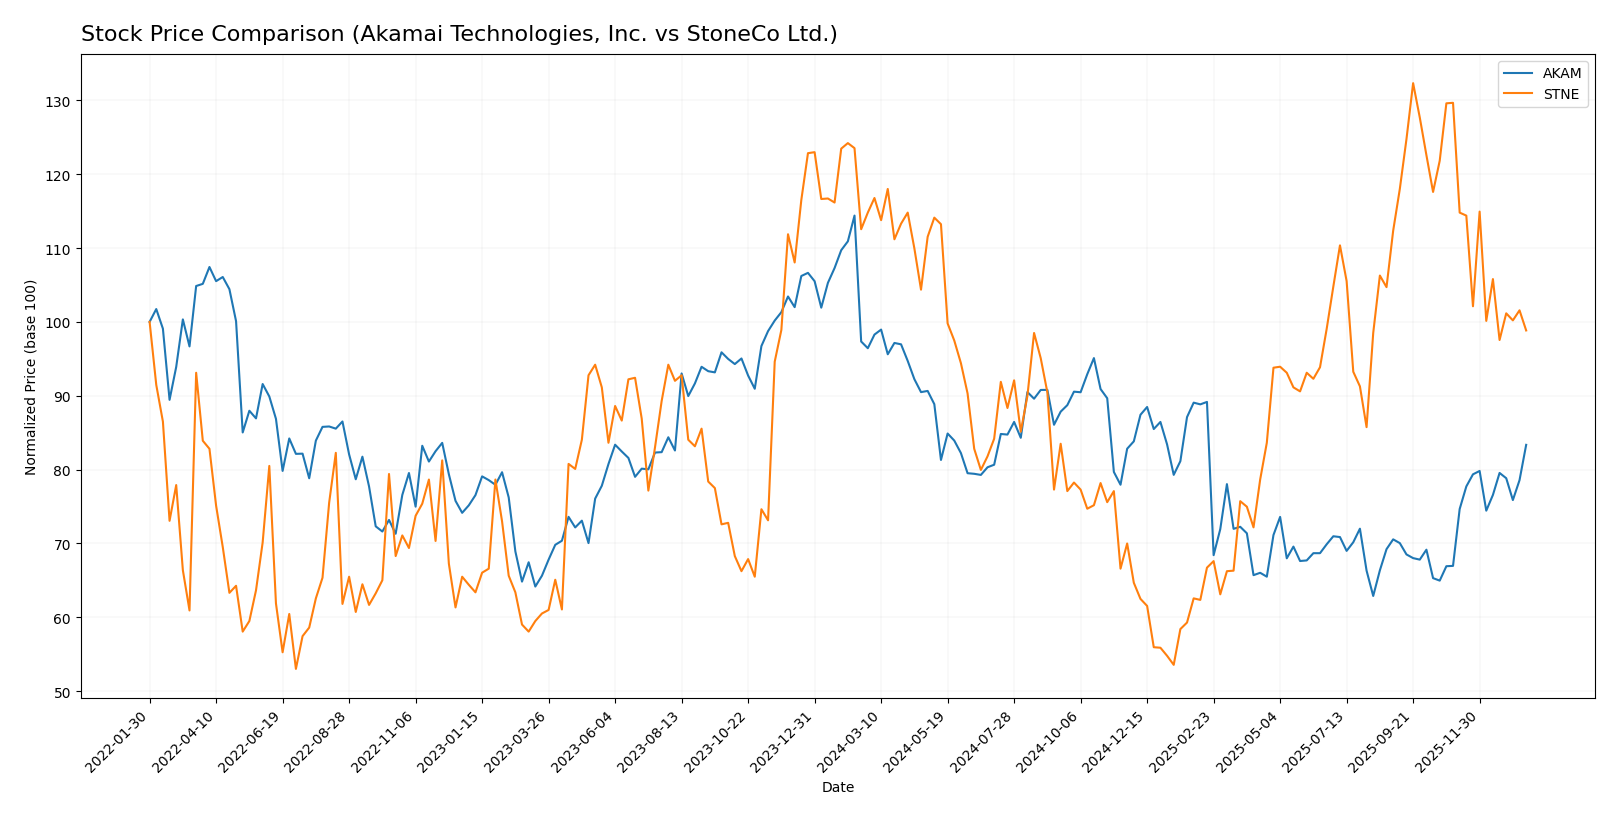
The stock price movements over the past year show contrasting dynamics between Akamai Technologies, Inc. and StoneCo Ltd., with Akamai experiencing a significant rebound recently, while StoneCo’s decline has accelerated.
Trend Analysis
Akamai Technologies, Inc. experienced a bearish trend over the past 12 months, with a price decline of 13.57% and accelerating downward momentum despite a recent strong rebound of 24.49% since November 2025.
StoneCo Ltd. also showed a bearish trend over the past year, with a 13.9% price drop and decelerating losses; however, recent performance worsened with a 23.78% decline between November 2025 and January 2026.
Comparing both, Akamai outperformed StoneCo in recent months, showing a significant recovery while StoneCo’s stock continued to weaken, resulting in Akamai delivering the highest market performance over the analyzed period.
Target Prices
Analysts present a clear target price consensus for Akamai Technologies, Inc. and StoneCo Ltd.
| Company | Target High | Target Low | Consensus |
|---|---|---|---|
| Akamai Technologies, Inc. | 115 | 89 | 104.8 |
| StoneCo Ltd. | 20 | 20 | 20 |
The target prices suggest moderate upside potential for Akamai, with a consensus above the current price of $93.49. StoneCo’s consensus target of $20 indicates expected growth from its current $14.49 stock price.
Analyst Opinions Comparison
This section compares the analysts’ ratings and grades for Akamai Technologies, Inc. (AKAM) and StoneCo Ltd. (STNE):
Rating Comparison
AKAM Rating
- Rating: B, indicating a very favorable outlook.
- Discounted Cash Flow Score: 5, very favorable valuation.
- ROE Score: 3, moderate efficiency in generating equity profit.
- ROA Score: 3, moderate asset utilization.
- Debt To Equity Score: 1, very unfavorable financial risk.
- Overall Score: 3, moderate overall financial standing.
STNE Rating
- Rating: C, also described as very favorable.
- Discounted Cash Flow Score: 3, moderate valuation.
- ROE Score: 1, very unfavorable profitability.
- ROA Score: 1, very unfavorable asset use.
- Debt To Equity Score: 1, very unfavorable financial risk.
- Overall Score: 2, moderate but lower than AKAM’s score.
Which one is the best rated?
Based strictly on the provided data, AKAM holds a higher overall rating (B) and scores better in discounted cash flow, ROE, and ROA metrics compared to STNE’s C rating and weaker profitability scores. Both have equally unfavorable debt-to-equity scores.
Scores Comparison
The following table compares the Altman Z-Score and Piotroski Score of Akamai Technologies, Inc. (AKAM) and StoneCo Ltd. (STNE):
AKAM Scores
- Altman Z-Score of 2.46 places AKAM in the grey zone, indicating moderate bankruptcy risk.
- Piotroski Score of 7 shows AKAM has strong financial health based on profitability and efficiency metrics.
STNE Scores
- Altman Z-Score of 1.02 places STNE in the distress zone, indicating high bankruptcy risk.
- Piotroski Score of 5 reflects average financial strength for STNE according to key financial criteria.
Which company has the best scores?
Based strictly on the provided data, AKAM has better scores than STNE, with a higher Altman Z-Score in the grey zone versus distress, and a stronger Piotroski Score of 7 compared to STNE’s average 5.
Grades Comparison
Here is a comparison of the recent grades assigned to Akamai Technologies, Inc. and StoneCo Ltd. by reputable grading companies:
Akamai Technologies, Inc. Grades
Below is the table summarizing recent grades for Akamai Technologies, Inc. from well-known financial institutions:
| Grading Company | Action | New Grade | Date |
|---|---|---|---|
| Citigroup | Maintain | Neutral | 2026-01-16 |
| Morgan Stanley | Upgrade | Overweight | 2026-01-12 |
| Scotiabank | Maintain | Sector Outperform | 2026-01-09 |
| RBC Capital | Maintain | Sector Perform | 2026-01-05 |
| Piper Sandler | Maintain | Neutral | 2026-01-05 |
| Keybanc | Upgrade | Overweight | 2025-12-15 |
| TD Cowen | Maintain | Hold | 2025-11-13 |
| Citigroup | Maintain | Neutral | 2025-11-11 |
| Scotiabank | Maintain | Sector Outperform | 2025-11-07 |
| Piper Sandler | Maintain | Neutral | 2025-11-07 |
Overall, Akamai’s grades show a stable to improving trend with several upgrades to overweight and consistent sector outperform ratings.
StoneCo Ltd. Grades
Here is the table displaying recent grades for StoneCo Ltd. from recognized financial firms:
| Grading Company | Action | New Grade | Date |
|---|---|---|---|
| Goldman Sachs | Maintain | Buy | 2025-10-14 |
| B of A Securities | Maintain | Buy | 2025-09-09 |
| UBS | Maintain | Buy | 2025-08-29 |
| JP Morgan | Maintain | Overweight | 2025-07-16 |
| Barclays | Maintain | Equal Weight | 2025-05-12 |
| Barclays | Maintain | Equal Weight | 2025-04-23 |
| Citigroup | Upgrade | Buy | 2025-04-22 |
| Barclays | Maintain | Equal Weight | 2025-03-21 |
| Morgan Stanley | Maintain | Underweight | 2025-03-21 |
| Goldman Sachs | Maintain | Buy | 2025-02-06 |
StoneCo Ltd. consistently receives buy and overweight grades from top institutions, despite some equal weight and underweight ratings, indicating generally positive sentiment.
Which company has the best grades?
StoneCo Ltd. has received more consistent buy and overweight grades compared to Akamai Technologies, which has a broader spread including neutral and sector perform ratings. This difference suggests StoneCo may be viewed by analysts as having stronger near-term growth potential, which could influence investor confidence and portfolio positioning accordingly.
Strengths and Weaknesses
Below is a comparative overview of key strengths and weaknesses for Akamai Technologies, Inc. (AKAM) and StoneCo Ltd. (STNE) based on their recent financial and strategic metrics.
| Criterion | Akamai Technologies, Inc. (AKAM) | StoneCo Ltd. (STNE) |
|---|---|---|
| Diversification | Moderate product range with $3.99B revenue in 2024; focused on digital services | Less diversified; primarily fintech and payment solutions |
| Profitability | Positive net margin (12.65%) but declining ROIC; value destroying | Negative net margin (-11.89%) but strong ROIC (22.41%), value creating |
| Innovation | Moderate innovation; declining ROIC signals challenges in maintaining competitive edge | High innovation; growing ROIC indicates strong competitive advantage |
| Global presence | Established global player in content delivery and cloud services | Regional focus in Brazil with growth potential |
| Market Share | Solid market presence in content delivery networks | Emerging player in fintech with increasing market share |
Key takeaways: Akamai shows stable profitability but struggles with declining capital efficiency and innovation momentum, risking long-term value creation. StoneCo, despite current losses, demonstrates strong capital returns and innovation growth, signaling potential for durable competitive advantage and value creation. Investors should weigh Akamai’s stability against StoneCo’s growth prospects and higher risk.
Risk Analysis
Below is a comparative table outlining key risks for Akamai Technologies, Inc. (AKAM) and StoneCo Ltd. (STNE) based on the most recent available data from 2024 and market conditions in 2026:
| Metric | Akamai Technologies, Inc. (AKAM) | StoneCo Ltd. (STNE) |
|---|---|---|
| Market Risk | Moderate (Beta 0.685, tech sector stability) | High (Beta 1.835, exposure to volatile Brazilian market) |
| Debt level | Moderate (Debt/Equity ~0.95, neutral status) | Elevated (Debt/Equity 1.1, unfavorable rating) |
| Regulatory Risk | Moderate (US and international cloud security regulations) | High (Brazilian fintech regulations and currency controls) |
| Operational Risk | Moderate (Cloud infrastructure complexity, cyber threats) | Moderate to High (Fintech platform reliability, market competition) |
| Environmental Risk | Low (Technology sector, limited direct exposure) | Low (Digital payments, limited direct exposure) |
| Geopolitical Risk | Low to Moderate (Global operations but US-based) | High (Headquartered in Cayman Islands, heavy Brazil focus) |
In summary, StoneCo faces higher market, regulatory, and geopolitical risks due to its exposure to Brazil’s challenging economic environment and fintech regulations. Akamai’s risks are more moderate, tied mainly to market volatility and operational cyber risks. The most impactful risk for StoneCo is geopolitical and regulatory uncertainty, while for Akamai, operational resilience and market stability are key concerns. Investors should weigh these factors carefully, considering StoneCo’s financial distress signals versus Akamai’s more stable profile.
Which Stock to Choose?
Akamai Technologies, Inc. (AKAM) shows a mixed income evolution with a 24.8% revenue growth over 2020-2024 but declining net margin and EPS. Its financial ratios are neutral overall, with favorable net margin but unfavorable ROIC and P/E. The company has moderate profitability, neutral debt levels, and a very favorable B rating. However, its MOAT evaluation is very unfavorable due to declining ROIC below WACC.
StoneCo Ltd. (STNE) exhibits strong revenue growth of 302.3% over the period, with favorable income statement trends despite negative net margin and EPS growth. Its financial ratios are slightly favorable, featuring strong ROIC above WACC and low debt-to-assets but unfavorable net margin and ROE. The company has moderate profitability, somewhat higher debt risk, and a very favorable C rating. Its MOAT is very favorable with rising ROIC.
For investors prioritizing value creation and competitive advantage, StoneCo’s very favorable MOAT and improving income profile might appear more appealing. Conversely, those valuing stable financial ratios and moderate rating could interpret Akamai’s position as more balanced despite its declining profitability. The choice might depend on the investor’s risk tolerance and emphasis on growth versus financial stability.
Disclaimer: Investment carries a risk of loss of initial capital. The past performance is not a reliable indicator of future results. Be sure to understand risks before making an investment decision.
Go Further
I encourage you to read the complete analyses of Akamai Technologies, Inc. and StoneCo Ltd. to enhance your investment decisions: