Palo Alto Networks, Inc. and Akamai Technologies, Inc. are two leading players in the software infrastructure industry, both specializing in cybersecurity and cloud services. While Palo Alto Networks focuses on comprehensive network security solutions, Akamai excels in content delivery and cloud-based performance optimization. Their overlapping markets and innovative approaches make them natural competitors. In this article, I will help you decide which company presents a more compelling investment opportunity in 2026.

Table of contents
Companies Overview
I will begin the comparison between Palo Alto Networks and Akamai Technologies by providing an overview of these two companies and their main differences.
Palo Alto Networks Overview
Palo Alto Networks, Inc. is a leading cybersecurity company headquartered in Santa Clara, California. It specializes in providing comprehensive cybersecurity solutions, including firewall appliances, subscription services for threat prevention, cloud security, and consulting. Serving medium to large enterprises and government entities across various sectors, Palo Alto Networks emphasizes integrated security management and threat intelligence to protect networks globally.
Akamai Technologies Overview
Akamai Technologies, Inc., based in Cambridge, Massachusetts, offers cloud services focused on securing, delivering, and optimizing web content and business applications. The company provides solutions for cybersecurity, web and mobile performance, media delivery, and edge computing. Akamai serves a global client base through direct and partner sales, aiming to enhance the safety and efficiency of internet infrastructure and online experiences.
Key similarities and differences
Both Palo Alto Networks and Akamai operate in the software infrastructure industry with a focus on cybersecurity, targeting enterprise clients worldwide. While Palo Alto Networks emphasizes firewall and threat prevention services alongside cloud security, Akamai concentrates on content delivery, cloud security, and edge computing solutions. Their business models overlap in cybersecurity but differ in product scope, with Palo Alto Networks providing comprehensive network security and Akamai focusing on internet content optimization and cloud performance.
Income Statement Comparison
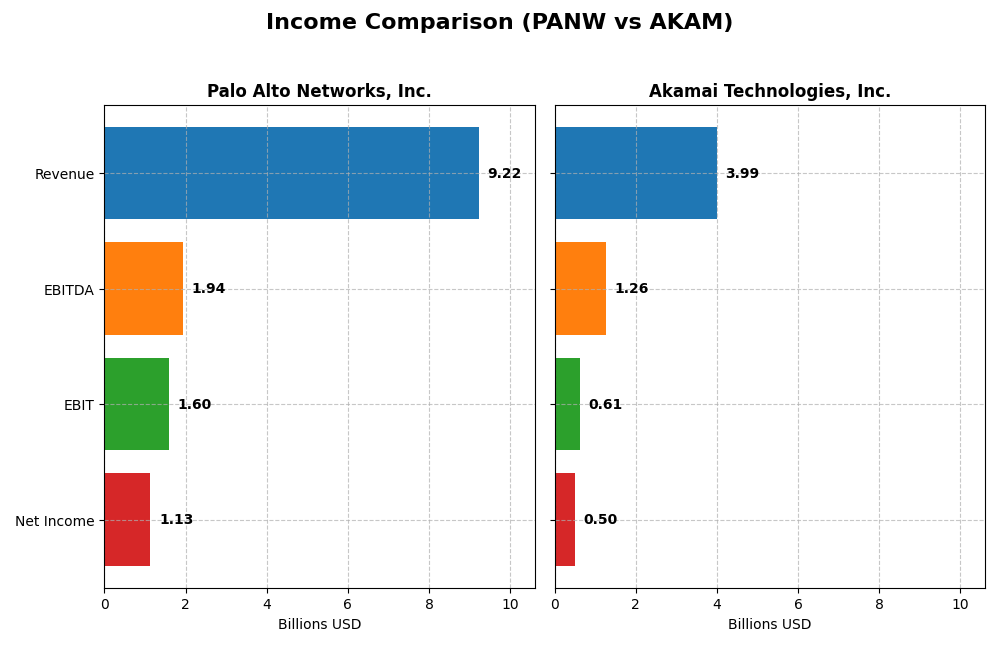
The table below compares the latest fiscal year income statement metrics for Palo Alto Networks, Inc. and Akamai Technologies, Inc., providing a snapshot of their financial performance.
| Metric | Palo Alto Networks, Inc. | Akamai Technologies, Inc. |
|---|---|---|
| Market Cap | 128.4B | 13.4B |
| Revenue | 9.22B | 3.99B |
| EBITDA | 1.94B | 1.26B |
| EBIT | 1.60B | 614M |
| Net Income | 1.13B | 505M |
| EPS | 1.71 | 3.34 |
| Fiscal Year | 2025 | 2024 |
Income Statement Interpretations
Palo Alto Networks, Inc.
Palo Alto Networks demonstrated strong revenue growth from $4.26B in 2021 to $9.22B in 2025, with net income turning positive and rising to $1.13B in 2025. Margins improved significantly, highlighted by a 73.41% gross margin and a favorable 12.3% net margin in 2025. The latest year showed solid revenue and EBIT growth, though net margin and EPS declined sharply.
Akamai Technologies, Inc.
Akamai’s revenue grew moderately from $3.20B in 2020 to $3.99B in 2024, while net income decreased to $505M in 2024. Margins remain stable with a gross margin near 59.4% and net margin at 12.65%. The most recent year saw neutral revenue growth but unfavorable trends in EBIT, net margin, and EPS, indicating some operational challenges.
Which one has the stronger fundamentals?
Palo Alto Networks exhibits stronger fundamentals with robust revenue and net income growth, favorable margin expansions, and a positive overall income statement evaluation. Conversely, Akamai shows slower growth, declining net income, and multiple unfavorable margin trends. The data suggest Palo Alto Networks currently has a more favorable income statement profile.
Financial Ratios Comparison
The table below presents a side-by-side comparison of key financial ratios for Palo Alto Networks, Inc. (PANW) and Akamai Technologies, Inc. (AKAM) based on their most recent fiscal year data.
| Ratios | Palo Alto Networks, Inc. (2025) | Akamai Technologies, Inc. (2024) |
|---|---|---|
| ROE | 14.5% | 10.4% |
| ROIC | 5.7% | 4.7% |
| P/E | 101.4 | 28.7 |
| P/B | 14.7 | 3.0 |
| Current Ratio | 0.89 | 1.23 |
| Quick Ratio | 0.89 | 1.23 |
| D/E (Debt-to-Equity) | 0.04 | 0.95 |
| Debt-to-Assets | 1.4% | 44.7% |
| Interest Coverage | 414.3 | 19.7 |
| Asset Turnover | 0.39 | 0.38 |
| Fixed Asset Turnover | 12.6 | 1.33 |
| Payout Ratio | 0% | 0% |
| Dividend Yield | 0% | 0% |
Interpretation of the Ratios
Palo Alto Networks, Inc.
Palo Alto Networks shows a slightly favorable overall ratio profile, with strong interest coverage at 532.53 and low debt levels (D/E 0.04). However, high valuation ratios like a P/E of 101.43 and P/B of 14.7, combined with a weak current ratio of 0.89, raise liquidity concerns. The company does not pay dividends, likely due to reinvestment in growth and R&D, as indicated by its 21.5% R&D-to-revenue ratio.
Akamai Technologies, Inc.
Akamai’s ratios present a neutral overall picture, featuring a favorable current ratio of 1.23 and solid interest coverage at 22.65. Its P/E is more reasonable at 28.68, but ROIC at 4.74% is unfavorable. The firm also pays no dividends, presumably prioritizing reinvestment and innovation, aligned with its stable but moderate profitability and operational metrics.
Which one has the best ratios?
Palo Alto Networks edges ahead with a higher proportion of favorable ratios and exceptional interest coverage, despite liquidity and valuation drawbacks. Akamai maintains a balanced and neutral stance, with fewer extremes in either direction. The choice depends on investor preference between Palo Alto’s growth focus and Akamai’s steadier financial profile.
Strategic Positioning
This section compares the strategic positioning of Palo Alto Networks, Inc. and Akamai Technologies, Inc. across Market position, Key segments, and Exposure to technological disruption:
Palo Alto Networks, Inc.
- Leading cybersecurity provider with significant market cap and moderate competitive pressure.
- Revenue driven by subscriptions (4.97B), product sales (1.8B), and support services (2.45B).
- Positioned in cybersecurity software and cloud security with exposure to evolving cyber threats.
Akamai Technologies, Inc.
- Cloud services provider focused on internet security and content delivery with smaller market cap.
- Revenue primarily from cloud services for security, content delivery, and edge computing.
- Exposed to cloud infrastructure and performance optimization disruptions in internet services.
Palo Alto Networks, Inc. vs Akamai Technologies, Inc. Positioning
Palo Alto Networks has a diversified revenue base across subscription, product, and support segments, while Akamai concentrates on cloud security and delivery services. Palo Alto’s broad cybersecurity focus contrasts with Akamai’s specialization in internet performance and edge computing.
Which has the best competitive advantage?
Both companies are currently destroying value as ROIC is below WACC. Palo Alto shows improving profitability with growing ROIC, whereas Akamai faces declining ROIC and worsening profitability, indicating Palo Alto’s moat is slightly less unfavorable.
Stock Comparison
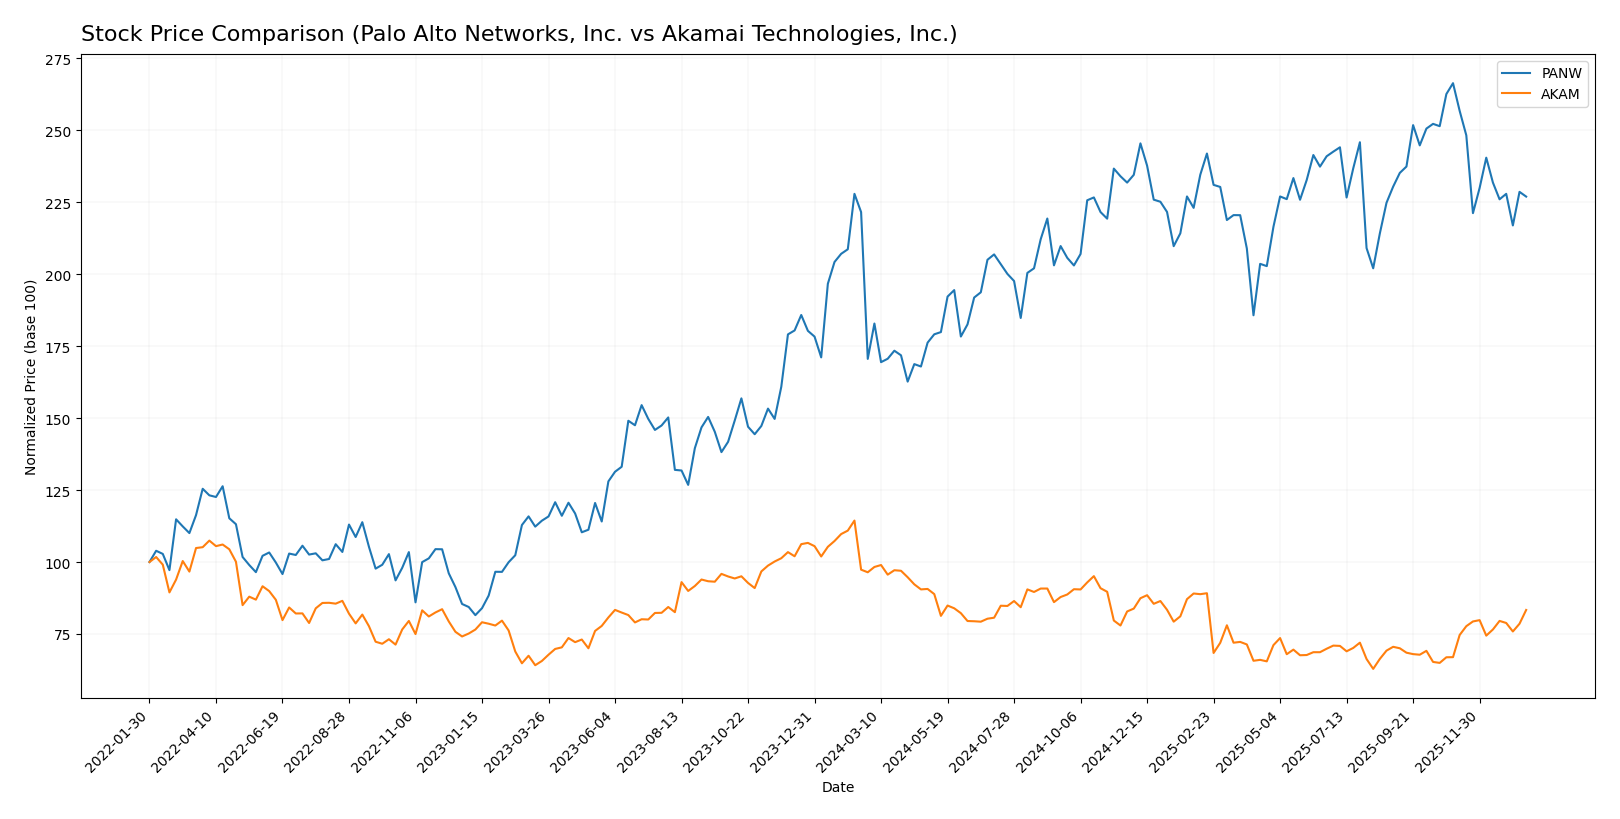
The past year showcased contrasting dynamics between Palo Alto Networks, Inc. and Akamai Technologies, Inc., with PANW exhibiting a strong bullish trend despite recent deceleration, while AKAM faced a bearish overall trend but showed renewed recent strength.
Trend Analysis
Palo Alto Networks, Inc. demonstrated a bullish trend over the past 12 months with a 33.05% price increase, though its upward momentum has decelerated recently, accompanied by a -14.79% decline in the last 2.5 months. The stock showed significant volatility with a 19.95 std deviation.
Akamai Technologies, Inc. experienced a bearish trend over the past year with a -13.57% price decrease but displayed an accelerating recovery recently, gaining 24.49% over the last 2.5 months and showing lower volatility at 10.92 std deviation.
Comparing both, Palo Alto Networks delivered the highest market performance over the full year, despite recent weakness, while Akamai’s recent rebound may indicate early recovery but has yet to offset its annual losses.
Target Prices
Analysts provide a clear consensus on target prices for Palo Alto Networks, Inc. and Akamai Technologies, Inc.
| Company | Target High | Target Low | Consensus |
|---|---|---|---|
| Palo Alto Networks, Inc. | 265 | 157 | 231.07 |
| Akamai Technologies, Inc. | 115 | 89 | 104.8 |
The consensus target prices suggest upside potential for both stocks versus current prices: PANW trades near 188 USD, below its 231 USD consensus, while AKAM trades at 93.5 USD, below its 104.8 USD consensus. This indicates moderate positive analyst expectations.
Analyst Opinions Comparison
This section compares analysts’ ratings and financial grades for Palo Alto Networks, Inc. and Akamai Technologies, Inc.:
Rating Comparison
Palo Alto Networks, Inc. Rating
- Rating: B, considered Very Favorable by analysts.
- Discounted Cash Flow Score: 4, Favorable valuation.
- ROE Score: 4, showing strong efficiency in generating profit from equity.
- ROA Score: 3, moderate asset utilization effectiveness.
- Debt To Equity Score: 4, favorable with low financial risk.
- Overall Score: 3, moderate financial standing.
Akamai Technologies, Inc. Rating
- Rating: B, also rated Very Favorable by analysts.
- Discounted Cash Flow Score: 5, Very Favorable valuation.
- ROE Score: 3, indicating moderate efficiency.
- ROA Score: 3, also moderate asset utilization.
- Debt To Equity Score: 1, very unfavorable, indicating high financial risk.
- Overall Score: 3, moderate financial standing.
Which one is the best rated?
Both companies share the same overall rating of B with a moderate overall score of 3. Akamai has a higher DCF score but a much weaker debt-to-equity score compared to Palo Alto Networks, which shows better financial stability.
Scores Comparison
The scores comparison between Palo Alto Networks and Akamai Technologies is as follows:
PANW Scores
- Altman Z-Score: 5.95, indicating a safe zone status, low bankruptcy risk.
- Piotroski Score: 6, categorized as average financial strength.
AKAM Scores
- Altman Z-Score: 2.46, placing it in the grey zone with moderate bankruptcy risk.
- Piotroski Score: 7, representing strong financial health.
Which company has the best scores?
Palo Alto Networks shows a higher Altman Z-Score, suggesting better bankruptcy safety. Akamai has a stronger Piotroski Score, indicating better financial health. Each company leads in one key financial metric based on the data provided.
Grades Comparison
Here is a detailed comparison of the recent grades assigned to Palo Alto Networks, Inc. and Akamai Technologies, Inc.:
Palo Alto Networks, Inc. Grades
The table below shows recent grades from reputable grading companies for Palo Alto Networks, Inc.:
| Grading Company | Action | New Grade | Date |
|---|---|---|---|
| UBS | Maintain | Neutral | 2026-01-13 |
| Piper Sandler | Maintain | Overweight | 2026-01-05 |
| Guggenheim | Upgrade | Neutral | 2026-01-05 |
| Morgan Stanley | Maintain | Overweight | 2025-12-18 |
| Goldman Sachs | Maintain | Buy | 2025-11-21 |
| HSBC | Downgrade | Reduce | 2025-11-21 |
| Needham | Maintain | Buy | 2025-11-20 |
| WestPark Capital | Maintain | Hold | 2025-11-20 |
| Bernstein | Maintain | Outperform | 2025-11-20 |
| DA Davidson | Maintain | Buy | 2025-11-20 |
The overall trend for Palo Alto Networks shows a majority of “Buy” and “Overweight” ratings, with one downgrade to “Reduce” by HSBC, indicating generally positive but mixed sentiment.
Akamai Technologies, Inc. Grades
The table below presents recent grades from verified grading companies for Akamai Technologies, Inc.:
| Grading Company | Action | New Grade | Date |
|---|---|---|---|
| Citigroup | Maintain | Neutral | 2026-01-16 |
| Morgan Stanley | Upgrade | Overweight | 2026-01-12 |
| Scotiabank | Maintain | Sector Outperform | 2026-01-09 |
| RBC Capital | Maintain | Sector Perform | 2026-01-05 |
| Piper Sandler | Maintain | Neutral | 2026-01-05 |
| Keybanc | Upgrade | Overweight | 2025-12-15 |
| TD Cowen | Maintain | Hold | 2025-11-13 |
| Citigroup | Maintain | Neutral | 2025-11-11 |
| Scotiabank | Maintain | Sector Outperform | 2025-11-07 |
| Piper Sandler | Maintain | Neutral | 2025-11-07 |
Akamai’s grades reveal a stable pattern with several “Neutral” and “Hold” ratings, but recent upgrades to “Overweight” and consistent “Sector Outperform” suggest cautiously improving sentiment.
Which company has the best grades?
Palo Alto Networks holds a stronger consensus with 61 “Buy” ratings and an overall “Buy” consensus, while Akamai exhibits a more mixed profile with 24 “Buy” and 25 “Hold” ratings, resulting in a “Hold” consensus. Investors may perceive Palo Alto Networks as having more bullish analyst support, potentially influencing portfolio weighting decisions.
Strengths and Weaknesses
Below is a comparative overview of key strengths and weaknesses for Palo Alto Networks, Inc. (PANW) and Akamai Technologies, Inc. (AKAM) based on the most recent financial and operational data.
| Criterion | Palo Alto Networks, Inc. (PANW) | Akamai Technologies, Inc. (AKAM) |
|---|---|---|
| Diversification | Strong product mix with significant subscription growth; multiple revenue streams: products, subscriptions, support | Limited segmentation; primarily one reportable segment, less diversified |
| Profitability | Positive net margin (12.3%), growing ROIC but below WACC indicating slight value destruction | Favorable net margin (12.65%) but declining ROIC below WACC, indicating value destruction |
| Innovation | High fixed asset turnover (12.56) suggests efficient use of assets in innovative capacities | Lower fixed asset turnover (1.33) reflects moderate innovation efficiency |
| Global presence | Solid global footprint supported by substantial subscription revenues ($4.97B in 2025) | Global presence but less diversified revenue, $3.99B total segment revenue |
| Market Share | High valuation multiples (PE 101.43, PB 14.7) indicate market confidence but risk of overvaluation | More reasonable valuation (PE 28.68, PB 2.97), but less favorable ROIC trend |
In summary, PANW demonstrates strong growth and diversified revenue streams but faces challenges with value creation and high valuation risks. AKAM shows steady profitability but suffers from declining efficiency and less diversification, calling for cautious evaluation before investment.
Risk Analysis
Below is a comparative risk overview for Palo Alto Networks, Inc. (PANW) and Akamai Technologies, Inc. (AKAM) based on the latest available data from 2025 and 2024.
| Metric | Palo Alto Networks, Inc. (PANW) | Akamai Technologies, Inc. (AKAM) |
|---|---|---|
| Market Risk | Moderate (Beta 0.75) | Moderate (Beta 0.69) |
| Debt Level | Low (D/E 0.04, Debt to Assets 1.43%) | Moderate (D/E 0.95, Debt to Assets 44.7%) |
| Regulatory Risk | Moderate (Cybersecurity sector scrutiny) | Moderate (Cloud services regulation) |
| Operational Risk | Moderate (Complex firewall & cloud solutions) | Moderate (Cloud and edge computing services) |
| Environmental Risk | Low (Technology sector, limited direct impact) | Low (Technology sector, limited direct impact) |
| Geopolitical Risk | Moderate (Global cybersecurity demand, US-based) | Moderate (Global internet infrastructure exposure) |
In synthesis, both companies face moderate market and regulatory risks typical of the technology and cybersecurity sectors. PANW’s low debt level and strong interest coverage reduce financial risk, making its leverage profile favorable. AKAM’s higher debt ratio and moderate interest coverage increase financial risk. The most impactful risk for both is regulatory scrutiny amid evolving cybersecurity and cloud regulations, which can affect compliance costs and operational flexibility. Investors should monitor debt levels for AKAM and regulatory developments globally.
Which Stock to Choose?
Palo Alto Networks, Inc. (PANW) shows strong income growth with a 116.67% revenue increase over five years and a favorable 2025 income statement overall. Its profitability is solid with a 12.3% net margin, though recent net margin growth declined. Financial ratios are slightly favorable, supported by low debt levels and excellent interest coverage, despite some valuation concerns and a low current ratio. The company is shedding value with a slightly unfavorable moat rating but has a growing ROIC trend.
Akamai Technologies, Inc. (AKAM) has a neutral income evolution with modest revenue growth of 24.8% over five years but an unfavorable overall income statement trend due to declining net income and margins. Its financial ratios present a neutral global opinion, with moderate leverage and good interest coverage, but higher debt-to-equity raises some caution. The company is also shedding value with a very unfavorable moat rating and a declining ROIC trend.
Investors focused on growth might find PANW’s strong income growth and improving profitability more appealing, while those prioritizing moderate financial stability and consistent income might view AKAM’s profile as more neutral. The ratings and ratio evaluations suggest PANW could be seen as slightly more favorable overall, but the choice could depend on the investor’s risk tolerance and investment strategy.
Disclaimer: Investment carries a risk of loss of initial capital. The past performance is not a reliable indicator of future results. Be sure to understand risks before making an investment decision.
Go Further
I encourage you to read the complete analyses of Palo Alto Networks, Inc. and Akamai Technologies, Inc. to enhance your investment decisions: