Home > Comparison > Technology > PLTR vs AKAM
The strategic rivalry between Palantir Technologies Inc. and Akamai Technologies, Inc. shapes the evolution of the software infrastructure sector. Palantir operates as a data analytics innovator, focusing on government and enterprise intelligence platforms. Akamai delivers cloud-based security and content delivery services, emphasizing internet performance and protection. This analysis pits Palantir’s growth-driven model against Akamai’s stable, service-oriented approach to identify which offers a superior risk-adjusted return for diversified portfolios.

Table of contents
Companies Overview
Palantir Technologies and Akamai Technologies each hold prominent positions in the software infrastructure market, driving innovation in data and cloud solutions.
Palantir Technologies Inc.: Data-Driven Intelligence Platform
Palantir dominates with its software platforms that empower intelligence and operational agencies globally. Its revenue stems from platforms like Palantir Gotham and Foundry, which analyze vast datasets to uncover hidden patterns. In 2026, Palantir focuses on expanding its Artificial Intelligence Platform to integrate large language models, enhancing decision-making capabilities across sectors.
Akamai Technologies, Inc.: Cloud Security and Content Delivery Leader
Akamai excels in cloud services that secure and optimize internet content and applications. It generates revenue by protecting infrastructure from cyber threats and enhancing performance for web and mobile applications. Akamai’s 2026 strategy centers on expanding edge compute and cybersecurity solutions to support distributed computing demands and evolving digital threats.
Strategic Collision: Similarities & Divergences
Both companies operate in software infrastructure but diverge sharply in focus: Palantir emphasizes data intelligence and AI-driven analytics, while Akamai prioritizes cloud security and content delivery. Their primary battleground is enterprise digital transformation, where data insight meets secure, scalable delivery. Investors face distinct profiles: Palantir bets on cutting-edge AI integration, while Akamai anchors growth in resilient cloud operations.
Income Statement Comparison
This data dissects the core profitability and scalability of both corporate engines to reveal who dominates the bottom line:
| Metric | Palantir Technologies Inc. (PLTR) | Akamai Technologies, Inc. (AKAM) |
|---|---|---|
| Revenue | 4.48B | 3.99B |
| Cost of Revenue | 789M | 1.62B |
| Operating Expenses | 2.27B | 1.84B |
| Gross Profit | 3.69B | 2.37B |
| EBITDA | 1.41B | 1.26B |
| EBIT | 1.41B | 614M |
| Interest Expense | 0 | 27M |
| Net Income | 1.63B | 505M |
| EPS | 0.69 | 3.34 |
| Fiscal Year | 2025 | 2024 |
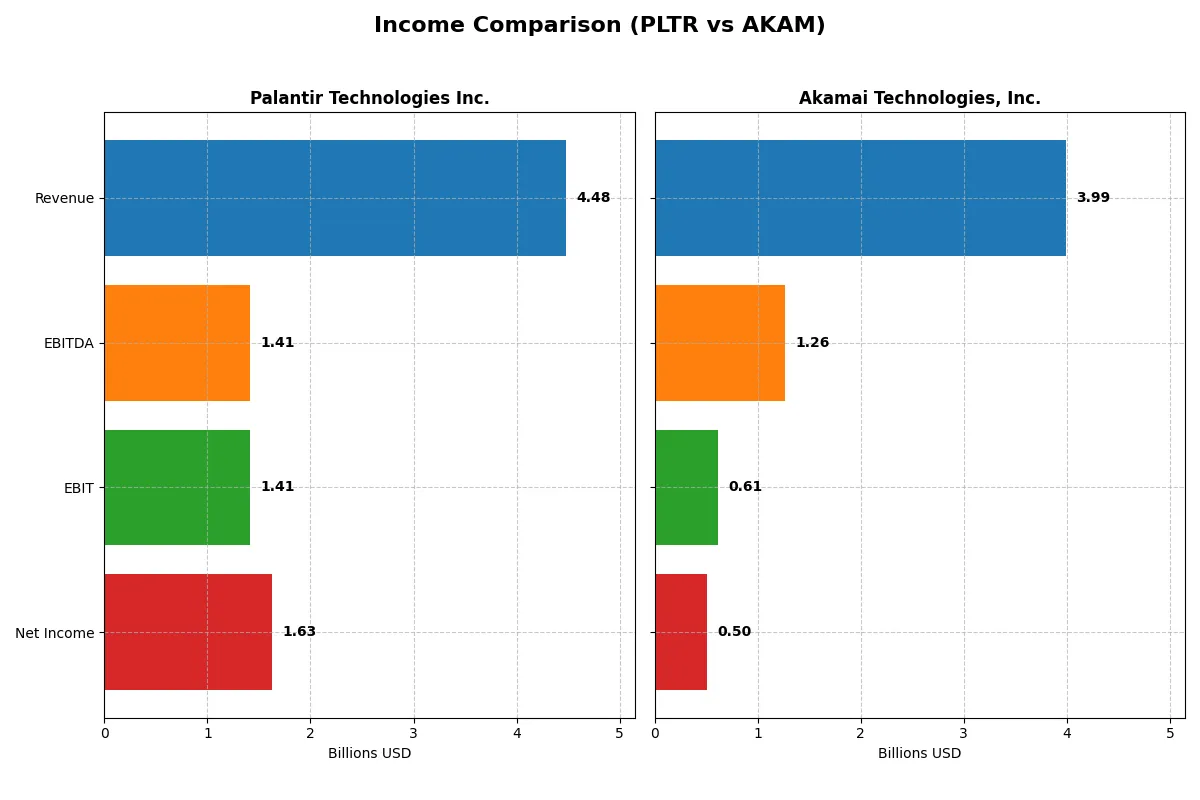
Income Statement Analysis: The Bottom-Line Duel
This income statement comparison reveals the true efficiency and profitability trajectory of Palantir Technologies and Akamai Technologies.
Palantir Technologies Inc. Analysis
Palantir’s revenue surged from 1.54B in 2021 to 4.48B in 2025, with net income reversing losses to reach 1.63B in 2025. Its gross margin expanded to an impressive 82.4%, while net margin climbed to 36.3%, reflecting stellar operational leverage and rapid scaling of profitability in the latest year.
Akamai Technologies, Inc. Analysis
Akamai’s revenue grew steadily from 3.20B in 2020 to 3.99B in 2024, but net income declined to 505M in 2024 from 652M in 2021. Gross margin remains healthy at 59.4%, yet net margin contracted to 12.6%, signaling margin compression and slower momentum in earnings growth compared to revenue gains.
Margin Power vs. Revenue Scale
Palantir clearly outperforms Akamai on growth velocity and margin expansion, delivering more than triple revenue growth and a net margin nearly three times higher in the latest year. Akamai’s steady revenue scale contrasts with its declining earnings and margins. Investors seeking rapid profit acceleration may find Palantir’s profile more compelling.
Financial Ratios Comparison
These vital ratios act as a diagnostic tool to expose the underlying fiscal health, valuation premiums, and capital efficiency of the companies compared below:
| Ratios | Palantir Technologies Inc. (PLTR) | Akamai Technologies, Inc. (AKAM) |
|---|---|---|
| ROE | 9.2% | 10.4% |
| ROIC | 5.5% | 4.7% |
| P/E | 368.2 | 28.7 |
| P/B | 34.0 | 3.0 |
| Current Ratio | 5.96 | 1.23 |
| Quick Ratio | 5.96 | 1.23 |
| D/E (Debt-to-Equity) | 0.048 | 0.95 |
| Debt-to-Assets | 3.8% | 44.7% |
| Interest Coverage | 0 | 19.7 |
| Asset Turnover | 0.45 | 0.38 |
| Fixed Asset Turnover | 11.9 | 1.33 |
| Payout Ratio | 0 | 0 |
| Dividend Yield | 0% | 0% |
| Fiscal Year | 2024 | 2024 |
Efficiency & Valuation Duel: The Vital Signs
Financial ratios act as a company’s DNA, exposing hidden risks and operational strengths critical for investment insights.
Palantir Technologies Inc.
Palantir shows a mixed profitability profile with a modest 9.2% ROE and a strong 16.1% net margin. Its valuation appears stretched, sporting a sky-high P/E of 368.2 and a lofty P/B of 34.01. Palantir does not pay dividends, instead reinvesting heavily in R&D, reflecting a growth-focused capital allocation.
Akamai Technologies, Inc.
Akamai delivers a slightly higher ROE of 10.4% but a lower net margin at 12.6%. Its valuation is more reasonable, with a P/E near 28.7 and a P/B of 2.97, implying better market pricing discipline. The company offers no dividend either, likely balancing shareholder returns with steady operational cash flow and manageable debt.
Premium Valuation vs. Operational Safety
Palantir’s valuation is significantly stretched relative to Akamai, despite comparable profitability metrics. Akamai offers a more balanced risk-reward profile with moderate leverage and valuation ratios. Investors seeking growth with caution may prefer Akamai’s steadier operational footing over Palantir’s aggressive expansion stance.
Which one offers the Superior Shareholder Reward?
Palantir Technologies (PLTR) and Akamai Technologies (AKAM) both skip dividends, focusing on reinvestment and buybacks. PLTR shows no dividend yield or payout but invests heavily in growth, supported by a robust free cash flow of $0.51 per share and an operating cash flow margin above 40%. However, PLTR’s sky-high P/E ratio (~368) signals richly valued growth expectations. Akamai trades at a modest 29 P/E with a free cash flow yield supported by a $5.5 free cash flow per share and a steady buyback program implied by strong operating cash flow coverage. AKAM’s lower leverage and sustainable capital return through buybacks offer a more balanced reward approach. I conclude Akamai delivers the superior total shareholder return profile in 2026 due to more sustainable capital allocation and reasonable valuation compared to Palantir’s growth-at-any-cost stance.
Comparative Score Analysis: The Strategic Profile
The radar chart reveals the fundamental DNA and trade-offs of Palantir Technologies Inc. and Akamai Technologies, Inc., highlighting their distinct financial strengths and vulnerabilities:
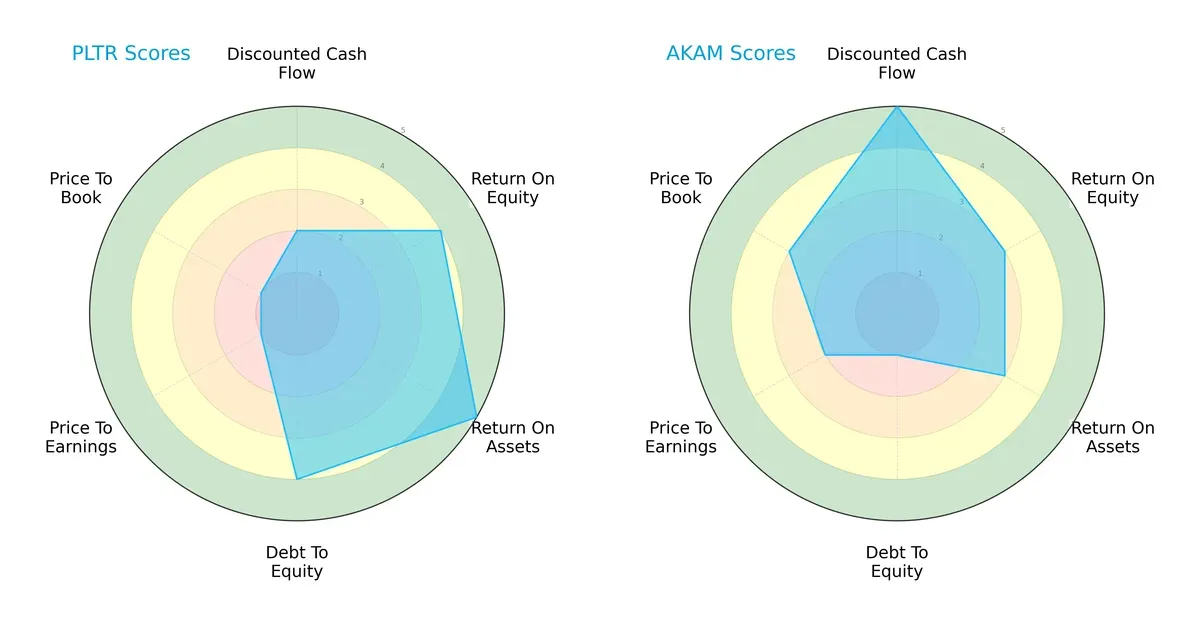
Palantir shows strength in ROE (4) and ROA (5), reflecting efficient profit generation and asset use. Akamai excels in discounted cash flow (5), indicating strong valuation support. However, Palantir’s valuation scores (PE/PB at 1) signal overvaluation risks, while Akamai’s weak debt-to-equity score (1) flags balance sheet leverage concerns. Overall, Palantir has a more balanced operational profile, whereas Akamai leans on its cash flow strength but carries financial risk.
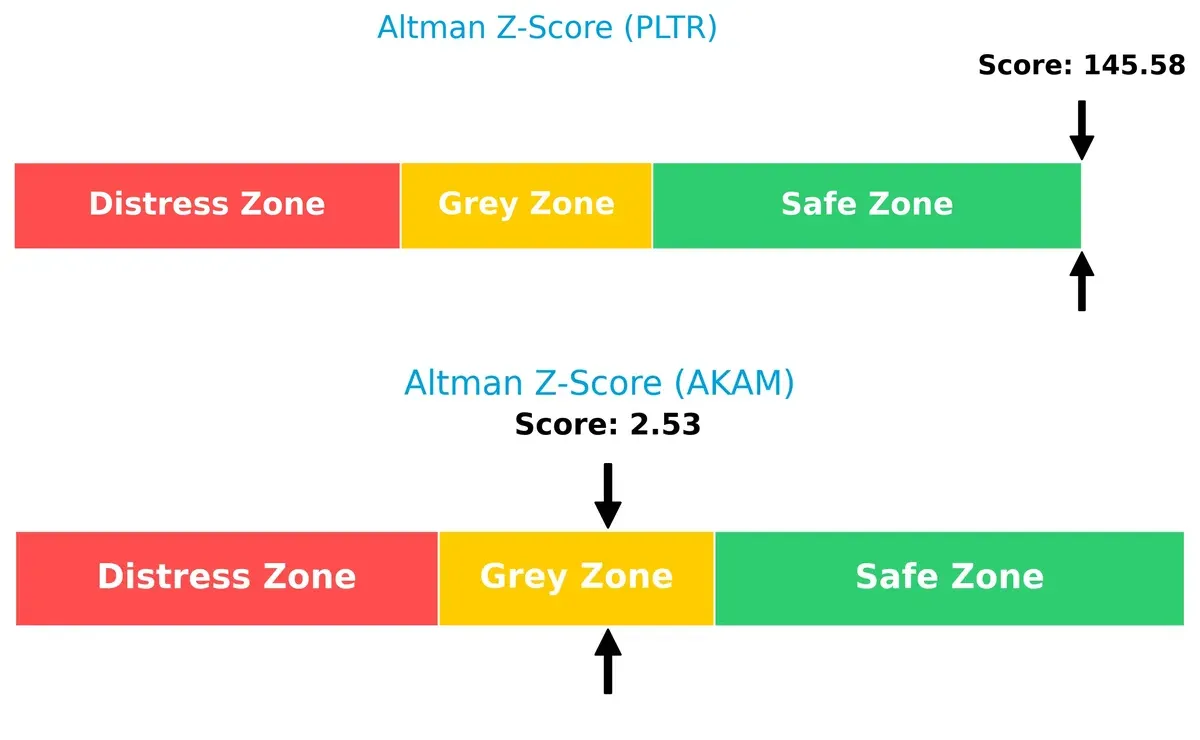
Bankruptcy Risk: Solvency Showdown
Palantir’s Altman Z-Score (145.6) far surpasses Akamai’s (2.53), placing it securely in the safe zone versus Akamai’s grey zone, implying stronger long-term solvency and resilience in this cycle:
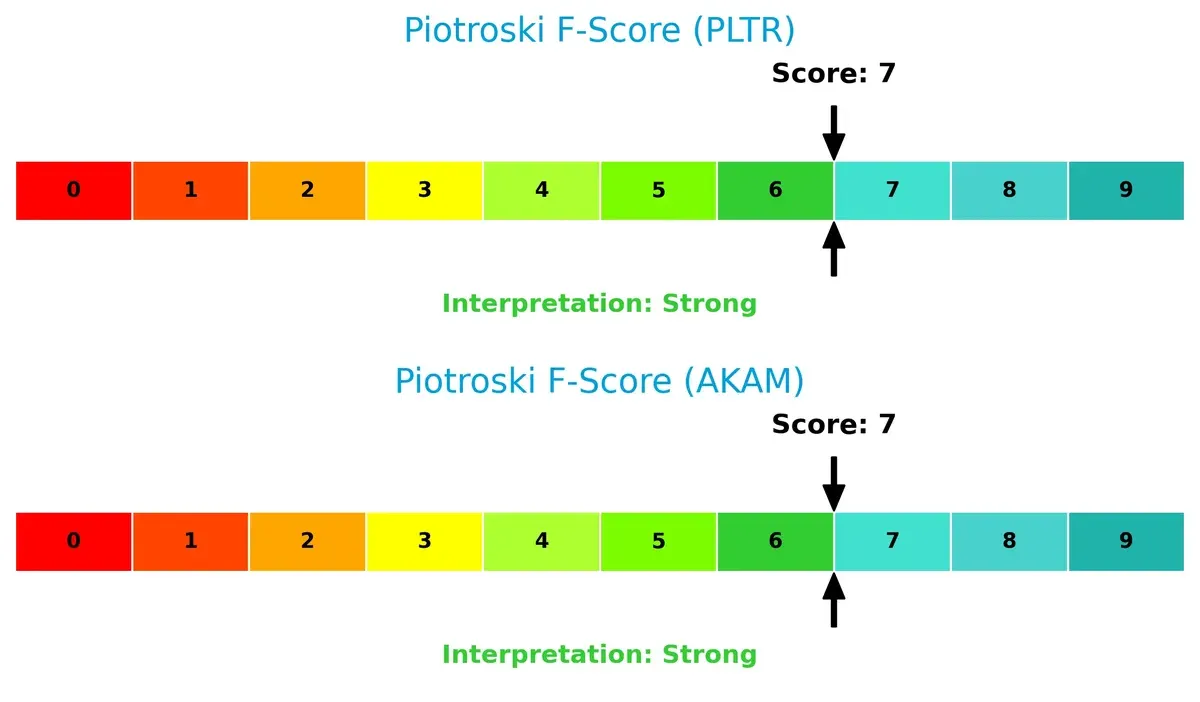
Financial Health: Quality of Operations
Both companies score a solid 7 on the Piotroski F-Score, indicating strong financial health. Neither shows red flags, but this parity suggests investors should weigh other factors for differentiation:
How are the two companies positioned?
This section dissects Palantir and Akamai’s operational DNA by comparing their revenue distribution by segment and analyzing their internal strengths and weaknesses. The goal is to confront their economic moats and identify which business model delivers the most resilient, sustainable competitive advantage today.
Revenue Segmentation: The Strategic Mix
This visual comparison dissects how Palantir Technologies and Akamai diversify their income streams and where their primary sector bets lie:
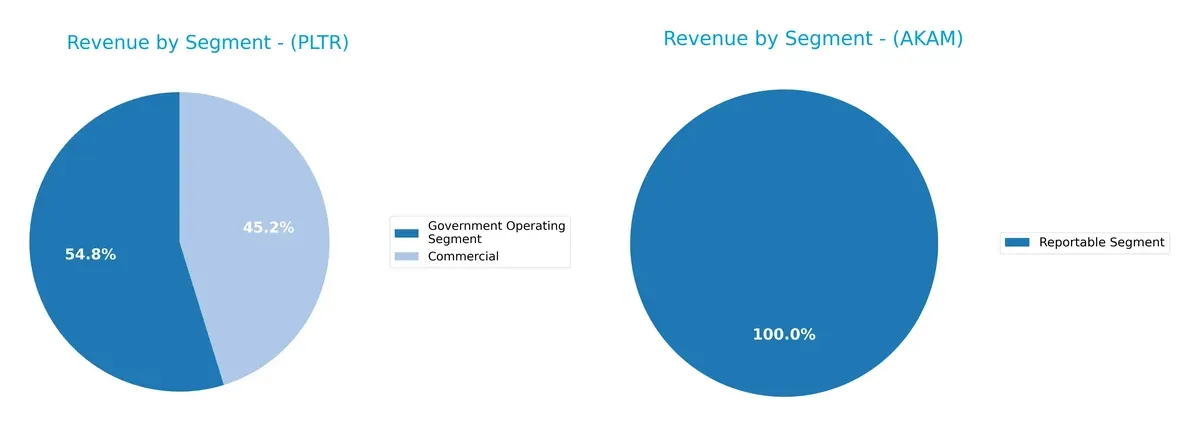
Palantir anchors its revenue in two distinct segments: Government Operating ($1.57B) and Commercial ($1.30B) for 2024, showing moderate diversification. Akamai, by contrast, reports a single $3.99B segment, indicating a concentrated revenue base. Palantir’s split suggests strategic bets on government and enterprise ecosystems, reducing concentration risk. Akamai’s focus may leverage infrastructure dominance but risks sector-specific volatility without notable diversification.
Strengths and Weaknesses Comparison
This table compares the Strengths and Weaknesses of Palantir Technologies Inc. (PLTR) and Akamai Technologies, Inc. (AKAM):
PLTR Strengths
- High net margin at 16.13%
- Strong quick ratio at 5.96
- Low debt to assets at 3.77%
- Favorable fixed asset turnover of 11.92
- Growing commercial and government revenues
- Broad geographic presence including US, UK, and Rest of World
AKAM Strengths
- Solid net margin at 12.65%
- Favorable weighted average cost of capital at 6.28%
- Strong interest coverage at 22.65
- Balanced US and Non-US revenue streams
- Moderate debt levels with neutral debt to assets
- Stable dividend yield of 0% consistent with tech sector norms
PLTR Weaknesses
- Unfavorable high PE ratio at 368.2
- High PB ratio at 34.01
- Unfavorable current ratio at 5.96 despite quick ratio strength
- Low ROE at 9.24%
- Unfavorable asset turnover at 0.45
- No dividend yield
AKAM Weaknesses
- Unfavorable PE ratio at 28.68
- Unfavorable ROIC at 4.74% below WACC
- Neutral current ratio at 1.23 limits liquidity cushion
- Unfavorable asset turnover at 0.38
- No dividend yield
- Moderate debt-to-equity ratio at 0.95 increases leverage risk
Overall, PLTR shows strengths in profitability metrics and asset efficiency but faces valuation and equity return challenges. AKAM balances profitability with capital cost advantages but contends with weaker returns on invested capital and moderate leverage. Both companies exhibit neutral global ratio opinions, signaling balanced financial profiles with distinct structural trade-offs influencing their strategic options.
The Moat Duel: Analyzing Competitive Defensibility
A structural moat is the only true shield protecting long-term profits from relentless competition erosion. Let’s dissect how these firms defend their turf:
Palantir Technologies Inc.: Data Network and Intangible Asset Moat
Palantir’s edge lies in its proprietary data integration platforms and AI capabilities. High 36% net margins and 56% revenue growth reveal robust switching costs. Its expanding AI platform deepens the moat in 2026.
Akamai Technologies, Inc.: Cost Advantage and Scale Moat
Akamai competes through global content delivery infrastructure and economies of scale, but shrinking ROIC and 12.6% net margin signal margin pressure. Its future depends on edge computing expansion against rising competition.
Verdict: Proprietary AI Platforms vs. Infrastructure Scale
Palantir’s growing ROIC and explosive growth signal a deeper, more durable moat than Akamai’s shrinking profitability. Palantir is better positioned to defend market share in a data-driven future.
Which stock offers better returns?
The past year shows Palantir’s stock surging sharply, while Akamai’s price declined overall despite a recent rebound, highlighting contrasting trading dynamics and momentum shifts.
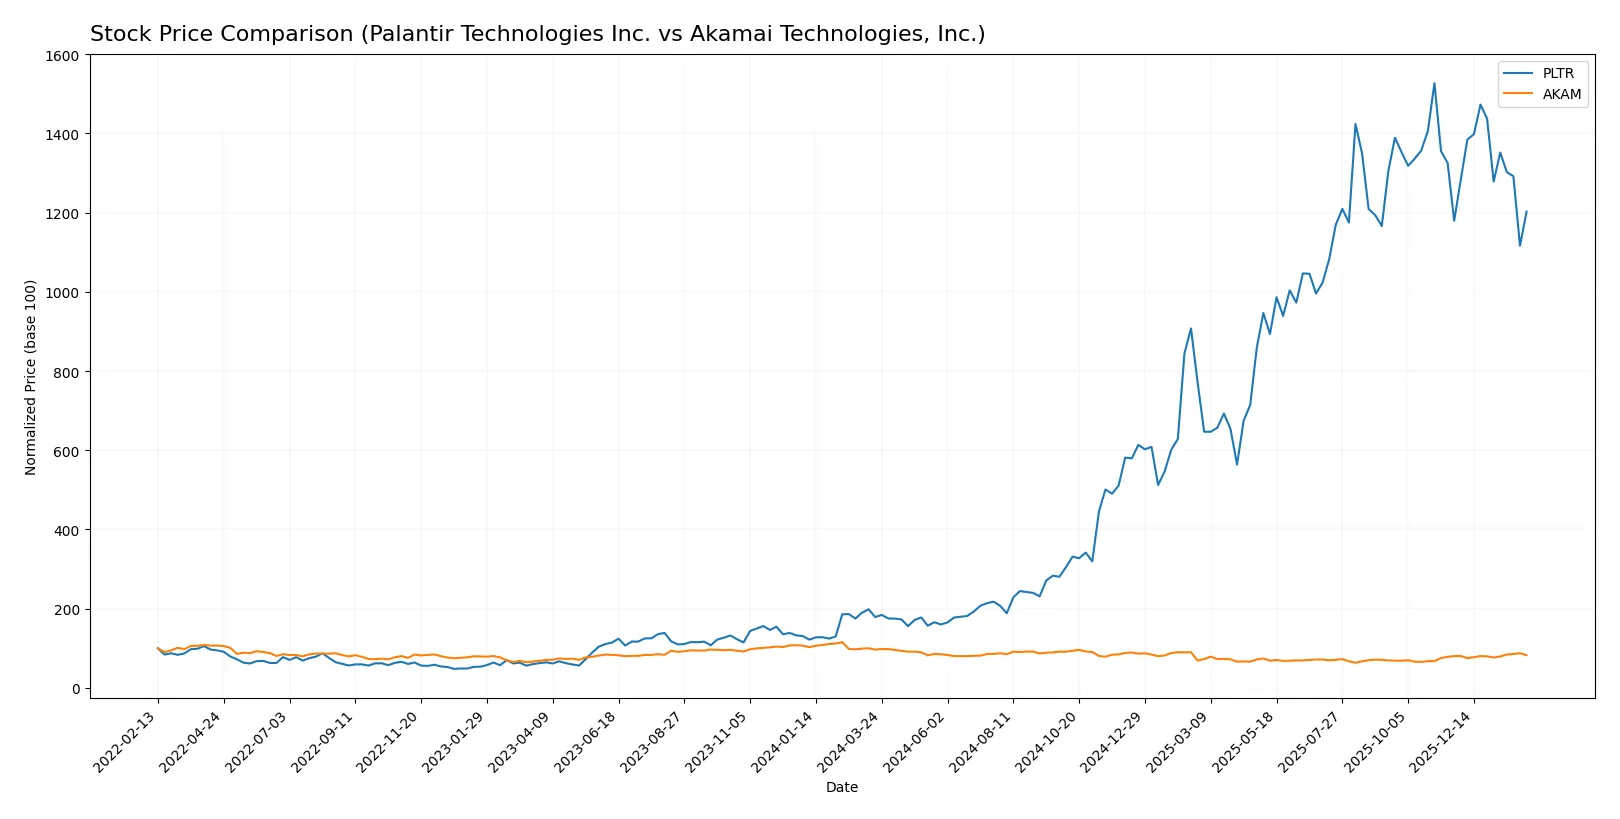
Trend Comparison
Palantir Technologies Inc. displays a strong bullish trend over 12 months with a 572.12% price increase, but the trend shows deceleration. The stock ranged from 20.47 to 200.47, with high volatility (std. dev. 59.72).
Akamai Technologies, Inc. reveals a bearish trend with a 14.41% decline over the same period, though recent months show a modest 3.12% recovery and accelerating momentum. Price volatility is lower (std. dev. 10.37).
Palantir’s 12-month return significantly outpaces Akamai’s, delivering the highest market performance despite recent trend slowing. Akamai’s recent gains remain insufficient to offset its year-long losses.
Target Prices
Analysts present a clear consensus on target prices for Palantir Technologies Inc. and Akamai Technologies, Inc.
| Company | Target Low | Target High | Consensus |
|---|---|---|---|
| Palantir Technologies Inc. | 180 | 230 | 198.8 |
| Akamai Technologies, Inc. | 89 | 115 | 104.8 |
The consensus targets suggest Palantir could appreciate 26% from its current 158 price, while Akamai shows a 14% upside from 92. Analysts expect moderate growth but remain cautious amid sector volatility.

Don’t Let Luck Decide Your Entry Point
Optimize your entry points with our advanced ProRealTime indicators. You’ll get efficient buy signals with precise price targets for maximum performance. Start outperforming now!
How do institutions grade them?
Here is a comparison of recent institutional grades for Palantir Technologies Inc. and Akamai Technologies, Inc.:
Palantir Technologies Inc. Grades
The table below shows the latest grades assigned by reputable financial institutions:
| Grading Company | Action | New Grade | Date |
|---|---|---|---|
| UBS | Maintain | Neutral | 2026-02-03 |
| Citigroup | Maintain | Buy | 2026-02-03 |
| DA Davidson | Maintain | Neutral | 2026-02-03 |
| Citigroup | Upgrade | Buy | 2026-01-12 |
| Cantor Fitzgerald | Maintain | Neutral | 2025-11-04 |
| Goldman Sachs | Maintain | Neutral | 2025-11-04 |
| DA Davidson | Maintain | Neutral | 2025-11-04 |
| B of A Securities | Maintain | Buy | 2025-11-04 |
| Morgan Stanley | Maintain | Equal Weight | 2025-11-04 |
| Baird | Maintain | Neutral | 2025-11-04 |
Akamai Technologies, Inc. Grades
The table below presents recent grades from verified grading firms:
| Grading Company | Action | New Grade | Date |
|---|---|---|---|
| Citigroup | Maintain | Neutral | 2026-01-16 |
| Morgan Stanley | Upgrade | Overweight | 2026-01-12 |
| Scotiabank | Maintain | Sector Outperform | 2026-01-09 |
| RBC Capital | Maintain | Sector Perform | 2026-01-05 |
| Piper Sandler | Maintain | Neutral | 2026-01-05 |
| Keybanc | Upgrade | Overweight | 2025-12-15 |
| TD Cowen | Maintain | Hold | 2025-11-13 |
| Citigroup | Maintain | Neutral | 2025-11-11 |
| Scotiabank | Maintain | Sector Outperform | 2025-11-07 |
| Piper Sandler | Maintain | Neutral | 2025-11-07 |
Which company has the best grades?
Akamai Technologies shows a stronger rating trend with multiple upgrades to Overweight and consistent Sector Outperform grades. Palantir maintains mostly Neutral grades with some Buy ratings but lacks recent upgrades. This suggests Akamai currently enjoys higher institutional confidence, potentially influencing investor sentiment positively.
Risks specific to each company
The following categories identify the critical pressure points and systemic threats facing both firms in the 2026 market environment:
1. Market & Competition
Palantir Technologies Inc.
- Faces fierce competition in software infrastructure with a high valuation multiple raising expectations.
Akamai Technologies, Inc.
- Competes in cloud security and content delivery with steady but slower growth and moderate valuation.
2. Capital Structure & Debt
Palantir Technologies Inc.
- Maintains a very low debt-to-equity ratio (0.05), reflecting conservative leverage.
Akamai Technologies, Inc.
- Carries high debt-to-equity (0.95), increasing financial risk despite solid interest coverage.
3. Stock Volatility
Palantir Technologies Inc.
- Exhibits high beta (1.687), indicating greater price volatility and risk.
Akamai Technologies, Inc.
- Demonstrates lower beta (0.723), suggesting more stable stock performance.
4. Regulatory & Legal
Palantir Technologies Inc.
- Operates in sensitive government intelligence sectors, exposing it to complex regulatory scrutiny.
Akamai Technologies, Inc.
- Faces standard technology sector regulations, with less exposure to sensitive government contracts.
5. Supply Chain & Operations
Palantir Technologies Inc.
- Relies on software deployment flexibility, minimizing physical supply chain risks.
Akamai Technologies, Inc.
- Depends on global cloud infrastructure, vulnerable to operational disruptions and cyber threats.
6. ESG & Climate Transition
Palantir Technologies Inc.
- ESG metrics less disclosed, potential risks tied to data privacy and ethical AI use.
Akamai Technologies, Inc.
- Increasing focus on sustainable cloud solutions, improving ESG profile progressively.
7. Geopolitical Exposure
Palantir Technologies Inc.
- Significant exposure to U.S. and allied governments’ geopolitical policies affecting defense contracts.
Akamai Technologies, Inc.
- More diversified global footprint but sensitive to international data sovereignty laws.
Which company shows a better risk-adjusted profile?
Palantir’s most impactful risk is its high stock volatility paired with elevated valuation multiples, heightening market sensitivity. Akamai’s largest risk lies in its elevated debt load, which could strain financial flexibility amid market shifts. Considering risk-adjusted profiles, Akamai’s stable stock and moderate valuation present a safer investment, but its leverage demands caution. Palantir shows strong financial health but requires tolerance for volatility and regulatory complexity. The recent surge in Palantir’s trading volume highlights growing investor speculation, underscoring heightened risk.
Final Verdict: Which stock to choose?
Palantir Technologies impresses with its superpower of rapid growth and efficiency in scaling high-margin software solutions. Its expanding ROIC and strong income growth highlight value creation, but its sky-high valuation and stretched liquidity ratios demand caution. It suits portfolios chasing aggressive growth and innovation.
Akamai Technologies boasts a strategic moat rooted in its cloud infrastructure and steady recurring revenue. It offers a safer profile with moderate profitability and solid cash flow, though declining ROIC signals weakening competitive advantage. It fits well with investors favoring GARP—growth at a reasonable price.
If you prioritize high-growth potential and can tolerate valuation risk, Palantir outshines with accelerating profitability and expanding capital returns. However, if you seek better stability and a more defensive stance, Akamai offers a proven moat and consistent cash generation despite recent headwinds. Both present analytical scenarios tailored to distinct investor profiles.
Disclaimer: Investment carries a risk of loss of initial capital. The past performance is not a reliable indicator of future results. Be sure to understand risks before making an investment decision.
Go Further
I encourage you to read the complete analyses of Palantir Technologies Inc. and Akamai Technologies, Inc. to enhance your investment decisions: