In the fast-evolving technology sector, Oracle Corporation and Akamai Technologies stand out as key players in software infrastructure. Oracle excels in cloud-based enterprise solutions and database technologies, while Akamai specializes in cloud security and content delivery networks. Both companies innovate to meet growing digital demands, making them worthy of comparison. Join me as we explore which company offers the most compelling opportunity for investors today.

Table of contents
Companies Overview
I will begin the comparison between Oracle and Akamai by providing an overview of these two companies and their main differences.
Oracle Overview
Oracle Corporation focuses on delivering enterprise IT solutions globally, specializing in cloud software applications such as ERP, supply chain, and human capital management. It also offers a broad range of infrastructure technologies including databases, middleware, and hardware products. With a market cap of 549B USD and 159K employees, Oracle serves various industries, government, and education sectors from its headquarters in Austin, Texas.
Akamai Overview
Akamai Technologies provides cloud services aimed at securing, delivering, and optimizing internet content and applications worldwide. Its offerings include cybersecurity, media delivery, edge computing, and performance solutions for web and mobile platforms. Akamai operates with a market cap of 13.4B USD and employs over 10.8K people, headquartered in Cambridge, Massachusetts, with a strong focus on cloud infrastructure and online threat protection.
Key similarities and differences
Both Oracle and Akamai operate in the software infrastructure industry with a focus on cloud solutions. Oracle emphasizes broad enterprise IT applications and infrastructure technologies, while Akamai specializes in cloud security, content delivery, and edge computing. Oracle’s workforce and market cap are significantly larger, reflecting its extensive product range and market reach compared to Akamai’s more niche cloud service offerings.
Income Statement Comparison
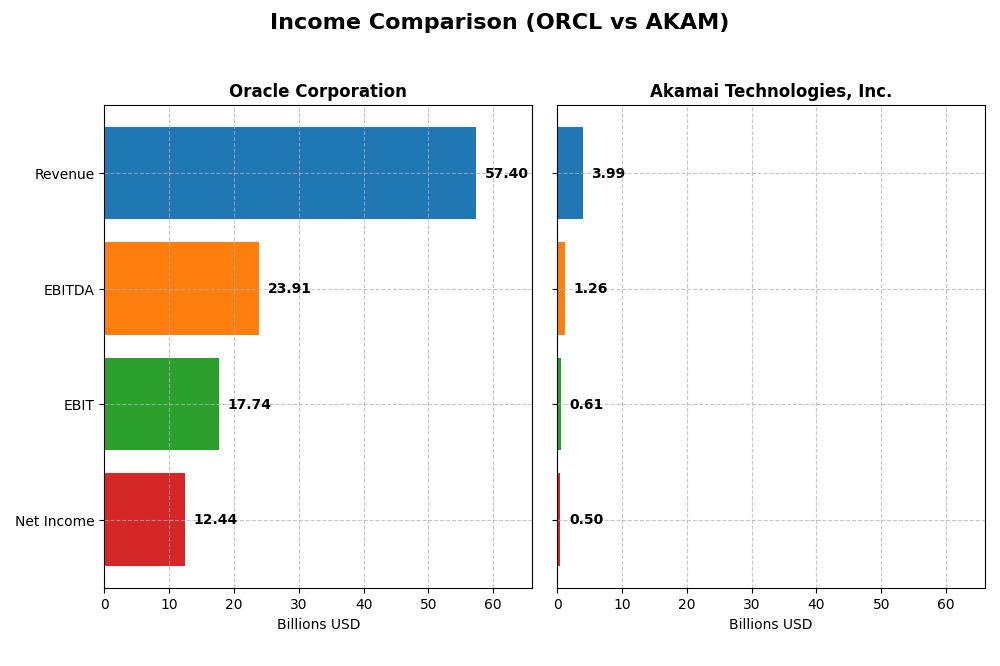
This table provides a clear comparison of key income statement metrics for Oracle Corporation and Akamai Technologies, Inc. for their most recent fiscal years.
| Metric | Oracle Corporation | Akamai Technologies, Inc. |
|---|---|---|
| Market Cap | 549B | 13.4B |
| Revenue | 57.4B | 4.0B |
| EBITDA | 23.9B | 1.26B |
| EBIT | 17.7B | 614M |
| Net Income | 12.4B | 505M |
| EPS | 4.46 | 3.34 |
| Fiscal Year | 2025 | 2024 |
Income Statement Interpretations
Oracle Corporation
Oracle’s revenue increased steadily from 40.5B in 2021 to 57.4B in 2025, reflecting an overall favorable growth trend. Net income fluctuated, peaking at 13.7B in 2021 before declining to 12.4B in 2025, showing some instability. Margins remained strong with a gross margin above 70% and net margin near 21.7% in the latest year, indicating improved profitability and efficient cost control in 2025.
Akamai Technologies, Inc.
Akamai’s revenue rose from 3.2B in 2020 to 4.0B in 2024, marking moderate growth, while net income declined from 557M to 505M over the same period. Margins were favorable but thinner than Oracle’s, with a gross margin around 59.4% and net margin at 12.7% in 2024. Recent performance showed slowed growth and deteriorating net margin, signaling challenges in sustaining profitability.
Which one has the stronger fundamentals?
Oracle demonstrates stronger fundamentals with higher and improving margins, robust revenue growth, and favorable EBIT and net margin improvements in the latest year. Conversely, Akamai faces margin compression and declining net income despite revenue growth. Oracle’s overall income statement evaluation is favorable, whereas Akamai’s is unfavorable, reflecting a clearer financial strength for Oracle.
Financial Ratios Comparison
The table below presents a side-by-side comparison of key financial ratios for Oracle Corporation (ORCL) and Akamai Technologies, Inc. (AKAM) based on their most recent fiscal year data.
| Ratios | Oracle Corporation (2025) | Akamai Technologies, Inc. (2024) |
|---|---|---|
| ROE | 60.8% | 10.4% |
| ROIC | 10.9% | 4.7% |
| P/E | 37.1 | 28.7 |
| P/B | 22.6 | 3.0 |
| Current Ratio | 0.75 | 1.23 |
| Quick Ratio | 0.75 | 1.23 |
| D/E | 5.09 | 0.95 |
| Debt-to-Assets | 61.8% | 44.7% |
| Interest Coverage | 4.94 | 19.7 |
| Asset Turnover | 0.34 | 0.38 |
| Fixed Asset Turnover | 1.32 | 1.33 |
| Payout ratio | 38.1% | 0% |
| Dividend yield | 1.03% | 0% |
Interpretation of the Ratios
Oracle Corporation
Oracle shows strong profitability with a net margin of 21.68% and an impressive return on equity (ROE) of 60.84%, indicating efficient use of equity capital. However, several liquidity and leverage ratios are unfavorable, including a low current ratio of 0.75 and a high debt-to-equity ratio of 5.09, suggesting potential financial risk. Oracle pays a dividend with a moderate yield of 1.03%, supported by stable payouts, though some leverage concerns could affect sustainability.
Akamai Technologies, Inc.
Akamai presents a moderate net margin of 12.65% and a neutral ROE of 10.35%, reflecting average profitability. It benefits from a favorable weighted average cost of capital (WACC) at 6.14% and strong interest coverage of 22.65, indicating good debt service capacity. Akamai does not pay dividends, likely prioritizing reinvestment and growth strategies, supported by a neutral to favorable liquidity profile with a current ratio of 1.23.
Which one has the best ratios?
Akamai’s ratio profile is more balanced with a neutral overall opinion, combining favorable liquidity and debt service metrics with moderate profitability. In contrast, Oracle displays stronger profitability metrics but suffers from multiple unfavorable liquidity and leverage ratios, leading to an overall unfavorable assessment. Thus, Akamai’s ratios currently reflect a more stable financial position despite lower earnings returns.
Strategic Positioning
This section compares the strategic positioning of Oracle Corporation and Akamai Technologies across Market position, Key segments, and Exposure to technological disruption:
Oracle Corporation
- Large market cap of 549B; faces competitive pressure in enterprise IT
- Focuses on cloud and license business (49B), hardware (2.9B), services (5.2B)
- Exposed to cloud infrastructure and enterprise software disruption
Akamai Technologies, Inc.
- Smaller market cap of 13.4B; competes in cloud security and delivery
- Concentrated on cloud services for security, content delivery, and edge computing
- Faces disruption from evolving internet security and edge computing tech
Oracle Corporation vs Akamai Technologies, Inc. Positioning
Oracle has a diversified business model spanning cloud, hardware, and services with significant scale, while Akamai is more concentrated on cloud security and content delivery. Oracle’s broad segments offer revenue stability; Akamai’s focus targets emerging internet performance needs but with less scale.
Which has the best competitive advantage?
Both companies are currently shedding value with declining ROIC trends. Oracle’s position is slightly unfavorable but more stable, whereas Akamai’s very unfavorable MOAT indicates greater challenges in maintaining competitive advantage.
Stock Comparison
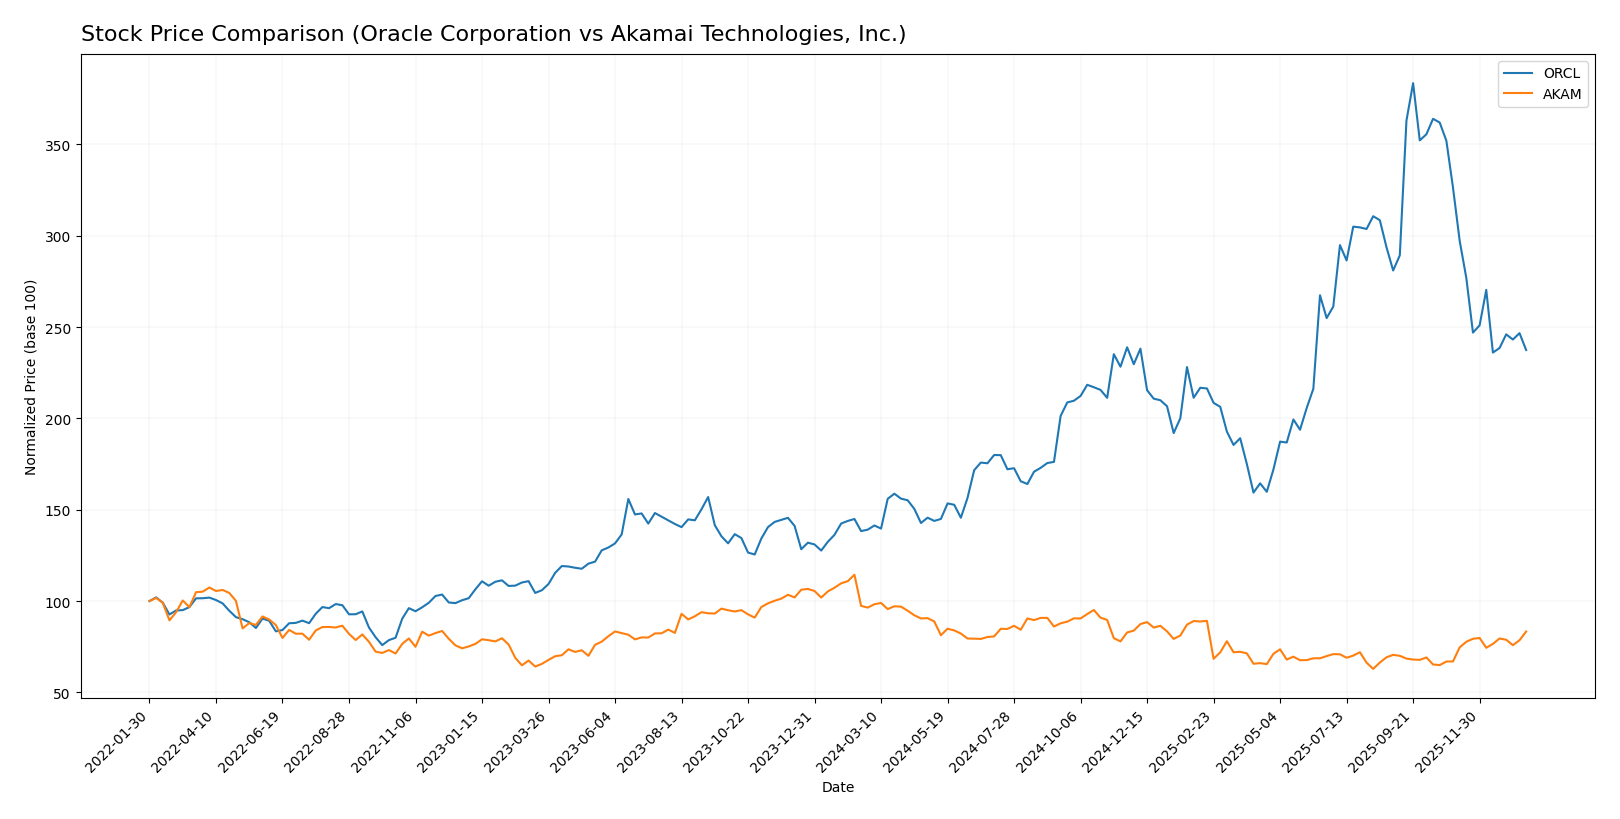
The stock price chart over the past year reveals Oracle Corporation’s substantial 70.69% gain with decelerating bullish momentum, contrasted by Akamai Technologies, Inc.’s 13.57% decline amid accelerating bearish pressure and recent recovery signs.
Trend Analysis
Oracle Corporation’s stock shows a bullish trend over the last 12 months with a 70.69% price increase, though recent months indicate a deceleration and a short-term drop of 27.23%. Volatility remains high with a 49.0 std deviation.
Akamai Technologies, Inc. displays a bearish trend with a 13.57% decline over the past year, despite accelerating downward momentum. Recently, it experienced a 24.49% price rise, suggesting early recovery signs amid lower volatility (std deviation 10.92).
Comparing trends, Oracle delivered the highest market performance with a strong overall gain, while Akamai’s stock underperformed but shows potential stabilization in the latest period.
Target Prices
The current analyst consensus suggests substantial upside potential for both Oracle Corporation and Akamai Technologies, Inc.
| Company | Target High | Target Low | Consensus |
|---|---|---|---|
| Oracle Corporation | 400 | 175 | 314.08 |
| Akamai Technologies, Inc. | 115 | 89 | 104.8 |
Oracle’s consensus target price of 314.08 USD indicates a significant premium over its current price of 191.09 USD, reflecting optimism about growth. Akamai’s consensus target of 104.8 USD also suggests upside from its current price of 93.49 USD, implying moderate appreciation potential.
Analyst Opinions Comparison
This section compares analysts’ ratings and grades for Oracle Corporation and Akamai Technologies, Inc.:
Rating Comparison
Oracle Corporation Rating
- Rating: B, considered Very Favorable overall.
- Discounted Cash Flow Score: 3, indicating a moderate valuation outlook.
- ROE Score: 5, reflecting very favorable efficiency in generating equity returns.
- ROA Score: 4, showing favorable asset utilization for earnings.
- Debt To Equity Score: 1, signaling very unfavorable financial risk profile.
- Overall Score: 3, a moderate overall financial standing.
Akamai Technologies, Inc. Rating
- Rating: B, considered Very Favorable overall.
- Discounted Cash Flow Score: 5, indicating a very favorable valuation.
- ROE Score: 3, indicating moderate efficiency in generating equity returns.
- ROA Score: 3, reflecting moderate asset utilization.
- Debt To Equity Score: 1, also signaling very unfavorable financial risk.
- Overall Score: 3, a moderate overall financial standing.
Which one is the best rated?
Both companies share the same overall rating and score of B and 3, respectively. Oracle excels in ROE and ROA, while Akamai leads in discounted cash flow, but both exhibit equally unfavorable debt-to-equity scores.
Scores Comparison
Here is a comparison of the financial scores for Oracle Corporation and Akamai Technologies, Inc.:
ORCL Scores
- Altman Z-Score: 2.43, places the company in the grey zone with moderate bankruptcy risk.
- Piotroski Score: 5, indicating average financial strength.
AKAM Scores
- Altman Z-Score: 2.46, places the company in the grey zone with moderate bankruptcy risk.
- Piotroski Score: 7, indicating strong financial strength.
Which company has the best scores?
Both companies have a similar Altman Z-Score in the grey zone, showing moderate bankruptcy risk. However, Akamai’s Piotroski Score of 7 is stronger than Oracle’s score of 5, reflecting better financial health based on this metric.
Grades Comparison
The grades provided by leading financial institutions for Oracle Corporation and Akamai Technologies, Inc. are as follows:
Oracle Corporation Grades
This table summarizes recent grades from reputable financial firms for Oracle Corporation:
| Grading Company | Action | New Grade | Date |
|---|---|---|---|
| UBS | Maintain | Buy | 2026-01-05 |
| RBC Capital | Maintain | Sector Perform | 2026-01-05 |
| Jefferies | Maintain | Buy | 2026-01-05 |
| Goldman Sachs | Maintain | Neutral | 2025-12-12 |
| Keybanc | Maintain | Overweight | 2025-12-11 |
| UBS | Maintain | Buy | 2025-12-11 |
| Citigroup | Maintain | Buy | 2025-12-11 |
| JP Morgan | Maintain | Neutral | 2025-12-11 |
| DA Davidson | Maintain | Neutral | 2025-12-11 |
| Scotiabank | Maintain | Sector Outperform | 2025-12-11 |
Overall, Oracle’s grades predominantly show a positive consensus with multiple “Buy” and “Overweight” ratings, alongside some “Neutral” and “Sector Perform” assessments.
Akamai Technologies, Inc. Grades
This table summarizes recent grades from reputable financial firms for Akamai Technologies, Inc.:
| Grading Company | Action | New Grade | Date |
|---|---|---|---|
| Citigroup | Maintain | Neutral | 2026-01-16 |
| Morgan Stanley | Upgrade | Overweight | 2026-01-12 |
| Scotiabank | Maintain | Sector Outperform | 2026-01-09 |
| RBC Capital | Maintain | Sector Perform | 2026-01-05 |
| Piper Sandler | Maintain | Neutral | 2026-01-05 |
| Keybanc | Upgrade | Overweight | 2025-12-15 |
| TD Cowen | Maintain | Hold | 2025-11-13 |
| Citigroup | Maintain | Neutral | 2025-11-11 |
| Scotiabank | Maintain | Sector Outperform | 2025-11-07 |
| Piper Sandler | Maintain | Neutral | 2025-11-07 |
Akamai’s grades show a mixed trend with upgrades to “Overweight” and consistent “Neutral” and “Sector Outperform” ratings, reflecting moderate confidence among analysts.
Which company has the best grades?
Oracle Corporation holds a stronger overall grading profile with a consensus “Buy” and more frequent positive ratings like “Buy” and “Overweight.” Akamai’s consensus is “Hold,” with several “Neutral” ratings and recent upgrades. This difference may influence investors’ perception of growth potential and risk, impacting portfolio decisions.
Strengths and Weaknesses
Below is a comparison of key strengths and weaknesses for Oracle Corporation and Akamai Technologies, Inc. based on the most recent financial and operational data.
| Criterion | Oracle Corporation (ORCL) | Akamai Technologies, Inc. (AKAM) |
|---|---|---|
| Diversification | Strong diversification: Cloud & License $49.2B, Services $5.2B, Hardware $2.9B (2025) | Limited diversification: single reportable segment $4.0B (2024) |
| Profitability | High profitability: Net margin 21.7%, ROE 60.8%, ROIC 10.9% (2025) | Moderate profitability: Net margin 12.7%, ROE 10.4%, ROIC 4.7% (2024) |
| Innovation | Moderate innovation: Declining ROIC trend, slightly unfavorable moat | Lower innovation impact: Declining ROIC trend, very unfavorable moat |
| Global presence | Extensive global presence with diverse product lines worldwide | Global presence focused on content delivery and cloud services |
| Market Share | Large market share in enterprise software and cloud markets | Niche market share in content delivery and security services |
Key takeaways: Oracle shows strong diversification and superior profitability but faces challenges with declining returns on invested capital. Akamai maintains a solid niche presence with moderate profitability but struggles with value creation and innovation momentum. Caution is advised due to declining ROIC trends in both companies.
Risk Analysis
The table below summarizes key risks for Oracle Corporation and Akamai Technologies as of the most recent fiscal years:
| Metric | Oracle Corporation (ORCL) | Akamai Technologies, Inc. (AKAM) |
|---|---|---|
| Market Risk | High beta (1.65) indicates elevated sensitivity to market swings. | Lower beta (0.69) suggests less volatility relative to the market. |
| Debt level | High debt-to-equity (5.09) and debt-to-assets (61.8%) ratios imply significant leverage. | Moderate debt-to-equity (0.95) and debt-to-assets (44.7%) ratios show balanced leverage. |
| Regulatory Risk | Moderate, given global IT regulations and data privacy laws impacting cloud and software services. | Moderate, with exposure to cybersecurity and data handling regulations worldwide. |
| Operational Risk | Large scale operations (159K employees) may face integration and execution challenges. | Smaller workforce (10.8K) but dependent on high-tech infrastructure and service reliability. |
| Environmental Risk | Moderate, with increasing pressure on data centers to reduce carbon footprint. | Moderate, as network infrastructure energy use faces scrutiny. |
| Geopolitical Risk | Exposure through global client base and supply chains; heightened US-China tech tensions may impact. | Similarly exposed to geopolitical uncertainties affecting internet infrastructure and cloud services. |
Oracle’s most impactful risks stem from its high financial leverage and market sensitivity, increasing vulnerability during economic downturns. Akamai benefits from lower leverage and volatility but must manage operational reliance on cutting-edge, secure technology amid regulatory and geopolitical challenges. Both companies fall into a moderate risk category but require vigilance in debt management and regulatory compliance.
Which Stock to Choose?
Oracle Corporation (ORCL) shows a favorable income statement with 8.38% revenue growth in 2025 and strong profitability ratios like a 21.68% net margin and 60.84% ROE, but it faces unfavorable debt metrics and a slightly unfavorable moat due to declining ROIC versus WACC. Its overall financial ratios appear mostly unfavorable, and it holds a very favorable rating with a moderate overall score.
Akamai Technologies, Inc. (AKAM) presents a neutral global ratios opinion and a less favorable income statement with declining net margin and EPS growth. Its profitability is moderate, with a 12.65% net margin and 10.35% ROE, supported by a favorable WACC and interest coverage, but the moat evaluation is very unfavorable. AKAM’s rating is also very favorable, with moderate overall scores and a strong Piotroski score.
Investors focused on growth and strong profitability metrics might find Oracle’s favorable income and rating attractive, despite its leverage concerns and slightly unfavorable moat. Meanwhile, those valuing financial stability and moderate risk could see Akamai’s neutral ratios and strong financial health scores as more suitable, though its declining profitability and very unfavorable moat require caution.
Disclaimer: Investment carries a risk of loss of initial capital. The past performance is not a reliable indicator of future results. Be sure to understand risks before making an investment decision.
Go Further
I encourage you to read the complete analyses of Oracle Corporation and Akamai Technologies, Inc. to enhance your investment decisions: