In today’s rapidly evolving technology landscape, Okta, Inc. and Akamai Technologies, Inc. stand out as key players in the software infrastructure sector. Both companies focus on cybersecurity and cloud-based solutions, serving a broad range of industries with innovative strategies to protect and optimize digital assets. This article will explore their strengths and challenges, helping you decide which company holds the most promise for your investment portfolio.

Table of contents
Companies Overview
I will begin the comparison between Okta and Akamai by providing an overview of these two companies and their main differences.
Okta Overview
Okta, Inc. focuses on providing identity solutions to enterprises, small and medium-sized businesses, and government agencies worldwide. Its flagship product, Okta Identity Cloud, offers a comprehensive suite including Single Sign-On, Adaptive Multi-Factor Authentication, and Lifecycle Management. Founded in 2009 and headquartered in San Francisco, Okta aims to secure user and device profiles while enabling seamless application access across various platforms.
Akamai Overview
Akamai Technologies, Inc. specializes in cloud services that secure, deliver, and optimize content and business applications over the internet globally. Its offerings include cybersecurity protection, media delivery, edge computing, and performance solutions for web and mobile applications. Established in 1998 and based in Cambridge, Massachusetts, Akamai supports customers with integration and optimization services to enhance online security and performance.
Key similarities and differences
Both Okta and Akamai operate within the software infrastructure sector, targeting enterprise clients with cloud-based security solutions. Okta centers on identity management and user authentication, while Akamai emphasizes content delivery, cybersecurity, and edge computing services. Despite their complementary focuses, they share a commitment to enhancing digital security and performance, serving a broad international customer base through direct sales and channel partners.
Income Statement Comparison
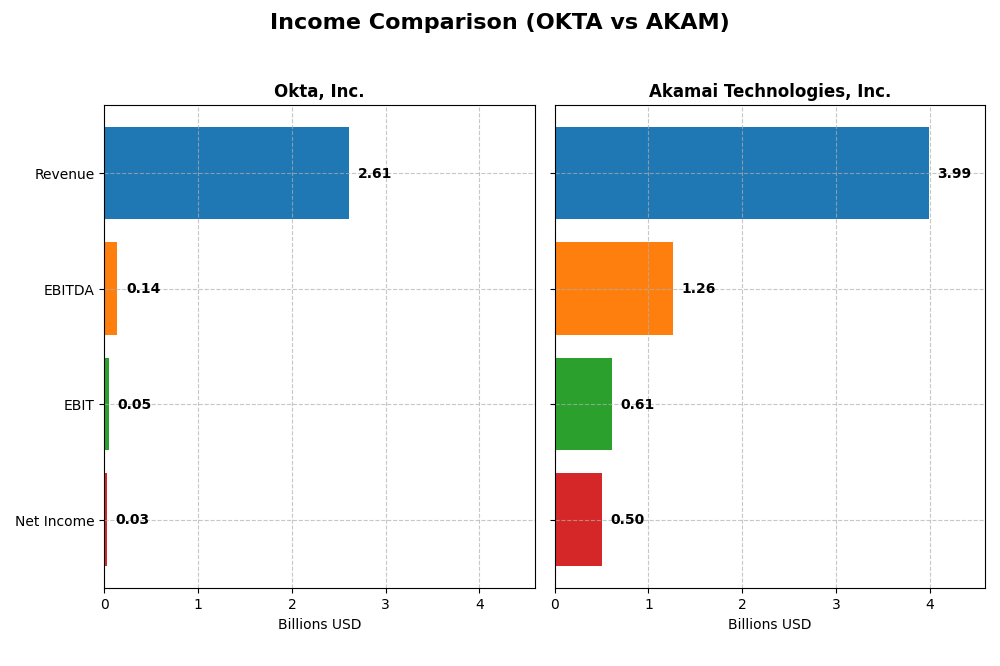
This table compares the key income statement metrics for Okta, Inc. and Akamai Technologies, Inc. based on their most recent fiscal year data.
| Metric | Okta, Inc. (OKTA) | Akamai Technologies, Inc. (AKAM) |
|---|---|---|
| Market Cap | 15.2B | 13.4B |
| Revenue | 2.61B | 3.99B |
| EBITDA | 139M | 1.26B |
| EBIT | 51M | 614M |
| Net Income | 28M | 505M |
| EPS | 0.17 | 3.34 |
| Fiscal Year | 2025 | 2024 |
Income Statement Interpretations
Okta, Inc.
Okta’s revenue demonstrated strong growth from $835M in 2021 to $2.61B in 2025, with net income turning positive at $28M in 2025 after multiple years of losses. Gross margin remained robust at 76.32%, while EBIT and net margins were modest but improving. The latest year showed favorable growth in revenue and profitability, signaling a positive turnaround.
Akamai Technologies, Inc.
Akamai’s revenue increased moderately from $3.19B in 2020 to $3.99B in 2024, while net income declined from $557M to $505M. Margins remain healthy with a 59.39% gross margin and a 12.65% net margin, although recent EBIT and net margin growth turned negative. The latest year saw slower revenue growth and margin compression, indicating some operational challenges.
Which one has the stronger fundamentals?
Okta exhibits stronger fundamentals with favorable growth across revenue, gross profit, EBIT, and net income over the recent period, improving from deep losses to positive earnings. In contrast, Akamai shows stable but slower revenue growth, declining net income, and unfavorable margin trends. Okta’s rapid improvement contrasts with Akamai’s recent margin pressures, reflecting divergent financial trajectories.
Financial Ratios Comparison
The table below presents a side-by-side comparison of key financial ratios for Okta, Inc. and Akamai Technologies, Inc. based on their most recent fiscal year data.
| Ratios | Okta, Inc. (2025) | Akamai Technologies, Inc. (2024) |
|---|---|---|
| ROE | 0.44% | 10.35% |
| ROIC | -0.61% | 4.74% |
| P/E | 570.6 | 28.68 |
| P/B | 2.49 | 2.97 |
| Current Ratio | 1.35 | 1.23 |
| Quick Ratio | 1.35 | 1.23 |
| D/E (Debt-to-Equity) | 0.15 | 0.95 |
| Debt-to-Assets | 10.09% | 44.70% |
| Interest Coverage | -14.8 | 19.67 |
| Asset Turnover | 0.28 | 0.38 |
| Fixed Asset Turnover | 22.31 | 1.33 |
| Payout Ratio | 0% | 0% |
| Dividend Yield | 0% | 0% |
Interpretation of the Ratios
Okta, Inc.
Okta’s ratios present a mix of strengths and weaknesses. Key profitability metrics such as net margin (1.07%) and return on equity (0.44%) are unfavorable, while leverage and liquidity ratios like debt-to-equity (0.15) and quick ratio (1.35) are favorable. The company does not pay dividends, consistent with its ongoing investment in growth and innovation, focusing on R&D rather than shareholder returns.
Akamai Technologies, Inc.
Akamai shows generally balanced ratios, with a favorable net margin of 12.65% but a neutral return on equity (10.35%) and an unfavorable return on invested capital (4.74%). Its debt levels and coverage ratios are mostly neutral to favorable, supporting operational stability. Akamai also does not pay dividends, likely prioritizing reinvestment and operational expansion over immediate shareholder payouts.
Which one has the best ratios?
Both companies exhibit a neutral overall ratio profile, with Okta slightly stronger in leverage and liquidity, while Akamai benefits from superior profitability margins. Each faces specific challenges: Okta’s low returns and high valuation ratios contrast with Akamai’s moderate returns and higher debt levels. Neither company currently provides dividends, reflecting reinvestment strategies.
Strategic Positioning
This section compares the strategic positioning of Okta and Akamai, focusing on Market position, Key segments, and Exposure to technological disruption:
Okta, Inc.
- Leading identity solutions provider facing competitive software infrastructure market
- Focused on identity cloud platform with subscription services driving revenue growth
- Positioned to address identity security demands; digital security is evolving but no direct disruption noted
Akamai Technologies, Inc.
- Established cloud services provider facing competition in content delivery and cybersecurity
- Offers cloud security, content delivery, performance, and edge compute solutions
- Exposed to evolving cloud security and edge computing technologies impacting service offerings
Okta vs Akamai Positioning
Okta’s strategy centers on a specialized, subscription-driven identity platform, while Akamai operates diversified cloud and security services. Okta’s narrower focus drives growth, Akamai’s broader portfolio faces varied market pressures and technology shifts.
Which has the best competitive advantage?
Both companies are shedding value with ROIC below WACC; Okta shows improving profitability trends, whereas Akamai’s declining ROIC suggests weaker competitive advantage and value creation potential.
Stock Comparison
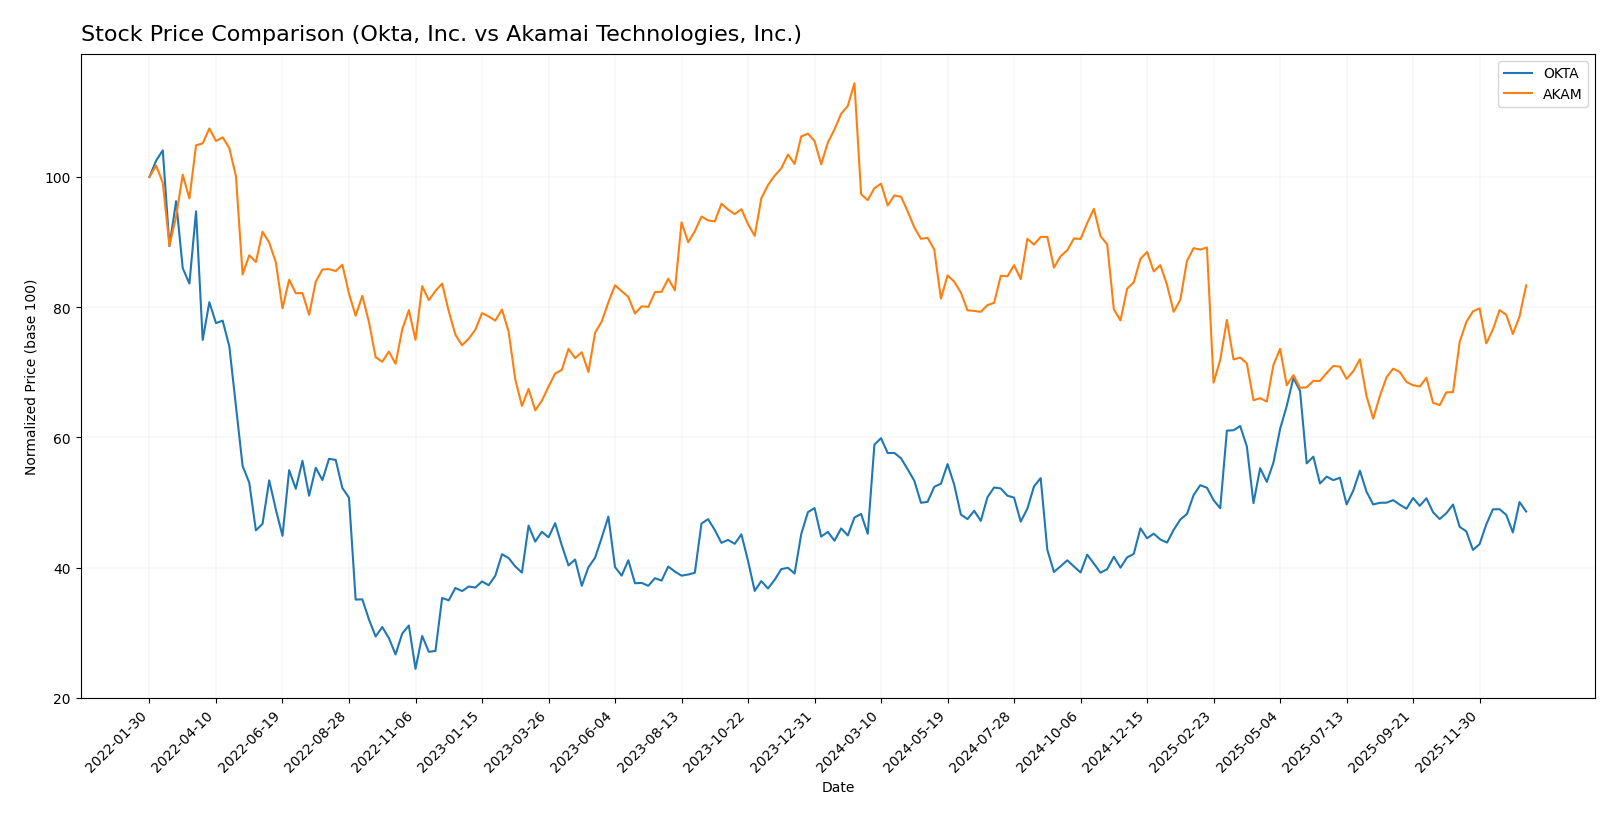
The stock price movements of Okta, Inc. and Akamai Technologies, Inc. over the past 12 months reveal distinct trading dynamics, with Okta showing a bullish overall trend and Akamai experiencing a bearish overall trend, both accompanied by recent fluctuations.
Trend Analysis
Okta, Inc. posted a 7.58% price increase over the past year, marking a bullish trend with accelerating momentum, a high of 127.3, and a low of 72.24. Recent weeks show a slight negative shift of -2.16%.
Akamai Technologies, Inc. recorded a -13.57% price change over the same period, indicating a bearish trend with accelerating decline, a high of 111.0, and a low of 70.53. Recently, the stock reversed with a strong positive change of 24.49%.
Comparing both, Okta has delivered the highest market performance over the year with a positive gain, while Akamai’s overall decline contrasts with its recent sharp recovery.
Target Prices
Analysts show a generally optimistic outlook based on current target price consensus.
| Company | Target High | Target Low | Consensus |
|---|---|---|---|
| Okta, Inc. | 140 | 60 | 110.67 |
| Akamai Technologies, Inc. | 115 | 89 | 104.8 |
Okta’s consensus target price of 110.67 suggests a potential upside from the current price of 89.55, while Akamai’s consensus at 104.8 similarly indicates moderate growth potential above its current price of 93.49. Overall, analysts expect both stocks to appreciate moderately over the medium term.
Analyst Opinions Comparison
This section compares analysts’ ratings and grades for Okta, Inc. and Akamai Technologies, Inc.:
Rating Comparison
Okta, Inc. Rating
- Rating: B, categorized as Very Favorable
- Discounted Cash Flow Score: 4, Favorable
- ROE Score: 2, Moderate
- ROA Score: 3, Moderate
- Debt To Equity Score: 4, Favorable
- Overall Score: 3, Moderate
Akamai Technologies, Inc. Rating
- Rating: B, categorized as Very Favorable
- Discounted Cash Flow Score: 5, Very Favorable
- ROE Score: 3, Moderate
- ROA Score: 3, Moderate
- Debt To Equity Score: 1, Very Unfavorable
- Overall Score: 3, Moderate
Which one is the best rated?
Both Okta and Akamai share the same overall rating of B and a moderate overall score of 3. Akamai scores higher on discounted cash flow and ROE, while Okta has a more favorable debt-to-equity score.
Scores Comparison
Here is a comparison of the Altman Z-Score and Piotroski Score for both companies:
Okta Scores
- Altman Z-Score: 4.15, indicating a safe zone with low bankruptcy risk.
- Piotroski Score: 8, classified as very strong financial health.
Akamai Scores
- Altman Z-Score: 2.46, placing it in the grey zone with moderate risk.
- Piotroski Score: 7, classified as strong financial health.
Which company has the best scores?
Okta shows a higher Altman Z-Score in the safe zone and a very strong Piotroski Score of 8, compared to Akamai’s grey zone Z-Score and strong Piotroski Score of 7. Based strictly on these scores, Okta demonstrates stronger financial stability and health.
Grades Comparison
Here is a comparison of recent grades and ratings from reputable grading companies for Okta, Inc. and Akamai Technologies, Inc.:
Okta, Inc. Grades
The following table summarizes recent analyst grades for Okta, Inc.:
| Grading Company | Action | New Grade | Date |
|---|---|---|---|
| Stephens & Co. | Upgrade | Overweight | 2026-01-14 |
| Piper Sandler | Maintain | Neutral | 2026-01-05 |
| RBC Capital | Maintain | Outperform | 2026-01-05 |
| Jefferies | Upgrade | Buy | 2025-12-16 |
| Needham | Maintain | Buy | 2025-12-12 |
| BTIG | Maintain | Buy | 2025-12-04 |
| Susquehanna | Maintain | Neutral | 2025-12-03 |
| Cantor Fitzgerald | Maintain | Overweight | 2025-12-03 |
| Canaccord Genuity | Maintain | Buy | 2025-12-03 |
| Scotiabank | Maintain | Sector Perform | 2025-12-03 |
Okta’s grades show a strong positive trend with multiple upgrades and a consensus leaning towards Buy.
Akamai Technologies, Inc. Grades
The following table summarizes recent analyst grades for Akamai Technologies, Inc.:
| Grading Company | Action | New Grade | Date |
|---|---|---|---|
| Citigroup | Maintain | Neutral | 2026-01-16 |
| Morgan Stanley | Upgrade | Overweight | 2026-01-12 |
| Scotiabank | Maintain | Sector Outperform | 2026-01-09 |
| RBC Capital | Maintain | Sector Perform | 2026-01-05 |
| Piper Sandler | Maintain | Neutral | 2026-01-05 |
| Keybanc | Upgrade | Overweight | 2025-12-15 |
| TD Cowen | Maintain | Hold | 2025-11-13 |
| Citigroup | Maintain | Neutral | 2025-11-11 |
| Scotiabank | Maintain | Sector Outperform | 2025-11-07 |
| Piper Sandler | Maintain | Neutral | 2025-11-07 |
Akamai’s grades indicate a cautiously optimistic stance with several upgrades but a consensus rating of Hold.
Which company has the best grades?
Okta, Inc. has received generally more favorable grades, including multiple Buy and Overweight ratings, compared to Akamai Technologies, Inc., which holds mainly Neutral and Hold grades. This difference reflects stronger analyst confidence in Okta’s near-term prospects, which may influence investor sentiment and portfolio decisions accordingly.
Strengths and Weaknesses
Below is a comparison of key strengths and weaknesses for Okta, Inc. and Akamai Technologies, Inc. based on the most recent financial and operational data.
| Criterion | Okta, Inc. | Akamai Technologies, Inc. |
|---|---|---|
| Diversification | Focused revenue primarily from Subscription and Circulation (2.56B in 2025); limited diversification | More diversified revenue streams within technology services; total 3.99B in 2024 |
| Profitability | Low net margin (1.07%), negative ROIC (-0.61%), shedding value but ROIC improving | Strong net margin (12.65%), positive ROE (10.35%), but declining ROIC; also shedding value |
| Innovation | High fixed asset turnover (22.31) suggests efficient use of assets and innovation capacity | Moderate fixed asset turnover (1.33); innovation pace less aggressive |
| Global presence | Solid global footprint in identity management, but smaller scale | Larger global presence with broader technology infrastructure services |
| Market Share | Rapid revenue growth in subscription services, but still smaller market share | Larger market share in content delivery and cloud services |
Key takeaways: Okta shows strong growth and improving profitability trends but still struggles with value creation and margin levels. Akamai maintains solid profitability and scale but faces declining returns on capital. Both companies present moderate risks; investors should weigh growth potential against current profitability challenges.
Risk Analysis
Below is a comparative table highlighting key risks for Okta, Inc. and Akamai Technologies, Inc. based on the most recent data available for 2025 and 2024 respectively.
| Metric | Okta, Inc. (OKTA) | Akamai Technologies, Inc. (AKAM) |
|---|---|---|
| Market Risk | Moderate beta at 0.76, indicating lower volatility vs. market. | Lower beta at 0.685, also less volatile than market. |
| Debt level | Low debt-to-equity (0.15), low debt-to-assets (10.09%), strong interest coverage (10.2x). | Higher leverage with debt-to-equity near 0.95 and debt-to-assets at 44.7%, but strong interest coverage (22.65x). |
| Regulatory Risk | Moderate, industry subject to data privacy regulations. | Moderate, with exposure to cybersecurity regulations globally. |
| Operational Risk | Risks linked to cloud infrastructure dependency and integration of Auth0 services. | Operational risks from complex cloud delivery and edge computing solutions. |
| Environmental Risk | Low direct exposure, typical of software infrastructure firms. | Low direct exposure, similar industry profile. |
| Geopolitical Risk | Moderate, given international client base and data security concerns. | Moderate, international presence and cybersecurity market exposure. |
In synthesis, the most impactful and likely risks for both companies lie in their operational and regulatory environments, driven by evolving cybersecurity threats and data privacy laws. Okta’s low debt level reduces financial risk, whereas Akamai’s higher leverage demands closer monitoring despite strong interest coverage. Both companies remain exposed to geopolitical tensions that could affect global IT infrastructure investments.
Which Stock to Choose?
Okta, Inc. shows a favorable income evolution with strong revenue and net income growth over 2021-2025. Its financial ratios present a balanced picture: several favorable metrics like quick ratio and debt management, yet some unfavorable profitability ratios. The company carries moderate debt and holds a very favorable overall rating.
Akamai Technologies, Inc. maintains stable income with moderate growth and solid profitability metrics, including a favorable gross and net margin. Its financial ratios show a neutral global assessment, with some concerns around debt levels. The company’s rating is also very favorable, supported by solid cash flow generation.
Investors focused on growth might find Okta’s improving profitability and favorable income trends appealing, while those valuing stability and consistent profitability could perceive Akamai’s steady income and stronger margin performance as more suitable. The differing debt profiles and ratio evaluations suggest these stocks might appeal differently depending on risk tolerance and investment strategy.
Disclaimer: Investment carries a risk of loss of initial capital. The past performance is not a reliable indicator of future results. Be sure to understand risks before making an investment decision.
Go Further
I encourage you to read the complete analyses of Okta, Inc. and Akamai Technologies, Inc. to enhance your investment decisions: