In the rapidly evolving technology sector, Akamai Technologies, Inc. and Oddity Tech Ltd. stand out with distinct yet overlapping ambitions in software infrastructure. Akamai excels in cloud security and content delivery, while Oddity innovates in consumer tech with digital-first beauty and wellness brands. This comparison explores their market positions and innovation strategies to uncover which company offers the most compelling investment opportunity for you.

Table of contents
Companies Overview
I will begin the comparison between Akamai Technologies and Oddity Tech by providing an overview of these two companies and their main differences.
Akamai Technologies Overview
Akamai Technologies, Inc. specializes in cloud services aimed at securing, delivering, and optimizing content and business applications globally. The company focuses on protecting infrastructure, websites, and applications from cyberattacks while enhancing performance through web, media delivery, and edge computing solutions. Headquartered in Cambridge, Massachusetts, Akamai operates in the software infrastructure industry with a market capitalization of approximately 13.4B USD.
Oddity Tech Overview
Oddity Tech Ltd. operates as a consumer-tech company worldwide, focusing on beauty and wellness products powered by its proprietary PowerMatch technology. The company builds digital-first brands to disrupt traditional offline beauty markets with offerings under the IL MAKIAGE and SpoiledChild brands. Based in Tel Aviv-Jaffa, Israel, Oddity Tech is part of the software infrastructure sector with a market capitalization near 2B USD.
Key similarities and differences
Both Akamai and Oddity Tech operate within the software infrastructure industry but cater to different markets—Akamai in cloud security and performance services, and Oddity in digital beauty and wellness products. Akamai is a well-established player with a larger market cap and broader global reach, while Oddity is a younger company with a niche focus on consumer tech. Their business models differ significantly, with Akamai providing technology infrastructure solutions and Oddity focusing on brand building and product innovation.
Income Statement Comparison
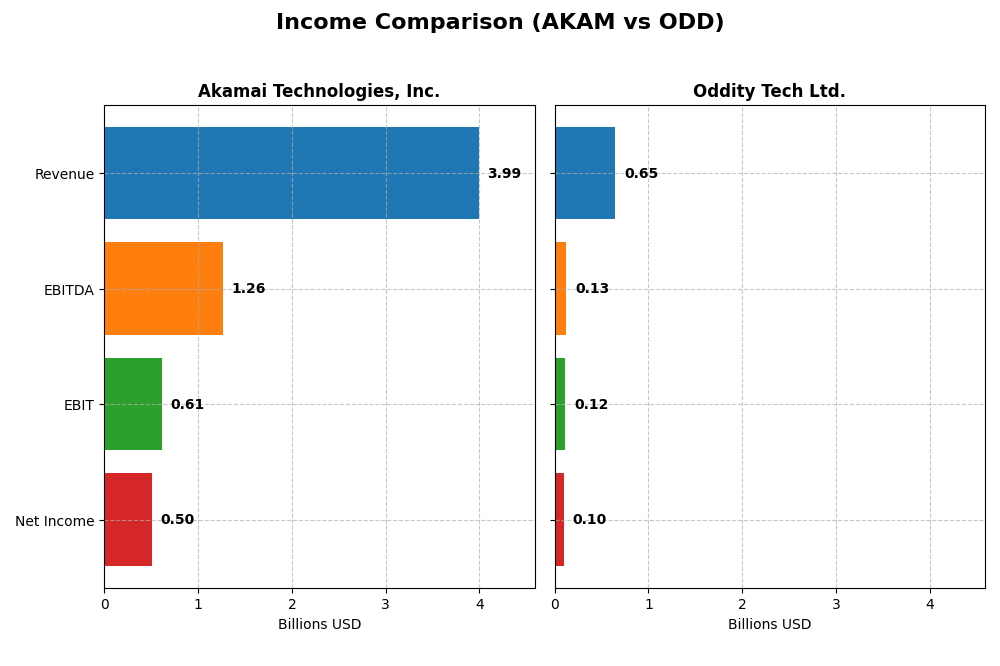
The table below presents a side-by-side comparison of key income statement metrics for Akamai Technologies, Inc. and Oddity Tech Ltd. for the fiscal year 2024.
| Metric | Akamai Technologies, Inc. | Oddity Tech Ltd. |
|---|---|---|
| Market Cap | 13.4B | 2.01B |
| Revenue | 3.99B | 647M |
| EBITDA | 1.26B | 125M |
| EBIT | 614M | 116M |
| Net Income | 505M | 101M |
| EPS | 3.34 | 1.78 |
| Fiscal Year | 2024 | 2024 |
Income Statement Interpretations
Akamai Technologies, Inc.
From 2020 to 2024, Akamai’s revenue showed a steady increase from $3.2B to $4B, a 24.8% rise overall. However, net income declined 9.36% over the same period, with net margins contracting by 27.37%. In 2024, revenue growth slowed to 4.7%, while net income fell 7.9%, reflecting pressure on profitability despite stable gross margins near 59.4%.
Oddity Tech Ltd.
Oddity Tech demonstrated rapid revenue growth, surging 484.8% from $110M in 2020 to $647M in 2024. Net income expanded even faster, by 766.5%, with net margins improving 48.2%. The latest year saw a 27.2% revenue increase and 66% EPS growth, alongside higher EBIT margins of 17.9%, indicating strong operational leverage and expanding profitability.
Which one has the stronger fundamentals?
Oddity Tech presents stronger fundamentals, showing consistent favorable growth across all income statement metrics over the period, including robust margin expansions and earnings gains. In contrast, Akamai exhibits mixed results with revenue growth offset by declining net income and margins, leading to an overall unfavorable income statement assessment.
Financial Ratios Comparison
Below is a comparative table of key financial ratios for Akamai Technologies, Inc. and Oddity Tech Ltd. based on their most recent fiscal year data ending 2024.
| Ratios | Akamai Technologies, Inc. | Oddity Tech Ltd. |
|---|---|---|
| ROE | 10.35% | 35.95% |
| ROIC | 4.74% | 28.56% |
| P/E | 28.68 | 23.75 |
| P/B | 2.97 | 8.54 |
| Current Ratio | 1.23 | 1.79 |
| Quick Ratio | 1.23 | 0.99 |
| D/E (Debt-to-Equity) | 0.95 | 0.08 |
| Debt-to-Assets | 44.70% | 5.17% |
| Interest Coverage | 19.67 | 1521.05 |
| Asset Turnover | 0.38 | 1.47 |
| Fixed Asset Turnover | 1.33 | 19.38 |
| Payout ratio | 0 | 0 |
| Dividend yield | 0% | 0% |
Interpretation of the Ratios
Akamai Technologies, Inc.
Akamai shows a balanced ratio profile with favorable net margin (12.65%) and interest coverage (22.65), but faces challenges with return on invested capital (4.74%) and asset turnover (0.38). Its payout ratio is zero as it does not pay dividends, likely due to a reinvestment strategy in a mature software infrastructure sector.
Oddity Tech Ltd.
Oddity Tech exhibits strong profitability with a net margin of 15.69%, ROE of 35.95%, and ROIC of 28.56%, although its weighted average cost of capital is high (18.68%). The company also does not pay dividends, reflecting a possible focus on growth and reinvestment rather than shareholder payouts.
Which one has the best ratios?
Oddity Tech holds a more favorable ratio mix, with 64.29% favorable metrics including high returns and low leverage, compared to Akamai’s more balanced but neutral profile. However, Oddity’s high cost of capital and elevated price-to-book ratio suggest some risks, while Akamai’s more moderate financial structure indicates stability.
Strategic Positioning
This section compares the strategic positioning of Akamai Technologies, Inc. and Oddity Tech Ltd. across Market position, Key segments, and Exposure to technological disruption:
Akamai Technologies, Inc.
- Large market cap of 13.4B in software infrastructure with moderate beta 0.685; faces competitive pressure in cloud services.
- Focuses on cloud services securing and optimizing internet content delivery and edge computing; key business driver is cybersecurity and performance solutions.
- Exposure to disruption through cloud and edge compute innovation; relies on evolving internet security and performance technologies.
Oddity Tech Ltd.
- Smaller 2B market cap in consumer-tech, higher beta 3.18, competing in digital-first beauty and wellness brands.
- Operates in beauty and wellness segments with PowerMatch technology, disrupting offline-dominated consumer markets.
- Disruption via digital-first brand scaling and technology-driven consumer product innovation in beauty and wellness.
Akamai Technologies, Inc. vs Oddity Tech Ltd. Positioning
Akamai has a diversified technology infrastructure focus on cybersecurity and cloud services, while Oddity concentrates on digital-first consumer-tech brands. Akamai’s scale supports broad market reach; Oddity’s niche targets disruption in offline industries, each with distinct growth drivers and risks.
Which has the best competitive advantage?
Oddity demonstrates a very favorable MOAT with growing ROIC and value creation, indicating a durable competitive advantage. Akamai shows a very unfavorable MOAT, shedding value with declining profitability over recent years.
Stock Comparison
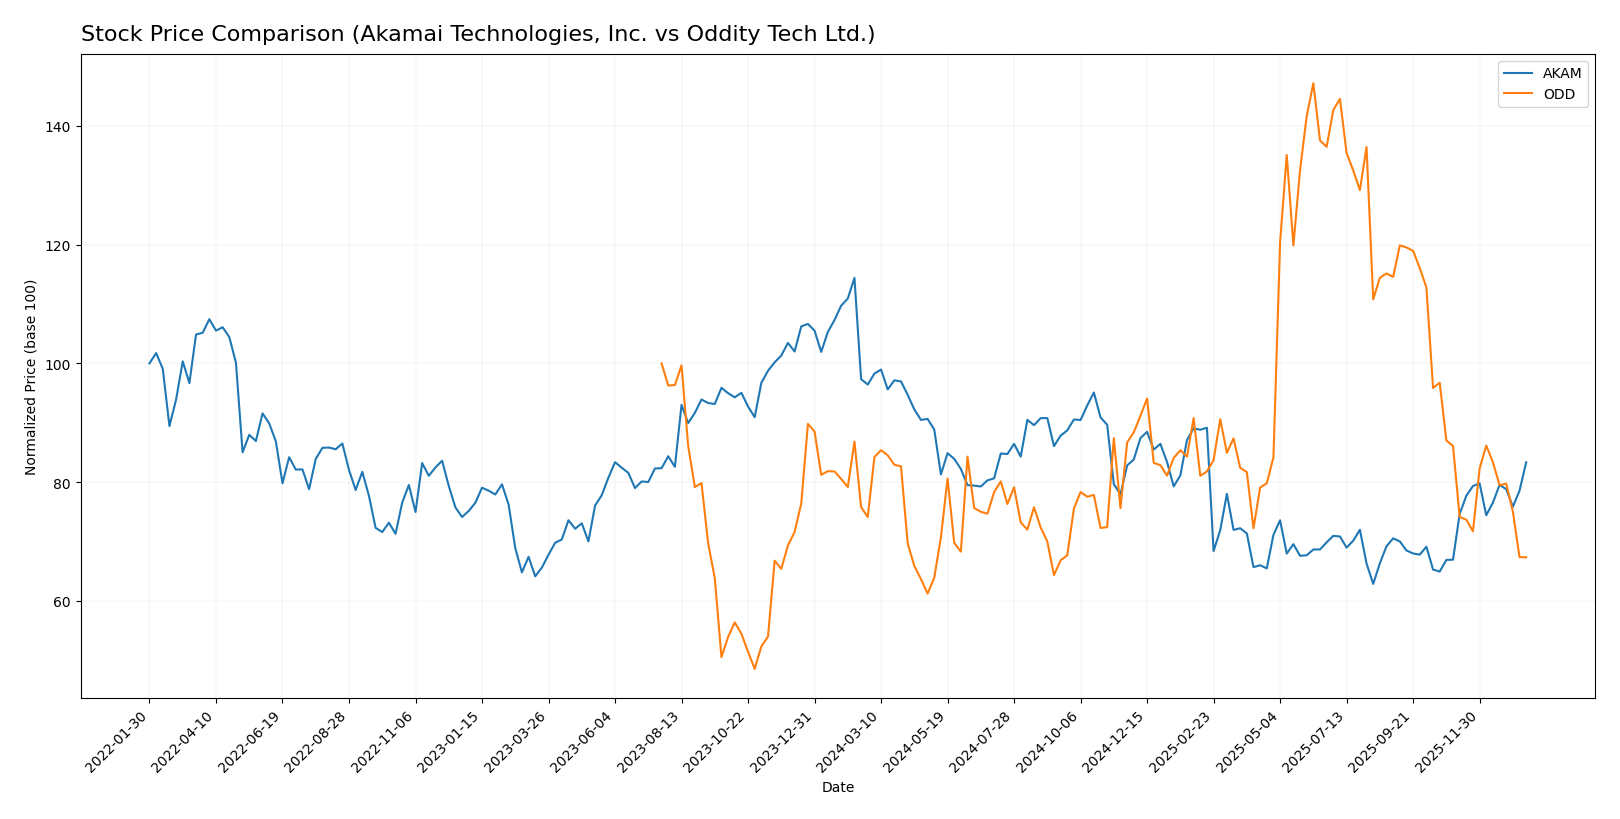
The stock price movements of Akamai Technologies, Inc. (AKAM) and Oddity Tech Ltd. (ODD) over the past 12 months reveal contrasting trading dynamics, with AKAM showing a pronounced overall decline but recent strong recovery, while ODD exhibits a steady downward trend with recent acceleration in losses.
Trend Analysis
Akamai Technologies, Inc. experienced a bearish trend with a -13.57% price change over the past year, marked by accelerating decline and high volatility (std deviation 10.92). Notably, a recent 24.49% price increase indicates a short-term bullish reversal.
Oddity Tech Ltd. also showed a bearish trend over the past 12 months, with a -9.16% price change and decelerating decline. Recent performance worsened with a -21.77% drop, reflecting renewed downward momentum and moderate volatility (std deviation 3.34).
Comparing both stocks, Akamai demonstrated the highest market performance recently with a strong price rebound, despite its larger overall loss compared to Oddity Tech’s steadier but consistently negative trend.
Target Prices
Analysts provide a clear target price consensus for both Akamai Technologies, Inc. and Oddity Tech Ltd.
| Company | Target High | Target Low | Consensus |
|---|---|---|---|
| Akamai Technologies, Inc. | 115 | 89 | 104.8 |
| Oddity Tech Ltd. | 80 | 40 | 66.33 |
The consensus target prices indicate upside potential for both stocks compared to their current prices of 93.49 for Akamai and 35.4 for Oddity Tech, reflecting generally positive analyst outlooks.
Analyst Opinions Comparison
This section compares analysts’ ratings and grades for Akamai Technologies, Inc. and Oddity Tech Ltd.:
Rating Comparison
AKAM Rating
- Rated B, considered very favorable overall.
- Discounted Cash Flow Score is 5, indicating very favorable future cash flow.
- Return on Equity Score is 3, a moderate indicator of profit generation.
- Return on Assets Score is 3, showing moderate asset utilization.
- Debt To Equity Score is 1, very unfavorable, indicating high financial risk.
- Overall Score is 3, reflecting a moderate overall financial standing.
ODD Rating
- Rated B+, also very favorable overall.
- Discounted Cash Flow Score is 4, rated favorable for cash flow projections.
- Return on Equity Score is 5, a very favorable measure of profit efficiency.
- Return on Assets Score is 4, indicating favorable asset use.
- Debt To Equity Score is 3, moderate financial risk and balance sheet strength.
- Overall Score is 3, also representing a moderate overall financial standing.
Which one is the best rated?
Oddity Tech Ltd. holds a higher overall rating (B+) and stronger scores in ROE, ROA, and debt-to-equity, indicating better profitability and financial stability compared to Akamai Technologies, Inc. However, Akamai shows a stronger discounted cash flow score.
Scores Comparison
Here is a comparison of the Altman Z-Score and Piotroski Score for both companies:
Akamai Scores
- Altman Z-Score: 2.46, indicating a moderate bankruptcy risk in the grey zone.
- Piotroski Score: 7, reflecting strong financial health and value.
Oddity Tech Scores
- Altman Z-Score: 3.78, indicating low bankruptcy risk in the safe zone.
- Piotroski Score: 6, reflecting average financial health and value.
Which company has the best scores?
Oddity Tech has a better Altman Z-Score (3.78) indicating stronger financial stability, while Akamai has a higher Piotroski Score (7) suggesting stronger financial health. Each company leads in one score category based solely on the provided data.
Grades Comparison
Here is a detailed comparison of the latest grades assigned to both companies by credible grading firms:
Akamai Technologies, Inc. Grades
The table below summarizes recent grades and actions from recognized grading companies for Akamai Technologies, Inc.:
| Grading Company | Action | New Grade | Date |
|---|---|---|---|
| Citigroup | Maintain | Neutral | 2026-01-16 |
| Morgan Stanley | Upgrade | Overweight | 2026-01-12 |
| Scotiabank | Maintain | Sector Outperform | 2026-01-09 |
| RBC Capital | Maintain | Sector Perform | 2026-01-05 |
| Piper Sandler | Maintain | Neutral | 2026-01-05 |
| Keybanc | Upgrade | Overweight | 2025-12-15 |
| TD Cowen | Maintain | Hold | 2025-11-13 |
| Citigroup | Maintain | Neutral | 2025-11-11 |
| Scotiabank | Maintain | Sector Outperform | 2025-11-07 |
| Piper Sandler | Maintain | Neutral | 2025-11-07 |
Akamai has mostly maintained neutral to overweight ratings, with upgrades from Morgan Stanley and Keybanc, reflecting a stable to positive outlook.
Oddity Tech Ltd. Grades
The table below presents the recent grades and actions by reputable firms for Oddity Tech Ltd.:
| Grading Company | Action | New Grade | Date |
|---|---|---|---|
| Keybanc | Maintain | Overweight | 2026-01-08 |
| JP Morgan | Maintain | Overweight | 2025-12-12 |
| JP Morgan | Maintain | Overweight | 2025-11-21 |
| Barclays | Maintain | Equal Weight | 2025-11-21 |
| Morgan Stanley | Maintain | Equal Weight | 2025-11-21 |
| Needham | Maintain | Buy | 2025-11-20 |
| Keybanc | Maintain | Overweight | 2025-10-08 |
| JMP Securities | Maintain | Market Outperform | 2025-09-23 |
| Morgan Stanley | Maintain | Equal Weight | 2025-08-06 |
| JMP Securities | Maintain | Market Outperform | 2025-08-05 |
Oddity Tech’s grades are predominantly overweight or buy, with consistent maintenance of positive ratings by multiple firms, indicating a generally favorable market perception.
Which company has the best grades?
Oddity Tech Ltd. has received more consistently positive grades such as Overweight, Buy, and Market Outperform, compared to Akamai Technologies which shows a mix of Neutral and Sector Perform ratings with some upgrades. This suggests Oddity Tech may be viewed with stronger growth and performance expectations, potentially impacting investor confidence and portfolio allocation preferences.
Strengths and Weaknesses
Below is a comparative overview of key strengths and weaknesses for Akamai Technologies, Inc. (AKAM) and Oddity Tech Ltd. (ODD) based on the latest financial and strategic data.
| Criterion | Akamai Technologies, Inc. (AKAM) | Oddity Tech Ltd. (ODD) |
|---|---|---|
| Diversification | Moderate product diversification with $3.99B revenue in 2024 | Limited public data on revenue segmentation |
| Profitability | Net margin 12.65% (favorable); ROIC 4.74% (unfavorable, below WACC) | Net margin 15.69%; ROIC 28.56% (strong profitability above WACC) |
| Innovation | Moderate innovation with declining ROIC trend (-44.2%), value destroying | High innovation indicated by growing ROIC (+34.2%), value creating |
| Global presence | Established global presence but moderate asset turnover (0.38, unfavorable) | Growing global footprint with high asset turnover (1.47, favorable) |
| Market Share | Stable but challenged by value destruction and unfavorable P/E (28.68) | Growing market share supported by very favorable financial metrics |
Key takeaways: Oddity Tech demonstrates a robust and improving financial position with strong profitability and efficient capital use, suggesting a durable competitive advantage. In contrast, Akamai faces challenges with declining profitability and value destruction, signaling caution for investors.
Risk Analysis
Below is a comparison table summarizing key risk factors for Akamai Technologies, Inc. (AKAM) and Oddity Tech Ltd. (ODD) as of 2026:
| Metric | Akamai Technologies, Inc. (AKAM) | Oddity Tech Ltd. (ODD) |
|---|---|---|
| Market Risk | Moderate (Beta 0.69) | High (Beta 3.18) |
| Debt level | Moderate (Debt/Equity ~0.95) | Low (Debt/Equity ~0.08) |
| Regulatory Risk | Moderate (US & International data privacy & cybersecurity laws) | Moderate (Israel & global consumer product regulations) |
| Operational Risk | Moderate (Cloud infrastructure complexity) | Moderate (Consumer-tech supply chain) |
| Environmental Risk | Low (Technology sector, limited direct impact) | Low (Consumer-tech with sustainability focus) |
| Geopolitical Risk | Moderate (US base with global operations) | Moderate to High (Israel base, international markets) |
Akamai faces moderate market and regulatory risks linked to cybersecurity and data privacy regulations. Oddity Tech carries higher market risk due to high beta and geopolitical exposure given its Israeli base and global consumer tech operations. Debt levels favor Oddity, reducing financial vulnerability. Overall, geopolitical and market volatility pose the most impactful risks for Oddity, while Akamai’s operational complexity and regulatory environment require close monitoring.
Which Stock to Choose?
Akamai Technologies, Inc. (AKAM) shows a neutral income growth with a 4.7% revenue increase in 2024 but unfavorable net margin and EPS trends. Its financial ratios are balanced with 28.57% favorable and unfavorable metrics each, and a very favorable “B” rating despite a very unfavorable moat indicating value destruction and declining profitability.
Oddity Tech Ltd. (ODD) demonstrates strong income growth with 27.2% revenue growth and robust profitability improvements in 2024. Its financial ratios are largely favorable at 64.29%, supported by a very favorable “B+” rating and a very favorable moat reflecting durable competitive advantage and increasing profitability.
Investors prioritizing growth and strong profitability might find Oddity Tech Ltd. more aligned with their objectives, while those valuing stable ratings and moderate financial balance could view Akamai’s profile as more neutral; overall, preferences may depend on risk tolerance and focus on value creation.
Disclaimer: Investment carries a risk of loss of initial capital. The past performance is not a reliable indicator of future results. Be sure to understand risks before making an investment decision.
Go Further
I encourage you to read the complete analyses of Akamai Technologies, Inc. and Oddity Tech Ltd. to enhance your investment decisions: