Nutanix, Inc. (NTNX) and Akamai Technologies, Inc. (AKAM) are two prominent players in the software infrastructure sector, each driving innovation in enterprise cloud solutions and internet content delivery. Nutanix focuses on hybrid cloud platforms and virtualization, while Akamai leads in cloud security and edge computing. Given their overlapping markets and technological advancements, this comparison will help investors identify which company presents the most compelling investment opportunity today. Let’s dive into their strengths and risks.
Table of contents
Companies Overview
I will begin the comparison between Nutanix and Akamai by providing an overview of these two companies and their main differences.
Nutanix Overview
Nutanix, Inc. operates in the Software – Infrastructure sector, providing an enterprise cloud platform across multiple regions including North America, Europe, and Asia Pacific. The company offers a range of virtualization, storage, and cloud management solutions designed to simplify hybrid cloud orchestration for various industries. Founded in 2009 and headquartered in San Jose, California, Nutanix serves sectors such as healthcare, financial services, and telecommunications.
Akamai Overview
Akamai Technologies, Inc. is a technology company focused on cloud services that secure, deliver, and optimize content and business applications worldwide. Its offerings include cybersecurity protection, media delivery, and edge compute solutions aimed at enhancing performance and safety for websites and applications. Established in 1998 and based in Cambridge, Massachusetts, Akamai serves a broad international client base with a strong emphasis on internet security and content delivery.
Key similarities and differences
Both Nutanix and Akamai operate within the Software – Infrastructure industry, emphasizing cloud-related technologies. Nutanix primarily focuses on enterprise cloud platforms and virtualization software, while Akamai specializes in cloud security, content delivery, and edge computing. Although both cater to global markets, Nutanix is more centered on hybrid cloud orchestration, whereas Akamai prioritizes internet performance and cybersecurity solutions.
Income Statement Comparison
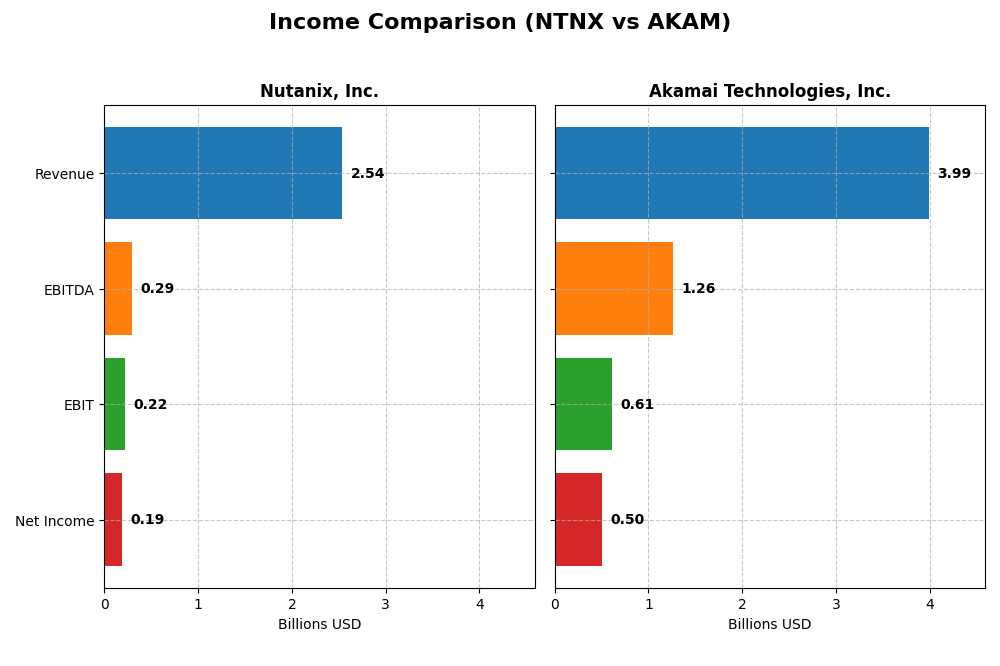
This table compares the key income statement metrics for Nutanix, Inc. and Akamai Technologies, Inc. for their most recent fiscal years, providing a snapshot of their financial performance.
| Metric | Nutanix, Inc. (NTNX) | Akamai Technologies, Inc. (AKAM) |
|---|---|---|
| Market Cap | 12.4B | 13.4B |
| Revenue | 2.54B | 3.99B |
| EBITDA | 293M | 1.26B |
| EBIT | 220M | 614M |
| Net Income | 188M | 505M |
| EPS | 0.70 | 3.34 |
| Fiscal Year | 2025 | 2024 |
Income Statement Interpretations
Nutanix, Inc.
Nutanix has shown strong revenue growth from 2021 to 2025, increasing from $1.39B to $2.54B, with net income turning positive in 2025 at $188M after several years of losses. Gross margins remained favorable, peaking at 86.81% in 2025. The latest year saw an 18.11% revenue increase and marked improvements in EBIT and net margin, indicating a solid recovery and margin expansion.
Akamai Technologies, Inc.
Akamai’s revenue grew moderately from $3.20B in 2020 to $3.99B in 2024, but net income declined overall, falling from $557M to $505M. Margins are favorable with a gross margin near 59.39% and net margin at 12.65% in 2024. However, recent growth slowed, with a 4.7% revenue increase but negative EBIT and net margin growth, signaling some operational challenges in the latest period.
Which one has the stronger fundamentals?
Nutanix displays more robust fundamentals with significant revenue and net income growth, improved margins, and a positive income statement outlook in 2025. Akamai, despite higher absolute revenue, shows weakening profitability trends and declining net income over the period. Nutanix’s strong margin improvements and income growth contrast with Akamai’s unfavorable recent earnings trajectory.
Financial Ratios Comparison
The table below presents key financial ratios for Nutanix, Inc. and Akamai Technologies, Inc. based on their most recent fiscal year data, allowing for an objective side-by-side evaluation.
| Ratios | Nutanix, Inc. (NTNX) 2025 | Akamai Technologies, Inc. (AKAM) 2024 |
|---|---|---|
| ROE | -27.1% | 10.4% |
| ROIC | 8.1% | 4.7% |
| P/E | 106.7 | 28.7 |
| P/B | -29.0 | 3.0 |
| Current Ratio | 1.72 | 1.23 |
| Quick Ratio | 1.72 | 1.23 |
| D/E (Debt to Equity) | -2.14 | 0.95 |
| Debt-to-Assets | 45.2% | 44.7% |
| Interest Coverage | 8.75 | 19.7 |
| Asset Turnover | 0.77 | 0.38 |
| Fixed Asset Turnover | 9.15 | 1.33 |
| Payout Ratio | 0 | 0 |
| Dividend Yield | 0 | 0 |
Interpretation of the Ratios
Nutanix, Inc.
Nutanix shows a mix of strong and weak ratios, with favorable liquidity and interest coverage but an unfavorable return on equity and a very high price-to-earnings ratio at 106.74. The company’s net margin and return on invested capital are neutral, indicating moderate profitability. Nutanix does not pay dividends, likely prioritizing reinvestment and growth, as suggested by its negative earnings and focus on R&D.
Akamai Technologies, Inc.
Akamai presents solid profitability with a favorable net margin and interest coverage, though its return on invested capital is unfavorable, and asset turnover is weak. The price-to-earnings ratio at 28.68 is more reasonable than Nutanix’s but still flagged as unfavorable. Akamai also does not pay dividends, which may reflect a focus on reinvestment or strategic priorities over shareholder payouts.
Which one has the best ratios?
Nutanix’s ratios are slightly favorable overall, benefiting from strong liquidity and coverage metrics despite profitability concerns. Akamai’s results are neutral with balanced positives and negatives, including better net margin but weaker asset utilization. Based on these evaluations, Nutanix shows a marginally better ratio profile than Akamai in the given fiscal year.
Strategic Positioning
This section compares the strategic positioning of Nutanix, Inc. and Akamai Technologies, Inc. regarding market position, key segments, and exposure to technological disruption:
Nutanix, Inc. (NTNX)
- Competes in enterprise cloud platforms with global reach; faces competition in software infrastructure.
- Focuses on subscription software, professional services, and cloud automation across multiple industries.
- Exposed to evolving cloud-native technologies with focus on virtualization and Kubernetes management.
Akamai Technologies, Inc. (AKAM)
- Operates in cloud services for security and content delivery; competes amid cybersecurity and cloud firms.
- Concentrates on cloud security, content delivery, media solutions, and edge computing services.
- Faces disruption from advancements in cybersecurity, edge compute, and internet content delivery.
Nutanix vs Akamai Positioning
Nutanix pursues a diversified approach with a broad product portfolio spanning cloud platforms and services across industries. Akamai focuses on concentrated cloud security and content delivery services. Nutanix’s diversity offers multiple growth drivers, whereas Akamai’s specialization targets niche markets but faces intense technological shifts.
Which has the best competitive advantage?
Nutanix demonstrates a very favorable moat with growing ROIC exceeding WACC, signaling durable competitive advantage. Akamai shows a very unfavorable moat with declining ROIC below WACC, indicating value erosion and weak competitive positioning.
Stock Comparison
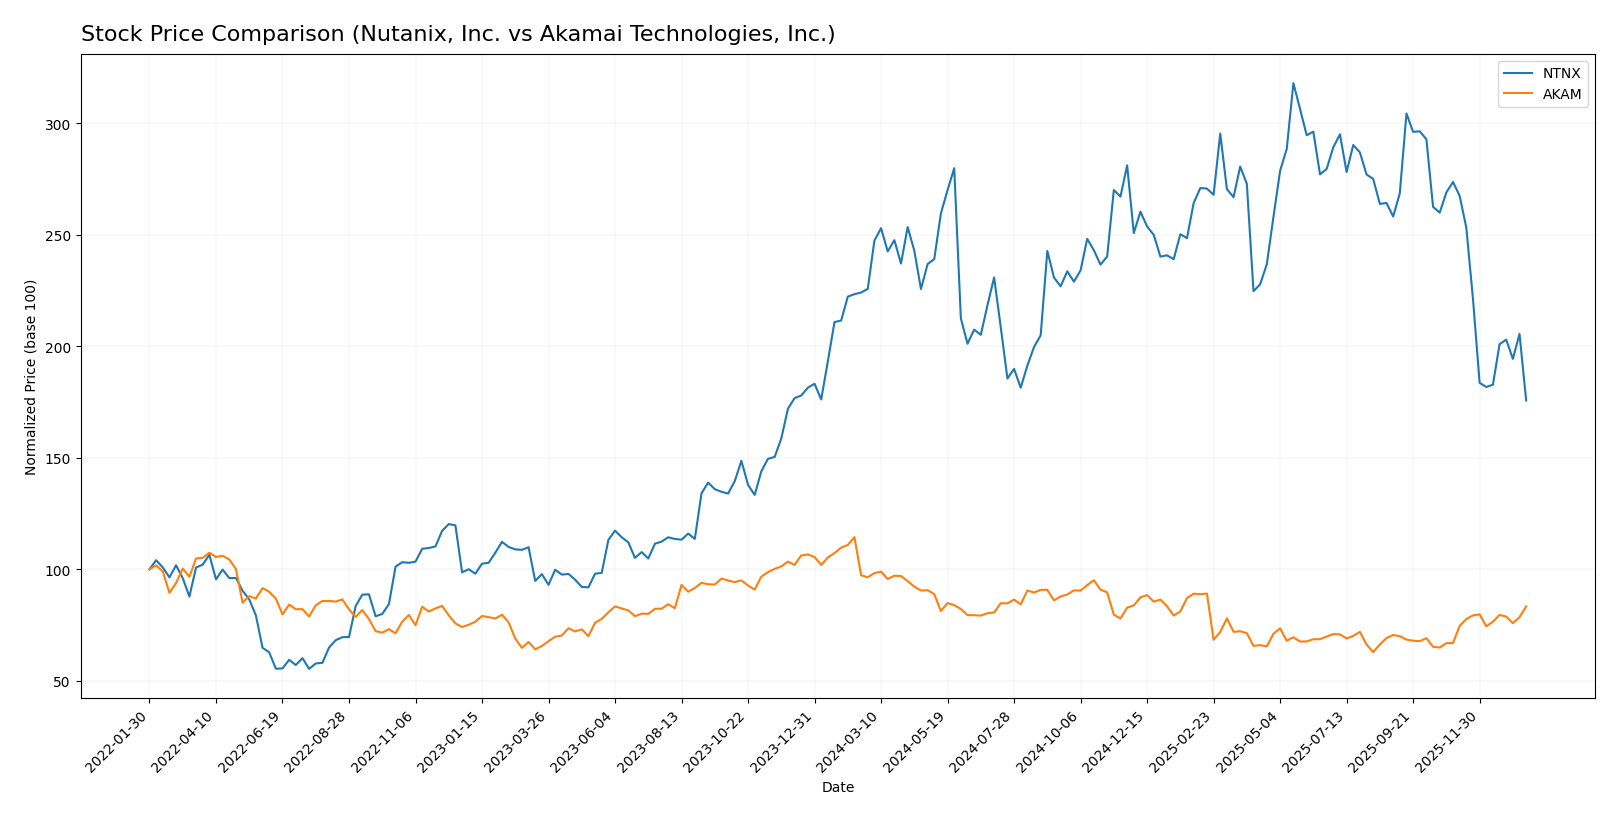
The past 12 months reveal contrasting stock dynamics for Nutanix, Inc. and Akamai Technologies, Inc., with both showing overall declines but differing recent momentum and trading volumes.
Trend Analysis
Nutanix, Inc. experienced a bearish trend over the past year, with a price decline of 22.16% and deceleration in trend momentum. The stock showed a high volatility level, with prices fluctuating between 82.77 and 45.74.
Akamai Technologies, Inc. also faced a bearish trend across the same period, with a 13.57% price decrease but an accelerating recovery trend recently. Volatility was higher than Nutanix’s, ranging from 111.0 to 70.53, and recent gains reached 24.49%.
Comparing the two, Akamai delivered the highest market performance recently, reversing losses with significant buyer dominance, while Nutanix’s downward trend continued with seller strength.
Target Prices
Analysts present a bullish consensus on Nutanix, Inc. and Akamai Technologies, Inc., with target prices well above current market levels.
| Company | Target High | Target Low | Consensus |
|---|---|---|---|
| Nutanix, Inc. | 90 | 53 | 64.67 |
| Akamai Technologies, Inc. | 115 | 89 | 104.8 |
The target consensus for Nutanix at 64.67 suggests upside potential from the current price of 45.74 USD. Similarly, Akamai’s consensus target of 104.8 indicates expected growth from the current price of 93.49 USD. Both stocks show analyst optimism relative to their prevailing market prices.
Analyst Opinions Comparison
This section compares analysts’ ratings and grades for Nutanix, Inc. and Akamai Technologies, Inc.:
Rating Comparison
NTNX Rating
- Rating: C+ indicating a very favorable status.
- Discounted Cash Flow Score: 4, favorable valuation outlook.
- ROE Score: 1, very unfavorable efficiency generating profit.
- ROA Score: 4, favorable asset utilization effectiveness.
- Debt To Equity Score: 1, very unfavorable financial risk.
- Overall Score: 2, moderate overall financial standing.
AKAM Rating
- Rating: B indicating a very favorable status.
- Discounted Cash Flow Score: 5, very favorable valuation outlook.
- ROE Score: 3, moderate efficiency generating profit.
- ROA Score: 3, moderate asset utilization effectiveness.
- Debt To Equity Score: 1, very unfavorable financial risk.
- Overall Score: 3, moderate overall financial standing.
Which one is the best rated?
Based strictly on the provided data, Akamai holds a higher rating of B compared to Nutanix’s C+, with better scores in discounted cash flow, ROE, ROA, and overall score. Both have equally unfavorable debt-to-equity scores.
Scores Comparison
Here is a comparison of Nutanix and Akamai’s financial scores based on Altman Z-Score and Piotroski Score:
Nutanix Scores
- Altman Z-Score: 1.48, in distress zone indicating higher bankruptcy risk
- Piotroski Score: 6, average financial strength
Akamai Scores
- Altman Z-Score: 2.46, in grey zone indicating moderate bankruptcy risk
- Piotroski Score: 7, strong financial strength
Which company has the best scores?
Akamai has higher scores on both Altman Z-Score and Piotroski Score, indicating comparatively better financial stability and strength than Nutanix based on the provided data.
Grades Comparison
The following grades from reputable financial institutions provide a comparative overview of Nutanix, Inc. and Akamai Technologies, Inc.:
Nutanix, Inc. Grades
This table summarizes recent grades assigned by established grading companies to Nutanix, Inc.:
| Grading Company | Action | New Grade | Date |
|---|---|---|---|
| Barclays | Downgrade | Equal Weight | 2026-01-15 |
| Morgan Stanley | Downgrade | Equal Weight | 2026-01-12 |
| RBC Capital | Maintain | Outperform | 2026-01-05 |
| Goldman Sachs | Maintain | Buy | 2025-11-28 |
| JP Morgan | Maintain | Overweight | 2025-11-26 |
| Needham | Maintain | Buy | 2025-11-26 |
| Wells Fargo | Maintain | Equal Weight | 2025-11-26 |
| Morgan Stanley | Maintain | Overweight | 2025-11-26 |
| Keybanc | Maintain | Overweight | 2025-11-26 |
| Piper Sandler | Maintain | Overweight | 2025-11-26 |
Grades for Nutanix show a slight recent downgrade trend from Overweight to Equal Weight by Barclays and Morgan Stanley, while other firms maintain positive ratings such as Buy and Outperform.
Akamai Technologies, Inc. Grades
This table summarizes recent grades assigned by established grading companies to Akamai Technologies, Inc.:
| Grading Company | Action | New Grade | Date |
|---|---|---|---|
| Citigroup | Maintain | Neutral | 2026-01-16 |
| Morgan Stanley | Upgrade | Overweight | 2026-01-12 |
| Scotiabank | Maintain | Sector Outperform | 2026-01-09 |
| RBC Capital | Maintain | Sector Perform | 2026-01-05 |
| Piper Sandler | Maintain | Neutral | 2026-01-05 |
| Keybanc | Upgrade | Overweight | 2025-12-15 |
| TD Cowen | Maintain | Hold | 2025-11-13 |
| Citigroup | Maintain | Neutral | 2025-11-11 |
| Scotiabank | Maintain | Sector Outperform | 2025-11-07 |
| Piper Sandler | Maintain | Neutral | 2025-11-07 |
Akamai’s recent grades indicate stability with neutral to sector outperform ratings, alongside upgrades from Morgan Stanley and Keybanc moving the stock to Overweight status.
Which company has the best grades?
Nutanix holds a consensus “Buy” with a significant number of buy ratings despite recent downgrades, whereas Akamai’s consensus is “Hold” with a balanced mix of neutral and outperform grades. Nutanix’s stronger buy consensus could imply higher growth expectations, while Akamai’s stable ratings suggest moderate risk and steady performance.
Strengths and Weaknesses
Below is a comparative overview of the key strengths and weaknesses for Nutanix, Inc. (NTNX) and Akamai Technologies, Inc. (AKAM) based on the most recent financial and operational data.
| Criterion | Nutanix, Inc. (NTNX) | Akamai Technologies, Inc. (AKAM) |
|---|---|---|
| Diversification | Moderate; strong subscription & services mix, less product diversification | Limited product diversification; primarily one reportable segment |
| Profitability | Neutral net margin (7.42%), unfavorable ROE (-27.12%), slightly favorable ROIC (8.11%) | Favorable net margin (12.65%), neutral ROE (10.35%), unfavorable ROIC (4.74%) |
| Innovation | Very favorable economic moat with growing ROIC, signaling durable competitive advantage | Very unfavorable moat with declining ROIC, indicating weakening competitive edge |
| Global presence | Solid presence with scalable cloud solutions | Established global network infrastructure |
| Market Share | Growing subscription revenues reaching $2B in 2024 | Stable revenues at about $4B in 2024 |
Key takeaways: Nutanix shows a durable competitive advantage with strong growth in recurring revenues, though profitability metrics are mixed. Akamai maintains good profitability and a global footprint but faces challenges in sustaining value creation, reflected in its declining ROIC trend. Investors should weigh Nutanix’s growth potential against Akamai’s established market position and current profitability.
Risk Analysis
Below is a comparative risk assessment table for Nutanix, Inc. (NTNX) and Akamai Technologies, Inc. (AKAM) based on the most recent data:
| Metric | Nutanix, Inc. (NTNX) | Akamai Technologies, Inc. (AKAM) |
|---|---|---|
| Market Risk | Moderate volatility, beta 0.49 | Moderate volatility, beta 0.685 |
| Debt level | Moderate debt-to-assets 45.16%, favorable debt/equity ratio | Moderate debt-to-assets 44.7%, neutral debt/equity ratio |
| Regulatory Risk | Moderate, operates globally with diverse regulatory environments | Moderate, global cyber and data regulations impact business |
| Operational Risk | Medium, reliant on cloud infrastructure and software innovation | Medium, exposed to cyber threats and network reliability issues |
| Environmental Risk | Low, primarily software business with limited environmental footprint | Low, similar software focus with limited direct environmental impact |
| Geopolitical Risk | Moderate, global operations face regional risks and trade tensions | Moderate, global clientele exposed to geopolitical instability |
In synthesis, both companies face moderate market and geopolitical risks given their global footprints. Nutanix shows slightly more favorable debt management but is in the distress zone per Altman Z-score, signaling financial vulnerability. Akamai, with a stronger Piotroski score and in the grey zone for bankruptcy risk, appears somewhat more financially stable. Market and operational risks related to technology evolution and cybersecurity are the most impactful for both firms.
Which Stock to Choose?
Nutanix, Inc. (NTNX) shows a favorable income evolution with 18.11% revenue growth in 2025 and a strong global income statement opinion. Its financial ratios are slightly favorable overall, with robust liquidity and efficient asset use, despite a negative return on equity and high P/E. The company demonstrates a very favorable moat rating, indicating durable competitive advantage and value creation.
Akamai Technologies, Inc. (AKAM) presents a mixed income evolution, with moderate growth but an overall unfavorable income statement trend, including declining net margin and EPS over recent years. Its financial ratios are neutral, with solid profitability and interest coverage, though some operational efficiency metrics are less favorable. The company’s moat rating is very unfavorable, reflecting declining profitability and value destruction.
For investors prioritizing growth and competitive advantage, Nutanix’s strong income growth and very favorable moat might appear more attractive. Conversely, investors focused on companies with stable profitability and moderate financial ratios may find Akamai’s profile more fitting, despite its unfavorable moat and income trends. Each stock’s appeal likely depends on the investor’s risk tolerance and strategy preferences.
Disclaimer: Investment carries a risk of loss of initial capital. The past performance is not a reliable indicator of future results. Be sure to understand risks before making an investment decision.
Go Further
I encourage you to read the complete analyses of Nutanix, Inc. and Akamai Technologies, Inc. to enhance your investment decisions: