Akamai Technologies, Inc. and Informatica Inc. are two key players in the software infrastructure industry, each driving innovation in cloud services and data management. Akamai excels in internet security and content delivery, while Informatica leads in AI-powered data integration and governance. Their overlapping markets and distinct approaches make this comparison vital for investors. Let’s explore which company offers the most compelling investment opportunity today.

Table of contents
Companies Overview
I will begin the comparison between Akamai Technologies and Informatica by providing an overview of these two companies and their main differences.
Akamai Technologies Overview
Akamai Technologies, Inc. focuses on delivering cloud services that secure, deliver, and optimize content and business applications across the internet globally. The company provides solutions to protect infrastructure, websites, applications, and users from cyber threats while enhancing web and mobile performance. Akamai also offers media delivery and edge compute services, serving clients through direct sales and channel partners from its headquarters in Cambridge, Massachusetts.
Informatica Overview
Informatica Inc. develops an AI-powered platform that connects, manages, and unifies data across multi-cloud and hybrid environments at enterprise scale. Its suite includes data integration, API management, data quality, master data management, and governance products designed to create accurate, consistent, and compliant data sets for analytics and business insights. Founded in 1993 and based in Redwood City, California, Informatica also provides maintenance and professional services.
Key similarities and differences
Both Akamai and Informatica operate in the technology sector within the software infrastructure industry, offering cloud-related solutions. Akamai specializes in internet content delivery, cybersecurity, and edge computing, focusing on performance and security of digital assets. Informatica centers on data management and integration, emphasizing data quality, governance, and AI-driven unification of enterprise data. While both target enterprise clients, their core offerings address distinct infrastructure challenges.
Income Statement Comparison
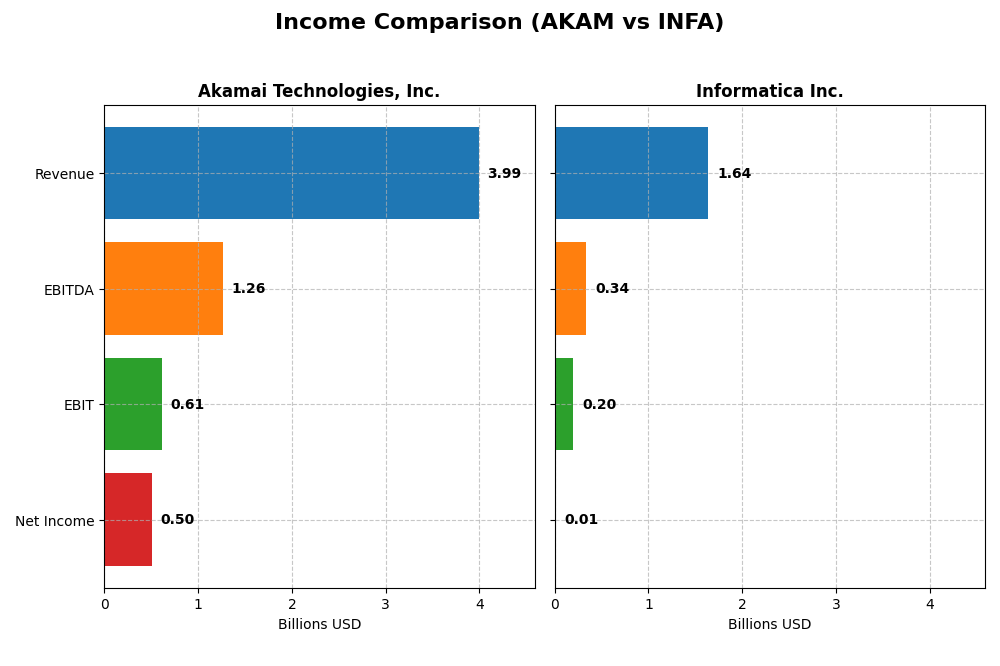
The table below compares the key income statement metrics for Akamai Technologies, Inc. and Informatica Inc. for the fiscal year 2024.
| Metric | Akamai Technologies, Inc. | Informatica Inc. |
|---|---|---|
| Market Cap | 13.4B | 7.5B |
| Revenue | 3.99B | 1.64B |
| EBITDA | 1.26B | 339M |
| EBIT | 614M | 199M |
| Net Income | 505M | 9.9M |
| EPS | 3.34 | 0.033 |
| Fiscal Year | 2024 | 2024 |
Income Statement Interpretations
Akamai Technologies, Inc.
Akamai’s revenue grew steadily by 24.8% from 2020 to 2024, reaching $3.99B in 2024, while net income declined by 9.4% overall, down to $505M. Margins showed mixed trends: the gross margin remained favorable at 59.4%, but net margin slid to 12.7%. In 2024, revenue growth slowed to 4.7%, and net margin contracted by 11.9%, highlighting margin pressure despite stable gross profit.
Informatica Inc.
Informatica’s revenue rose 23.9% over five years, hitting $1.64B in 2024, with net income surging 106% to just under $10M. Margins improved notably; the gross margin was very strong at 80.1%, and net margin modest at 0.61%. The most recent year saw revenue growth slow to 2.8%, but net margin and EPS more than doubled, reflecting improved profitability and operational leverage.
Which one has the stronger fundamentals?
Informatica demonstrates stronger fundamental improvements, with a favorable global income statement opinion, significant net income growth, and rising margins. Akamai, while showing solid revenue gains and stable gross margins, experienced declining net income and margin contractions, resulting in an unfavorable overall evaluation. Informatica’s earnings growth and margin expansion indicate more favorable income statement fundamentals.
Financial Ratios Comparison
The table below presents a comparative overview of key financial ratios for Akamai Technologies, Inc. (AKAM) and Informatica Inc. (INFA) for the fiscal year ending 2024.
| Ratios | Akamai Technologies, Inc. (AKAM) | Informatica Inc. (INFA) |
|---|---|---|
| ROE | 10.35% | 0.43% |
| ROIC | 4.74% | 0.56% |
| P/E | 28.68 | 787.95 |
| P/B | 2.97 | 3.39 |
| Current Ratio | 1.23 | 1.82 |
| Quick Ratio | 1.23 | 1.82 |
| D/E | 0.95 | 0.81 |
| Debt-to-Assets | 44.70% | 35.24% |
| Interest Coverage | 19.67 | 0.87 |
| Asset Turnover | 0.38 | 0.31 |
| Fixed Asset Turnover | 1.33 | 8.75 |
| Payout ratio | 0% | 0.12% |
| Dividend yield | 0% | 0.00015% |
Interpretation of the Ratios
Akamai Technologies, Inc.
Akamai exhibits a balanced financial profile with favorable net margin (12.65%) and interest coverage (22.65), but faces challenges in return on invested capital (4.74%) and asset turnover (0.38). The company maintains a neutral current ratio (1.23) and debt levels. It does not pay dividends, likely prioritizing reinvestment or growth, with no payout concerns.
Informatica Inc.
No ratio data is available for Informatica, preventing an evaluation of its financial strength or risks. The absence of dividend information suggests either a reinvestment focus or a growth phase, yet without key metrics, dividend sustainability or share buyback programs cannot be assessed.
Which one has the best ratios?
Based on available data, Akamai presents a more comprehensive and neutral ratio profile with identifiable strengths and weaknesses. Informatica’s lack of disclosed ratios limits comparison, making Akamai the only company with an evaluable financial stance in this context.
Strategic Positioning
This section compares the strategic positioning of Akamai Technologies, Inc. and Informatica Inc., including market position, key segments, and exposure to technological disruption:
Akamai Technologies, Inc.
- Large market cap (~13.4B USD) in software infrastructure with moderate beta (0.685), facing competitive pressure in cloud security and delivery
- Focus on cloud services for security, content delivery, edge computing, and media delivery; driven by cloud security and web performance
- Exposure to cloud computing and cybersecurity trends; potential disruption from evolving internet security and edge solutions
Informatica Inc.
- Mid-sized market cap (~7.5B USD), higher beta (1.135), competing in AI-powered data management platforms
- Concentrated on AI-driven data integration, API management, data quality, governance, and cloud subscription services
- Exposure to AI and cloud data management innovations; disruption risks in data governance and integration technologies
Akamai vs Informatica Positioning
Akamai shows a diversified approach across cloud security, content delivery, and edge computing, leveraging a broad service portfolio. Informatica focuses more narrowly on AI-powered data management and governance, with a concentrated product suite emphasizing subscription revenue.
Which has the best competitive advantage?
Based on the MOAT evaluation, Akamai has a very unfavorable moat with declining ROIC and value destruction, while Informatica lacks sufficient data for assessment, making Akamai’s competitive advantage currently weak and Informatica’s unclear.
Stock Comparison
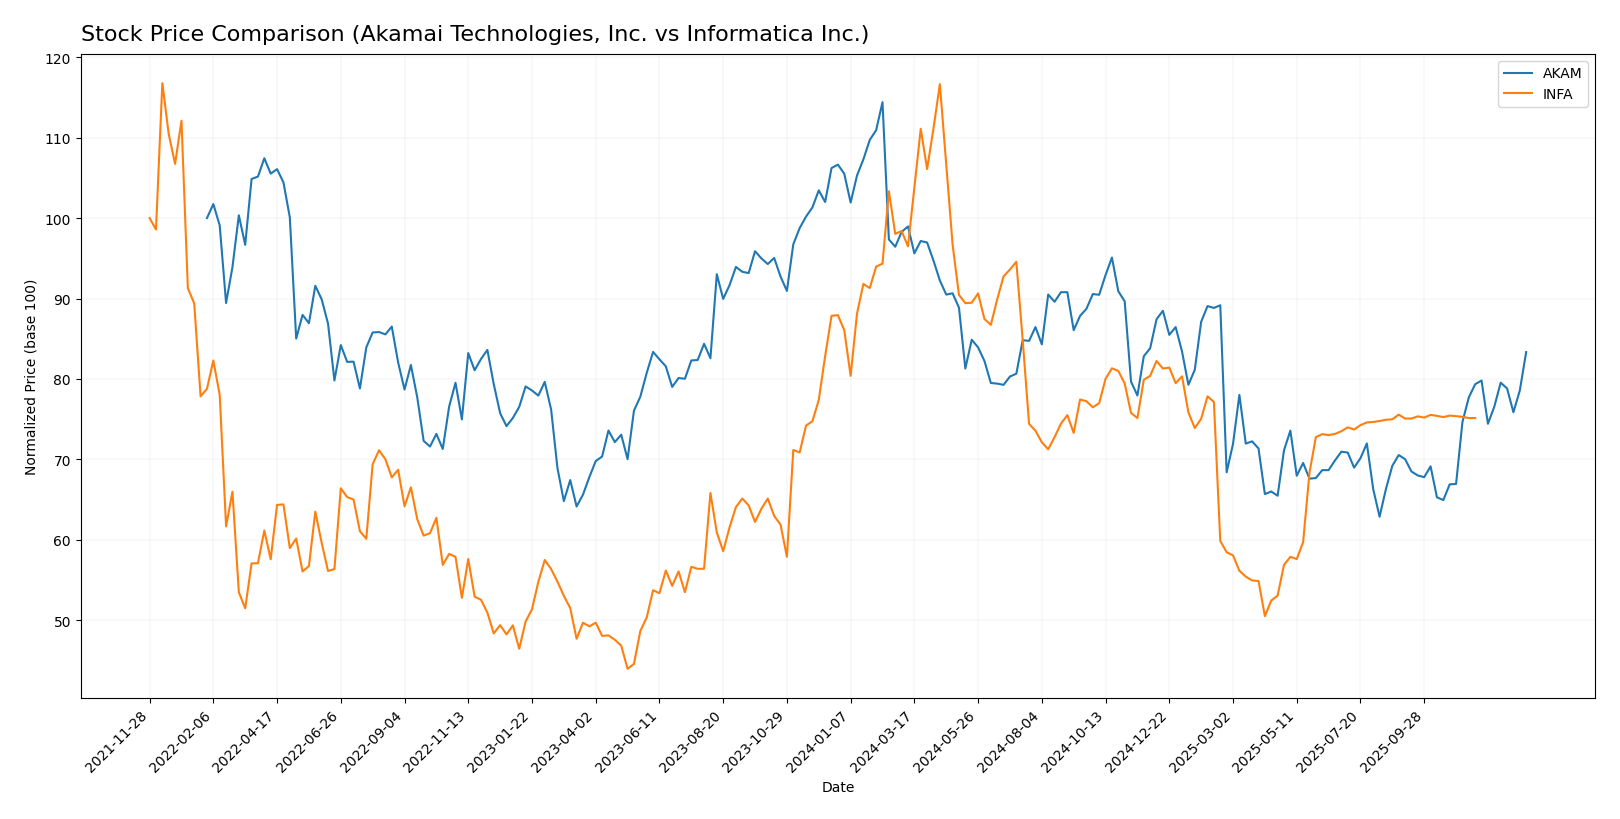
The stock price movements of Akamai Technologies, Inc. (AKAM) and Informatica Inc. (INFA) over the past year reveal contrasting dynamics, with AKAM exhibiting a stronger recent rebound following an overall bearish trend, while INFA shows a prolonged bearish trend with minimal recent price change.
Trend Analysis
Akamai Technologies, Inc. experienced a bearish trend over the past 12 months with a -13.57% price change and accelerating decline, hitting a low of 70.53 and a high of 111.0, though recent weeks show a strong 24.49% rebound.
Informatica Inc. also faced a bearish trend with a -12.68% price change and accelerating decline, ranging between 16.67 and 38.48, but its recent price change was nearly neutral at +0.08%, indicating a stabilization in trend.
Comparing both, AKAM delivered the highest market performance recently due to its notable rebound, despite both companies showing negative overall yearly returns.
Target Prices
The current analyst target price consensus indicates moderate upside potential for these technology infrastructure companies.
| Company | Target High | Target Low | Consensus |
|---|---|---|---|
| Akamai Technologies, Inc. | 115 | 89 | 104.8 |
| Informatica Inc. | 27 | 27 | 27 |
Akamai’s consensus target of 104.8 suggests a roughly 12% upside from its current price of 93.49, reflecting confidence in its cloud security and delivery services. Informatica’s target price at 27 indicates a potential 9% gain from its 24.79 market price, consistent with expectations for growth in AI-powered data management platforms.
Analyst Opinions Comparison
This section compares analysts’ ratings and grades for Akamai Technologies, Inc. and Informatica Inc.:
Rating Comparison
Akamai Rating
- Overall rating is B, classified as Very Favorable.
- Discounted Cash Flow Score is 5, indicating a Very Favorable valuation.
- Return on Equity Score is 3, reflecting a Moderate efficiency in profit generation.
- Return on Assets Score is 3, showing Moderate asset utilization.
- Debt To Equity Score is 1, considered Very Unfavorable due to high financial risk.
- Overall Score is 3, rated as Moderate.
Informatica Rating
- No rating data available.
- No discounted cash flow score provided.
- No ROE score data available.
- No ROA score data available.
- No debt to equity score provided.
- No overall score data available.
Which one is the best rated?
Based on the available data, Akamai holds a Very Favorable overall rating with detailed scores, while Informatica lacks any rating information. Therefore, Akamai is better rated strictly according to these metrics.
Scores Comparison
The scores comparison between Akamai Technologies and Informatica Inc. is as follows:
AKAM Scores
- Altman Z-Score: 2.46, in the grey zone, indicating moderate bankruptcy risk.
- Piotroski Score: 7, classified as strong financial health.
INFA Scores
- Altman Z-Score: 1.94, also in the grey zone, indicating moderate bankruptcy risk.
- Piotroski Score: 6, classified as average financial health.
Which company has the best scores?
Based on the provided data, Akamai Technologies exhibits a higher Piotroski Score, indicating stronger financial health, while both companies share a similar Altman Z-Score within the grey zone. Therefore, Akamai shows relatively better scores overall.
Grades Comparison
Here is a comparison of recent grades assigned to Akamai Technologies, Inc. and Informatica Inc. by reputable grading companies:
Akamai Technologies, Inc. Grades
The table below presents recent grades from notable financial institutions for Akamai Technologies, Inc.:
| Grading Company | Action | New Grade | Date |
|---|---|---|---|
| Citigroup | Maintain | Neutral | 2026-01-16 |
| Morgan Stanley | Upgrade | Overweight | 2026-01-12 |
| Scotiabank | Maintain | Sector Outperform | 2026-01-09 |
| RBC Capital | Maintain | Sector Perform | 2026-01-05 |
| Piper Sandler | Maintain | Neutral | 2026-01-05 |
| Keybanc | Upgrade | Overweight | 2025-12-15 |
| TD Cowen | Maintain | Hold | 2025-11-13 |
| Citigroup | Maintain | Neutral | 2025-11-11 |
| Scotiabank | Maintain | Sector Outperform | 2025-11-07 |
| Piper Sandler | Maintain | Neutral | 2025-11-07 |
Overall, Akamai’s grades show a stable outlook with a mixture of Neutral and Sector Perform ratings, alongside recent upgrades to Overweight by Morgan Stanley and Keybanc.
Informatica Inc. Grades
The table below provides recent grades from recognized grading firms for Informatica Inc.:
| Grading Company | Action | New Grade | Date |
|---|---|---|---|
| Guggenheim | Downgrade | Neutral | 2025-08-07 |
| UBS | Maintain | Neutral | 2025-08-07 |
| Baird | Maintain | Neutral | 2025-05-28 |
| JP Morgan | Downgrade | Neutral | 2025-05-28 |
| RBC Capital | Maintain | Sector Perform | 2025-05-28 |
| Wolfe Research | Downgrade | Peer Perform | 2025-05-28 |
| Wells Fargo | Maintain | Equal Weight | 2025-05-28 |
| Truist Securities | Downgrade | Hold | 2025-05-28 |
| RBC Capital | Maintain | Sector Perform | 2025-05-27 |
| UBS | Maintain | Neutral | 2025-05-16 |
Informatica’s grades reflect mostly neutral or hold ratings with several downgrades, indicating a cautious stance from analysts.
Which company has the best grades?
Akamai Technologies, Inc. holds generally stronger and more positive grades, including recent upgrades to Overweight, compared to Informatica Inc.’s predominantly Neutral and downgraded ratings. This may suggest higher analyst confidence in Akamai’s near-term prospects.
Strengths and Weaknesses
Below is a comparison table highlighting key strengths and weaknesses of Akamai Technologies, Inc. (AKAM) and Informatica Inc. (INFA) based on the most recent available data.
| Criterion | Akamai Technologies, Inc. (AKAM) | Informatica Inc. (INFA) |
|---|---|---|
| Diversification | Focused primarily on content delivery network services with $3.99B revenue in 2024; limited diversification. | Diversified revenue streams: Subscription $1.1B and Professional Services $78M in 2024. |
| Profitability | Net margin 12.65% (favorable); ROIC 4.74% below WACC 6.14% (unfavorable); company destroying value. | Data unavailable for profitability analysis. |
| Innovation | Moderate innovation with stable service offerings; ROIC trend declining -44% indicating challenges in competitive advantage. | Data unavailable for innovation assessment. |
| Global presence | Strong global presence as a major CDN provider. | Global presence supported by cloud and subscription services but specifics not detailed. |
| Market Share | Leader in CDN market but facing margin pressure and declining capital returns. | Growing subscription revenue suggests expanding market share in data management solutions. |
Key takeaways: Akamai shows strengths in profitability margins and global presence but struggles with declining returns on invested capital. Informatica demonstrates diversification with growing subscription services, though detailed financial data is lacking, warranting cautious evaluation.
Risk Analysis
Below is a comparison of key risks for Akamai Technologies, Inc. (AKAM) and Informatica Inc. (INFA) based on the most recent data from 2026.
| Metric | Akamai Technologies, Inc. (AKAM) | Informatica Inc. (INFA) |
|---|---|---|
| Market Risk | Moderate (Beta 0.685, lower volatility) | Higher (Beta 1.135, more volatile) |
| Debt level | Moderate (Debt to equity neutral at 0.95) | Unknown (Data unavailable) |
| Regulatory Risk | Medium (Technology sector, US-focused) | Medium (Technology sector, US-focused) |
| Operational Risk | Moderate (Large scale, 10.8K employees) | Moderate (Smaller scale, 5.2K employees) |
| Environmental Risk | Low (Software infrastructure, limited direct impact) | Low (Software infrastructure, limited direct impact) |
| Geopolitical Risk | Moderate (International operations, US base) | Moderate (US base, global cloud services) |
Akamai shows moderate market and operational risks with balanced debt, but its Altman Z-score in the grey zone (2.46) suggests some financial caution is warranted. Informatica’s higher market beta indicates more price volatility, and missing financial data increases uncertainty. Market risk and financial stability remain the most impactful factors for both, with Akamai slightly more stable but both exposed to sector-wide regulatory and geopolitical challenges.
Which Stock to Choose?
Akamai Technologies, Inc. shows mixed financial results with a 4.7% revenue growth in 2024 but declining net margin and EPS over the period. Its profitability is moderate with a 12.65% net margin and 10.35% ROE, while debt levels and financial ratios are mostly neutral to unfavorable. The company’s rating is very favorable, though its economic moat is very unfavorable due to value destruction and declining ROIC.
Informatica Inc. presents a favorable income statement trend with strong net margin growth of 104.77% overall and positive EPS growth. Its profitability remains low at 0.61% net margin, and key financial ratios data is missing, limiting the full assessment. Its financial scores indicate moderate credit risk with a grey zone Altman Z-Score and average Piotroski Score, and the rating data is unavailable.
Investors seeking growth potential might find Informatica’s improving income metrics appealing, despite limited ratio data, while those prioritizing stability and established ratings might view Akamai’s very favorable rating as a positive, albeit with caution due to its unfavorable moat and profitability trends.
Disclaimer: Investment carries a risk of loss of initial capital. The past performance is not a reliable indicator of future results. Be sure to understand risks before making an investment decision.
Go Further
I encourage you to read the complete analyses of Akamai Technologies, Inc. and Informatica Inc. to enhance your investment decisions: