In the fast-evolving world of software infrastructure, Gen Digital Inc. and Akamai Technologies, Inc. stand out as prominent players. Both companies focus on cybersecurity and cloud services, addressing critical needs in digital safety and content delivery across global markets. Their innovative approaches and overlapping industry segments make them ideal candidates for comparison. Join me as we explore which company presents the most compelling investment opportunity for your portfolio.

Table of contents
Companies Overview
I will begin the comparison between Gen Digital Inc. and Akamai Technologies, Inc. by providing an overview of these two companies and their main differences.
Gen Digital Inc. Overview
Gen Digital Inc. focuses on providing cyber safety solutions for consumers across multiple regions, including the US, Canada, Europe, and Asia Pacific. Its offerings include Norton 360 for malware protection, identity theft solutions, VPN services, and privacy management tools. The company operates in the Software – Infrastructure industry and maintains a market cap of approximately 16.1B USD with around 3,400 full-time employees.
Akamai Technologies, Inc. Overview
Akamai Technologies, Inc. delivers cloud services designed to secure and optimize content and business applications globally. It specializes in cybersecurity, web and mobile performance, media delivery, and edge computing solutions. Akamai is also in the Software – Infrastructure sector, with a market cap near 13.4B USD and a workforce of about 10,811 employees headquartered in Cambridge, Massachusetts.
Key similarities and differences
Both Gen Digital and Akamai operate in the Software – Infrastructure industry and offer cybersecurity-related services, yet their target markets differ: Gen Digital focuses primarily on consumer cyber protection, while Akamai targets enterprise-level cloud security and content delivery. They also vary in scale, with Akamai employing more than triple the staff of Gen Digital, reflecting its broader service scope and international reach.
Income Statement Comparison
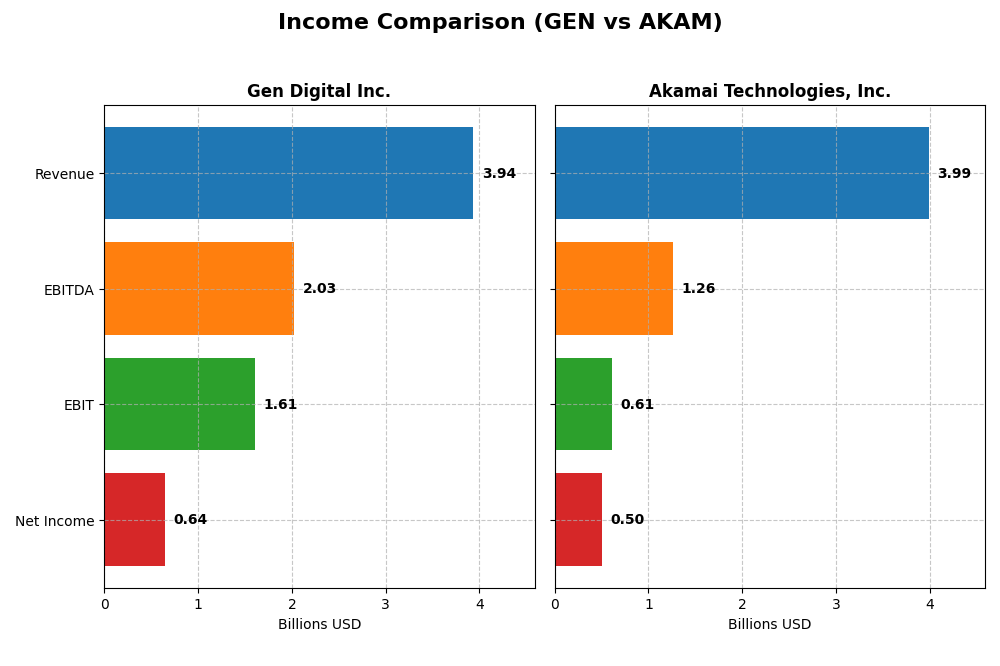
This table compares key income statement metrics for Gen Digital Inc. and Akamai Technologies, Inc. for their most recent fiscal years, helping investors assess their financial performance side by side.
| Metric | Gen Digital Inc. (GEN) | Akamai Technologies, Inc. (AKAM) |
|---|---|---|
| Market Cap | 16.1B | 13.4B |
| Revenue | 3.94B | 3.99B |
| EBITDA | 2.03B | 1.26B |
| EBIT | 1.61B | 0.61B |
| Net Income | 643M | 505M |
| EPS | 1.04 | 3.34 |
| Fiscal Year | 2025 | 2024 |
Income Statement Interpretations
Gen Digital Inc.
Gen Digital Inc. shows a steady revenue growth over 2021-2025, rising from $2.55B to $3.94B, with net income increasing from $554M to $643M. Margins remain strong, with a favorable gross margin at 80.28% and EBIT margin at 40.84%. The 2025 fiscal year saw a moderate 3.55% revenue growth and a 44% EBIT surge, indicating improved profitability despite a slight net margin contraction.
Akamai Technologies, Inc.
Akamai Technologies experienced moderate revenue growth from $3.20B in 2020 to $3.99B in 2024, but net income declined from $557M to $505M. Margins are stable but lower than Gen Digital’s, with a gross margin of 59.39% and EBIT margin of 15.39%. The 2024 year showed a 4.7% revenue increase but declines in EBIT (-8.37%) and net margin (-11.94%), pointing to margin pressure and reduced profitability.
Which one has the stronger fundamentals?
Gen Digital presents stronger fundamentals with a higher proportion of favorable income statement metrics (64.29% favorable vs. 35.71% for Akamai). Its robust margins and positive EBIT and EPS growth contrast with Akamai’s unfavorable trends in profitability and net income over the recent period. However, Gen Digital faces higher interest expenses, a factor to monitor alongside its growth dynamics.
Financial Ratios Comparison
The table below presents the most recent financial ratios for Gen Digital Inc. (GEN) and Akamai Technologies, Inc. (AKAM) based on their latest fiscal year data.
| Ratios | Gen Digital Inc. (2025) | Akamai Technologies, Inc. (2024) |
|---|---|---|
| ROE | 28.3% | 10.4% |
| ROIC | 7.8% | 4.7% |
| P/E | 25.4 | 28.7 |
| P/B | 7.19 | 2.97 |
| Current Ratio | 0.51 | 1.23 |
| Quick Ratio | 0.51 | 1.23 |
| D/E | 3.66 | 0.95 |
| Debt-to-Assets | 53.7% | 44.7% |
| Interest Coverage | 2.79 | 19.7 |
| Asset Turnover | 0.25 | 0.38 |
| Fixed Asset Turnover | 36.1 | 1.33 |
| Payout Ratio | 48.7% | 0% |
| Dividend Yield | 1.92% | 0% |
Interpretation of the Ratios
Gen Digital Inc.
Gen Digital presents a mixed financial profile with strong profitability ratios, including a favorable net margin of 16.34% and a high return on equity (ROE) of 28.34%. However, liquidity ratios like the current ratio at 0.51 and leverage metrics such as debt-to-equity of 3.66 are unfavorable, indicating potential solvency risks. The company pays a dividend with a 1.92% yield, supported moderately by free cash flow, but payout sustainability should be monitored given some financial constraints.
Akamai Technologies, Inc.
Akamai shows a balanced ratio set with a favorable net margin of 12.65% and very strong interest coverage at 22.65, reflecting good debt servicing capacity. Liquidity ratios are neutral to favorable, with a current ratio of 1.23 and quick ratio also at 1.23. Akamai does not pay dividends, presumably prioritizing reinvestment and growth, which aligns with its neutral ROE of 10.35% and ongoing investments in R&D and infrastructure.
Which one has the best ratios?
Comparing both, Akamai holds a more neutral and stable financial position with fewer unfavorable ratios and better liquidity. In contrast, Gen Digital has higher profitability but faces significant liquidity and leverage concerns, creating a slightly unfavorable overall ratio profile. Thus, Akamai’s ratios indicate lower financial risk, while Gen Digital shows higher return potentials with increased risk.
Strategic Positioning
This section compares the strategic positioning of Gen Digital Inc. and Akamai Technologies, Inc., focusing on market position, key segments, and exposure to technological disruption:
Gen Digital Inc.
- Market leader in consumer cyber safety with moderate beta; faces competition in software infrastructure.
- Key segments include cyber safety products and identity theft protection driving revenues around 3.9B USD.
- Exposed to evolving cyber threats requiring continuous innovation in consumer cybersecurity solutions.
Akamai Technologies, Inc.
- Provides cloud security and content delivery; lower beta suggests less volatility amid competition.
- Focuses on cloud services for security, content delivery, and edge compute; 4B USD in reportable segment.
- Faces technological disruption in cloud security and edge computing; invests in performance and analytics.
Gen Digital Inc. vs Akamai Technologies, Inc. Positioning
Gen Digital pursues a concentrated focus on consumer cyber safety and identity protection, benefiting from specialized product offerings but limited diversification. Akamai operates with broader cloud and edge computing services, offering diversified business drivers but facing complex technological shifts.
Which has the best competitive advantage?
Both companies exhibit very unfavorable MOAT evaluations with declining ROIC trends and value destruction, indicating weak competitive advantages and challenges sustaining profitability based on the latest financial assessments.
Stock Comparison
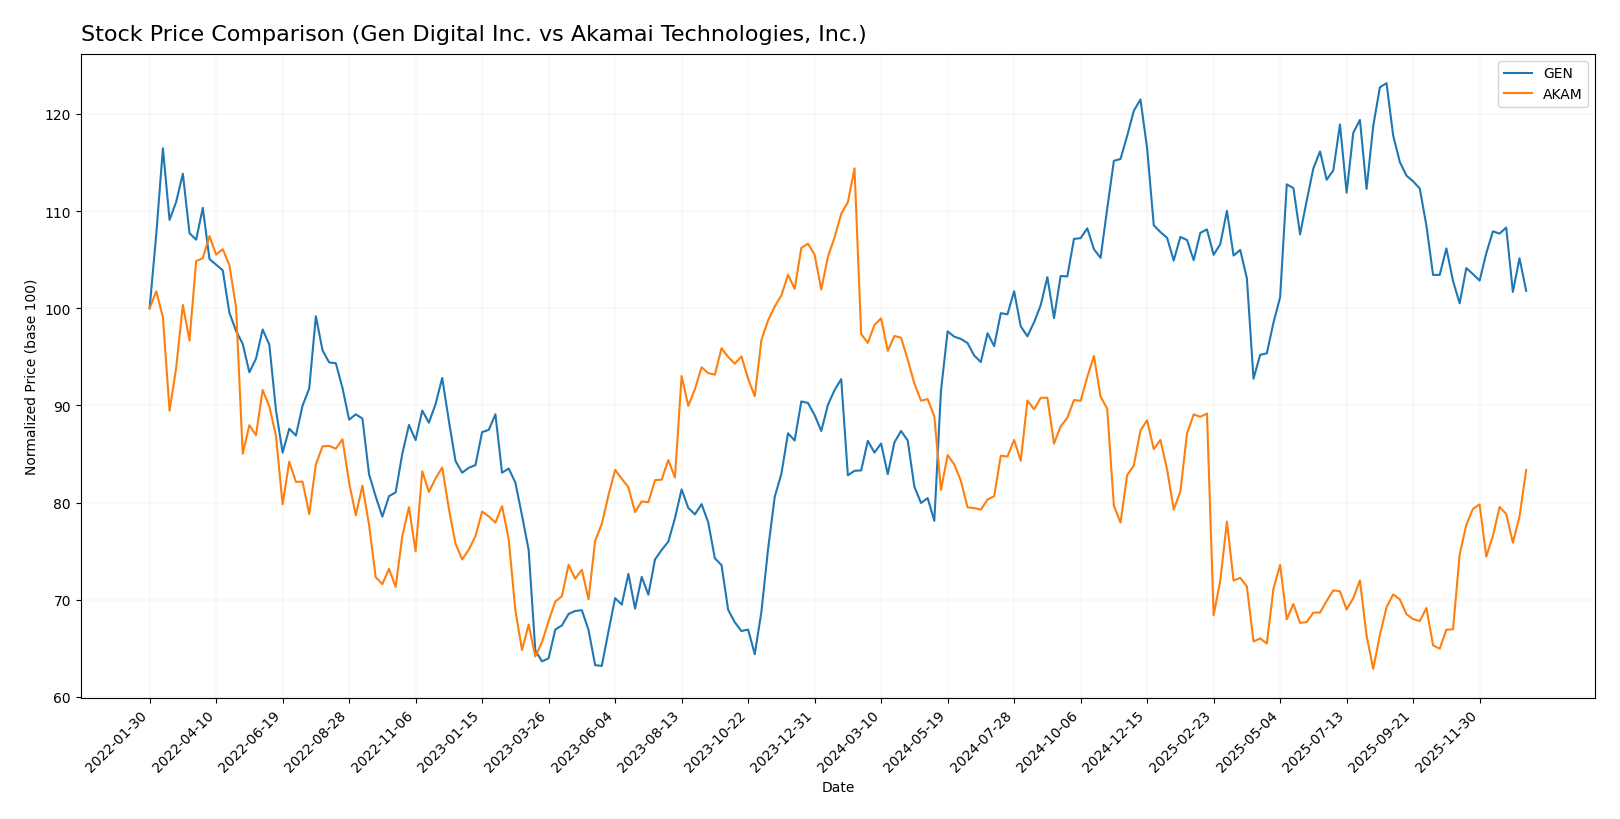
The stock price movements of Gen Digital Inc. (GEN) and Akamai Technologies, Inc. (AKAM) over the past 12 months reveal contrasting trends, with GEN exhibiting steady gains amid decelerating momentum, while AKAM shows a sharper decline but recent strong recovery in buyer dominance.
Trend Analysis
Gen Digital Inc. (GEN) experienced a 17.89% price increase over the last year, indicating a bullish trend with decelerating momentum. The stock ranged between 20.03 and 31.58, with moderate volatility (std deviation 2.59).
Akamai Technologies, Inc. (AKAM) recorded a 13.57% decline over the same period, reflecting a bearish trend with accelerating downward pressure. Price volatility was high (std deviation 10.92), with prices fluctuating between 70.53 and 111.0.
Comparing both, GEN delivered the highest market performance over the past 12 months, reversing recent minor declines, while AKAM showed a recent strong positive price change but overall underperformed year-to-date.
Target Prices
The current analyst consensus indicates promising upside potential for both Gen Digital Inc. and Akamai Technologies, Inc.
| Company | Target High | Target Low | Consensus |
|---|---|---|---|
| Gen Digital Inc. | 32 | 31 | 31.5 |
| Akamai Technologies, Inc. | 115 | 89 | 104.8 |
Analysts expect Gen Digital’s stock to rise modestly from its current price of 26.1 to around 31.5, while Akamai’s stock shows strong upside potential from 93.49 to a consensus near 104.8.
Analyst Opinions Comparison
This section compares analysts’ ratings and grades for Gen Digital Inc. and Akamai Technologies, Inc.:
Rating Comparison
GEN Rating
- Rating: Both have a “B” rating, considered very favorable.
- Discounted Cash Flow Score: 5, very favorable indicating good valuation.
- ROE Score: 5, very favorable showing efficient profit generation.
- ROA Score: 3, moderate asset utilization.
- Debt To Equity Score: 1, very unfavorable due to high financial risk.
- Overall Score: 3, moderate overall financial standing.
AKAM Rating
- Rating: Both have a “B” rating, considered very favorable.
- Discounted Cash Flow Score: 5, very favorable indicating good valuation.
- ROE Score: 3, moderate efficiency in profit generation.
- ROA Score: 3, moderate asset utilization.
- Debt To Equity Score: 1, very unfavorable due to high financial risk.
- Overall Score: 3, moderate overall financial standing.
Which one is the best rated?
Both GEN and AKAM share the same overall rating “B” and overall score of 3, indicating a moderate financial position. GEN has stronger return on equity, while AKAM has a better price-to-book score (not shown here), but both carry high financial risk with low debt-to-equity scores.
Scores Comparison
The following table compares the Altman Z-Score and Piotroski Score of Gen Digital Inc. and Akamai Technologies, Inc.:
Gen Digital Inc. Scores
- Altman Z-Score: 1.25, in distress zone indicating high bankruptcy risk.
- Piotroski Score: 6, average financial strength.
Akamai Technologies, Inc. Scores
- Altman Z-Score: 2.46, in grey zone indicating moderate bankruptcy risk.
- Piotroski Score: 7, strong financial strength.
Which company has the best scores?
Akamai shows better financial stability with a higher Altman Z-Score in the grey zone and a stronger Piotroski Score than Gen Digital, which is in distress and has average financial strength.
Grades Comparison
Here is a comparison of the recent grades assigned to Gen Digital Inc. and Akamai Technologies, Inc.:
Gen Digital Inc. Grades
The following table summarizes recent grades from established grading companies for Gen Digital Inc.:
| Grading Company | Action | New Grade | Date |
|---|---|---|---|
| RBC Capital | Maintain | Sector Perform | 2025-11-07 |
| Evercore ISI Group | Maintain | Outperform | 2025-11-07 |
| Morgan Stanley | Maintain | Equal Weight | 2025-09-02 |
| Barclays | Maintain | Equal Weight | 2025-08-08 |
| Wells Fargo | Maintain | Overweight | 2025-08-08 |
| RBC Capital | Maintain | Sector Perform | 2025-08-08 |
| Barclays | Maintain | Equal Weight | 2025-07-14 |
| RBC Capital | Maintain | Sector Perform | 2025-05-07 |
| Morgan Stanley | Maintain | Equal Weight | 2025-04-16 |
| RBC Capital | Maintain | Sector Perform | 2025-01-31 |
The grades for Gen Digital Inc. mostly range between Sector Perform and Equal Weight, indicating a stable but cautious outlook with occasional Outperform and Overweight ratings.
Akamai Technologies, Inc. Grades
The following table presents recent grades from verified grading companies for Akamai Technologies, Inc.:
| Grading Company | Action | New Grade | Date |
|---|---|---|---|
| Citigroup | Maintain | Neutral | 2026-01-16 |
| Morgan Stanley | Upgrade | Overweight | 2026-01-12 |
| Scotiabank | Maintain | Sector Outperform | 2026-01-09 |
| RBC Capital | Maintain | Sector Perform | 2026-01-05 |
| Piper Sandler | Maintain | Neutral | 2026-01-05 |
| Keybanc | Upgrade | Overweight | 2025-12-15 |
| TD Cowen | Maintain | Hold | 2025-11-13 |
| Citigroup | Maintain | Neutral | 2025-11-11 |
| Scotiabank | Maintain | Sector Outperform | 2025-11-07 |
| Piper Sandler | Maintain | Neutral | 2025-11-07 |
Grades for Akamai show a positive trend with recent upgrades to Overweight and consistent Sector Outperform ratings alongside Neutral assessments.
Which company has the best grades?
Gen Digital Inc. holds a consensus “Buy” with numerous Buy ratings but mostly stable grades around Sector Perform and Equal Weight. Akamai carries a consensus “Hold” yet shows recent upgrades and more frequent Overweight and Sector Outperform grades. Investors may interpret Akamai’s improving grades as a signal of potential upward momentum, whereas Gen Digital’s steady but moderate grades suggest a more cautious outlook.
Strengths and Weaknesses
Below is a comparison of key strengths and weaknesses for Gen Digital Inc. (GEN) and Akamai Technologies, Inc. (AKAM) based on the most recent financial and operational data.
| Criterion | Gen Digital Inc. (GEN) | Akamai Technologies, Inc. (AKAM) |
|---|---|---|
| Diversification | Strong in Cyber Safety with $3.9B revenue; Legacy segment minimal ($50M) | Single main segment with $3.99B revenue; less diversified |
| Profitability | Net margin 16.34% (favorable), ROE 28.34% (favorable), ROIC 7.77% (neutral) | Net margin 12.65% (favorable), ROE 10.35% (neutral), ROIC 4.74% (unfavorable) |
| Innovation | Declining ROIC trend, value destroying (Very Unfavorable moat) | Declining ROIC trend, value destroying (Very Unfavorable moat) |
| Global presence | Established, but financial health impacted by high debt (D/E 3.66, unfavorable) | Moderate debt levels (D/E 0.95), better interest coverage |
| Market Share | Strong in consumer security niche but challenged by valuation metrics (PE 25.36, PB 7.19 unfavorable) | Competitive positioning with neutral PB (2.97) but high PE (28.68 unfavorable) |
Key takeaways: Both companies face significant challenges with declining ROIC indicating deteriorating profitability and value destruction. Gen Digital shows stronger profitability margins but struggles with leverage and liquidity. Akamai is financially more stable but with weaker profitability and no dividend yield. Investors should weigh these risks carefully.
Risk Analysis
Below is a comparison of key risks faced by Gen Digital Inc. and Akamai Technologies, Inc. based on the most recent data available:
| Metric | Gen Digital Inc. | Akamai Technologies, Inc. |
|---|---|---|
| Market Risk | Moderate (Beta 1.08) | Lower (Beta 0.69) |
| Debt level | High (Debt/Equity 3.66; Debt/Assets 53.7%) | Moderate (Debt/Equity 0.95; Debt/Assets 44.7%) |
| Regulatory Risk | Moderate, cybersecurity regulations evolving | Moderate, cloud security compliance evolving |
| Operational Risk | Product integration and competition in cybersecurity | Service reliability and scaling cloud infrastructure |
| Environmental Risk | Low impact, primarily software business | Low impact, primarily software business |
| Geopolitical Risk | Moderate, global customer base exposure | Moderate, global content delivery exposure |
Gen Digital faces more significant financial leverage risk with high debt levels and liquidity concerns, while Akamai’s lower beta indicates less market volatility risk. Both operate in highly regulated cybersecurity and cloud sectors, where rapid technology changes and compliance requirements pose ongoing challenges. Gen Digital’s Altman Z-score signals financial distress risk, demanding caution.
Which Stock to Choose?
Gen Digital Inc. (GEN) shows a favorable income statement with steady revenue growth of 3.55% in the last year and strong profitability indicators such as a 16.34% net margin and 28.34% ROE. However, its financial ratios reveal mixed signals, including high debt levels (debt-to-equity 3.66) and low liquidity (current ratio 0.51), leading to a slightly unfavorable overall ratio evaluation. Its rating is very favorable with a “B” grade, but its MOAT analysis indicates value destruction due to declining ROIC below WACC.
Akamai Technologies, Inc. (AKAM) presents a neutral income evolution with a 4.7% revenue growth last year but declining profitability metrics and an unfavorable net margin growth. Its financial ratios are balanced, showing moderate debt (debt-to-equity 0.95), good liquidity (current ratio 1.23), and an overall neutral ratio evaluation. AKAM holds a similar very favorable rating “B,” yet its MOAT also signals value destruction with diminishing ROIC beneath WACC.
Investors focused on growth and profitability might find GEN appealing given its favorable income statement and high ROE, despite leverage concerns. Conversely, those prioritizing financial stability and moderate risk exposure may see AKAM’s balanced ratios and liquidity as more fitting, though both companies face challenges with declining value creation as indicated by their MOAT evaluations.
Disclaimer: Investment carries a risk of loss of initial capital. The past performance is not a reliable indicator of future results. Be sure to understand risks before making an investment decision.
Go Further
I encourage you to read the complete analyses of Gen Digital Inc. and Akamai Technologies, Inc. to enhance your investment decisions: