Home > Comparison > Technology > FTNT vs AKAM
The strategic rivalry between Fortinet, Inc. and Akamai Technologies, Inc. shapes the evolution of the software infrastructure sector. Fortinet operates as a cybersecurity solutions powerhouse with integrated hardware and software offerings. Akamai focuses on cloud-based content delivery and internet security services, emphasizing performance optimization. This analysis contrasts Fortinet’s security-driven growth with Akamai’s cloud service model to identify the superior risk-adjusted investment for a diversified portfolio.
Table of contents
Companies Overview
Fortinet and Akamai represent two heavyweight contenders in the cybersecurity and cloud infrastructure arena.
Fortinet, Inc.: Cybersecurity Powerhouse
Fortinet dominates the cybersecurity space with its broad portfolio of integrated hardware and software solutions. Its core revenue engine revolves around FortiGate firewalls and security subscriptions that protect networks worldwide. In 2026, Fortinet focuses strategically on expanding automated cybersecurity services and scaling its secure switching and wireless networking products.
Akamai Technologies, Inc.: Cloud and Edge Innovator
Akamai leads in cloud services that secure and optimize internet content delivery. Its primary revenue driver is cloud-based cybersecurity and performance solutions, including edge computing and media delivery. Akamai’s 2026 strategy centers on enhancing edge compute capabilities and expanding its cybersecurity protection across distributed networks.
Strategic Collision: Similarities & Divergences
Both compete in securing digital infrastructure but differ fundamentally: Fortinet builds a closed ecosystem of integrated security appliances, while Akamai pursues an open, cloud-centric model emphasizing edge computing. Their battleground lies in enterprise cybersecurity and internet performance optimization. Fortinet’s investment profile leans toward hardware-driven security innovation; Akamai’s favors scalable cloud services and edge technology expansion.
Income Statement Comparison
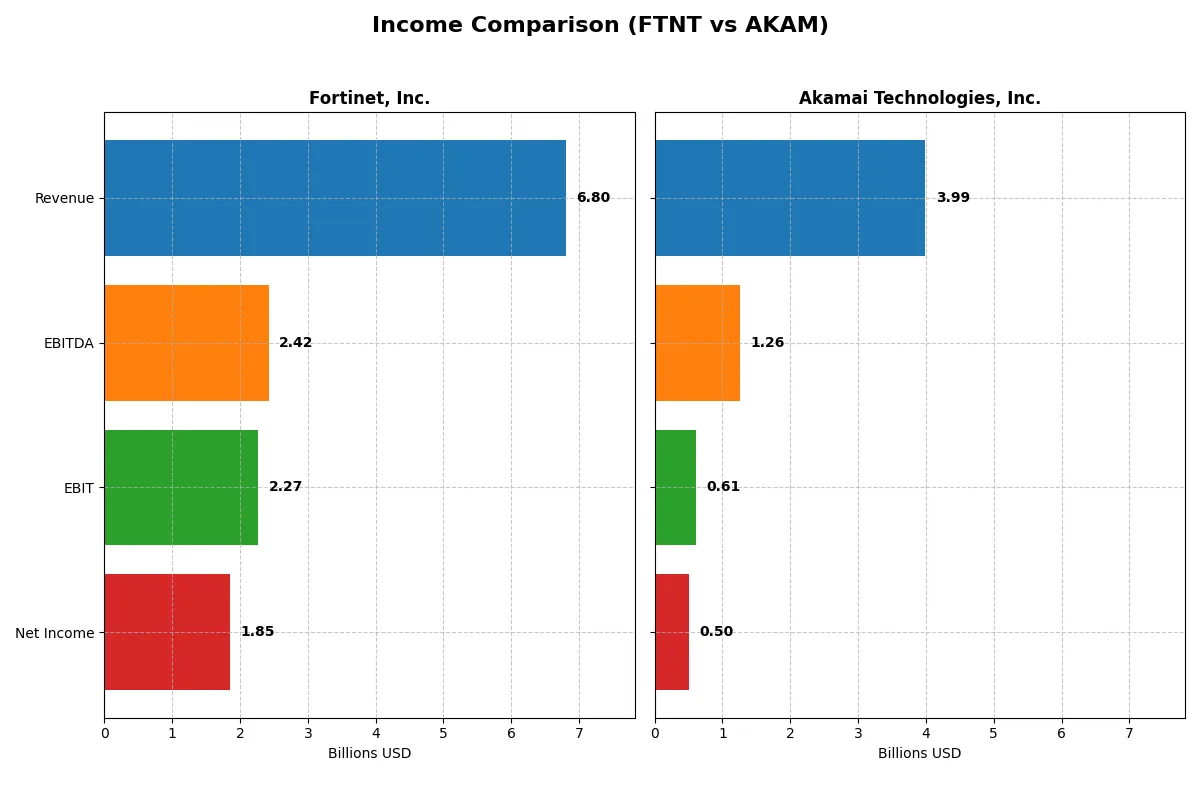
This data dissects the core profitability and scalability of both corporate engines to reveal who dominates the bottom line:
| Metric | Fortinet, Inc. (FTNT) | Akamai Technologies, Inc. (AKAM) |
|---|---|---|
| Revenue | 6.8B | 4.0B |
| Cost of Revenue | 1.3B | 1.6B |
| Operating Expenses | 3.4B | 1.8B |
| Gross Profit | 5.5B | 2.4B |
| EBITDA | 2.4B | 1.3B |
| EBIT | 2.3B | 614M |
| Interest Expense | 20M | 27M |
| Net Income | 1.9B | 505M |
| EPS | 2.44 | 3.34 |
| Fiscal Year | 2025 | 2024 |
Income Statement Analysis: The Bottom-Line Duel
This income statement comparison reveals which company operates its business engine most efficiently and delivers superior financial performance.
Fortinet, Inc. Analysis
Fortinet’s revenue surged from 3.3B in 2021 to nearly 6.8B in 2025, with net income tripling to 1.85B. Its gross margin remains robust above 80%, while net margin holds a strong 27.3%. The 2025 year highlights impressive revenue growth (14%) and EBIT momentum (9%), signaling operational efficiency and scalable profitability.
Akamai Technologies, Inc. Analysis
Akamai’s revenue grew modestly from 3.2B in 2020 to just under 4B in 2024. Net income declined slightly to 505M in 2024, reflecting margin pressures. Gross margin stands at 59.4%, and net margin at 12.7%, both considerably lower than peers. The latest year shows flat revenue growth and contraction in EBIT (-8%) and net margin (-12%), indicating operational challenges.
Verdict: Margin Power vs. Revenue Scale
Fortinet clearly dominates with superior margin expansion and robust growth in revenue and net income. Akamai’s slower growth and declining profitability contrast sharply. For investors prioritizing earnings quality and scalable growth, Fortinet’s profile offers a more compelling fundamental foundation.
Financial Ratios Comparison
These vital ratios act as a diagnostic tool to expose the underlying fiscal health, valuation premiums, and capital efficiency of the companies compared:
| Ratios | Fortinet, Inc. (FTNT) | Akamai Technologies, Inc. (AKAM) |
|---|---|---|
| ROE | 1.50 | 0.10 |
| ROIC | 0.29 | 0.05 |
| P/E | 32.48 | 28.68 |
| P/B | 48.64 | 2.97 |
| Current Ratio | 1.17 | 1.23 |
| Quick Ratio | 1.09 | 1.23 |
| D/E | 0.81 | 0.95 |
| Debt-to-Assets | 0.10 | 0.45 |
| Interest Coverage | 103.72 | 19.67 |
| Asset Turnover | 0.65 | 0.38 |
| Fixed Asset Turnover | 4.20 | 1.33 |
| Payout ratio | 0 | 0 |
| Dividend yield | 0 | 0 |
| Fiscal Year | 2025 | 2024 |
Efficiency & Valuation Duel: The Vital Signs
Financial ratios act as a company’s DNA, unmasking hidden risks and operational strengths that define its true market position.
Fortinet, Inc.
Fortinet displays exceptional profitability with a 149.77% ROE and robust 27.26% net margin, highlighting operational excellence. However, its valuation appears stretched, marked by a high 32.48 P/E and 48.64 P/B ratios. The company retains earnings to fuel growth through R&D, as it does not currently offer dividends, signaling a long-term reinvestment strategy.
Akamai Technologies, Inc.
Akamai shows moderate profitability, with a 10.35% ROE and 12.65% net margin, indicating steady but less dynamic returns. The stock trades at a 28.68 P/E, somewhat expensive relative to its modest ROIC of 4.74%. Akamai also refrains from dividends, likely channeling cash into operational improvements and growth, balancing shareholder returns cautiously.
Premium Valuation vs. Operational Safety
Fortinet’s ratios reflect superior profitability but come with a premium valuation that elevates risk. Akamai offers a more conservative profile with neutral valuation but weaker returns. Investors seeking aggressive growth might prefer Fortinet’s profile; cautious investors may gravitate toward Akamai’s stability.
Which one offers the Superior Shareholder Reward?
Fortinet and Akamai both skip dividends, focusing on reinvestment and buybacks. Fortinet’s payout ratio is zero, but it sustains robust free cash flow of $2.94/share with high operating margins near 30%. Akamai matches zero dividend payout but shows a weaker free cash flow conversion at 55%. Akamai trades at a lower EV multiple (14.7x) versus Fortinet’s 22.9x, reflecting its slower growth and higher leverage (debt-to-assets 44.7% vs. Fortinet’s 9.6%). Buyback intensity favors Fortinet, which leverages strong cash flow and financial discipline to repurchase shares aggressively. I view Fortinet’s distribution model—zero dividends, high free cash flow, and active buybacks—as more sustainable and superior for long-term total returns in 2026.
Comparative Score Analysis: The Strategic Profile
The radar chart reveals the fundamental DNA and trade-offs of Fortinet and Akamai, highlighting their strategic strengths and weaknesses across key financial metrics:
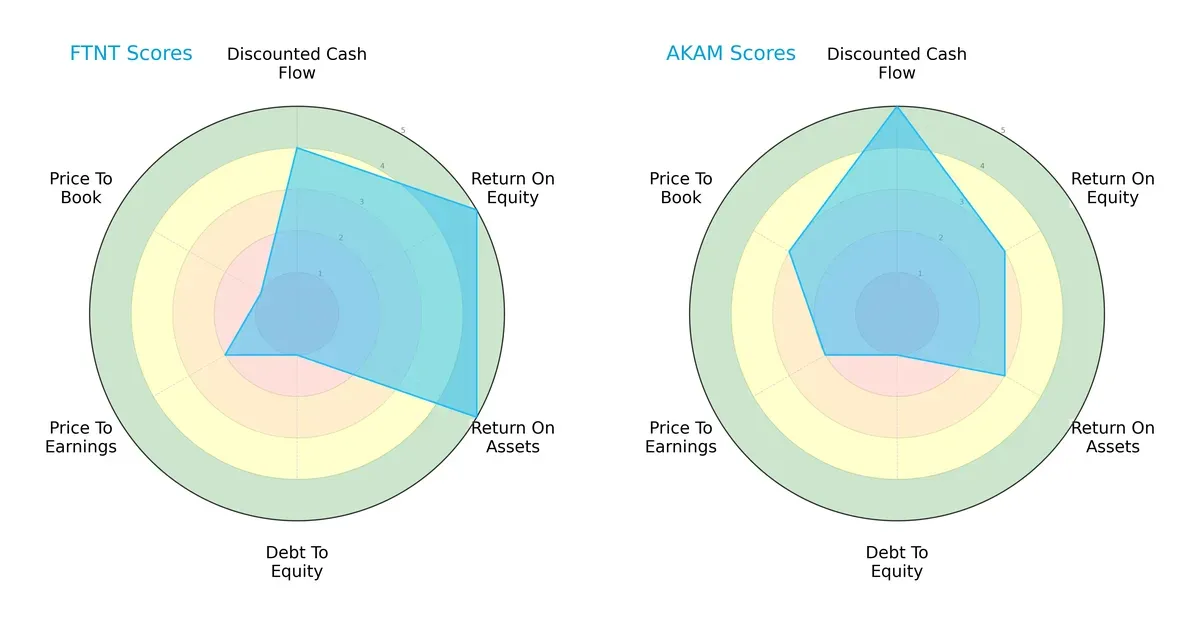
Fortinet excels in return on equity and assets, showing operational efficiency. Akamai leads in discounted cash flow valuation and has a better price-to-book ratio, indicating relative undervaluation. Both suffer from high debt levels. Fortinet’s profile relies on profitability dominance, while Akamai offers a more balanced valuation approach.
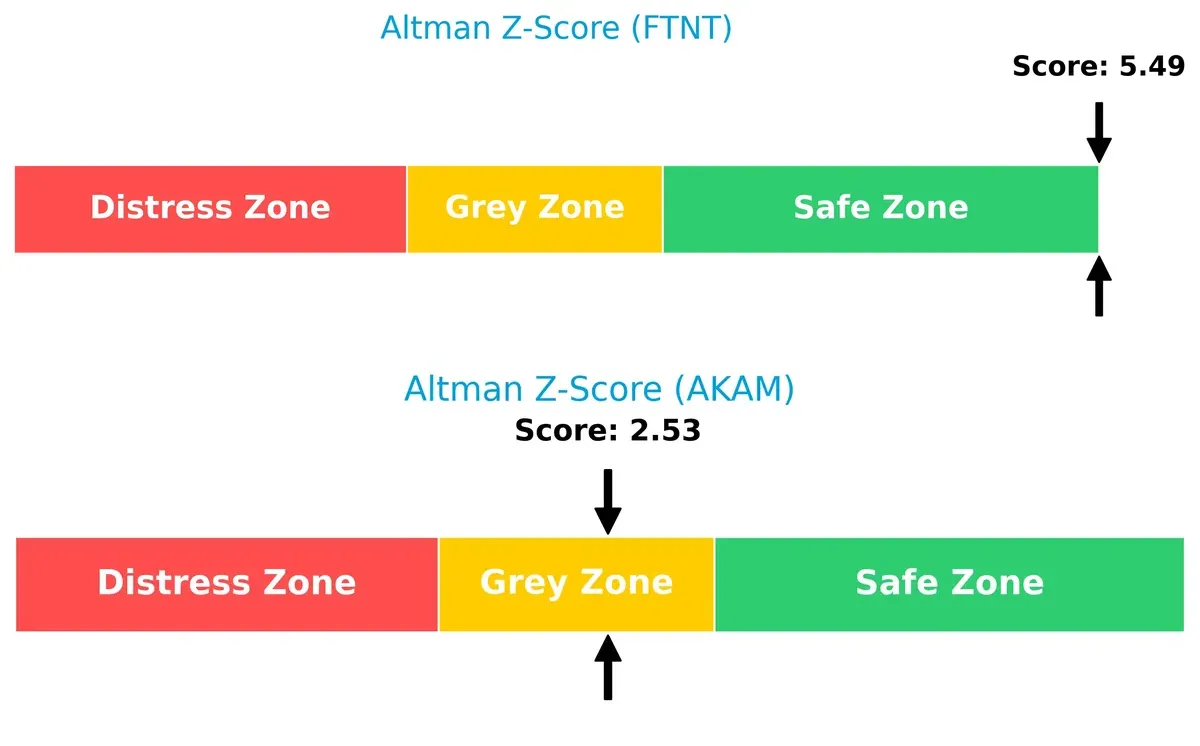
Bankruptcy Risk: Solvency Showdown
Fortinet’s Altman Z-Score of 5.49 places it firmly in the safe zone, signaling strong solvency. Akamai’s 2.53 falls in the grey zone, implying moderate financial risk in this cycle:
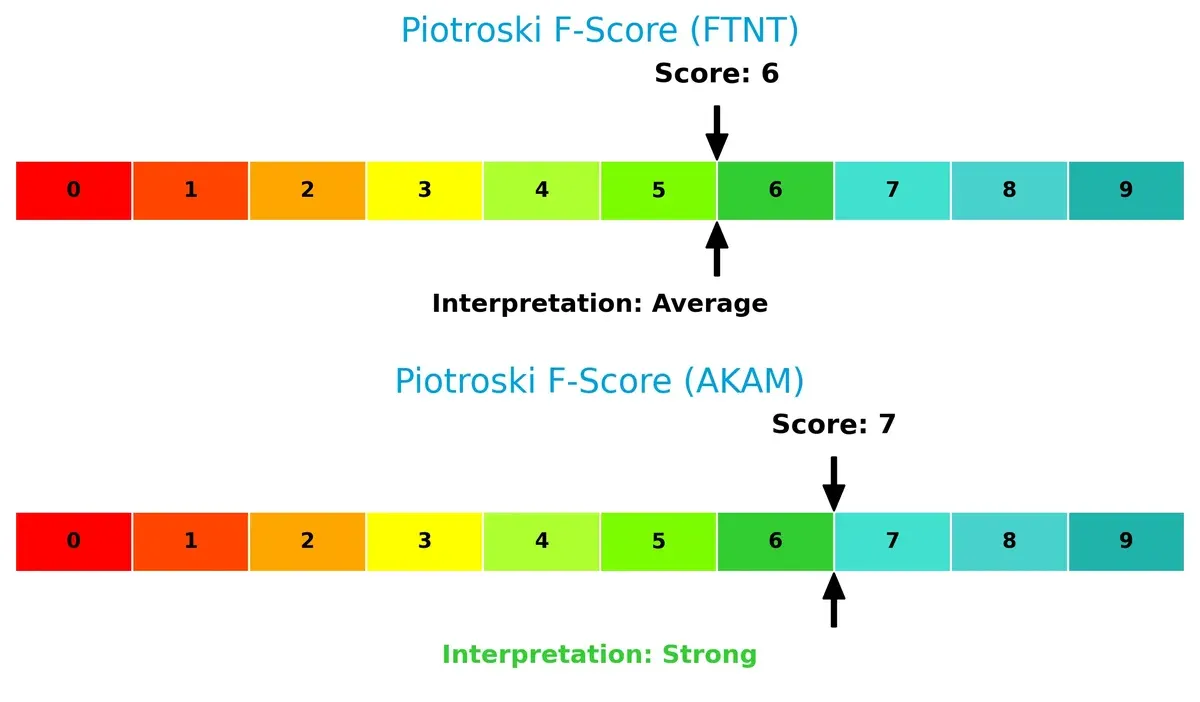
Financial Health: Quality of Operations
Akamai’s Piotroski F-Score of 7 outperforms Fortinet’s 6, indicating stronger internal financial health and fewer red flags in operational metrics:
How are the two companies positioned?
This section dissects the operational DNA of Fortinet and Akamai by comparing their revenue distribution across segments and analyzing their internal strengths and weaknesses. The goal is to confront their economic moats to reveal which model delivers the most resilient, sustainable competitive advantage today.
Revenue Segmentation: The Strategic Mix
The following visual comparison dissects how Fortinet, Inc. and Akamai Technologies, Inc. diversify their income streams and where their primary sector bets lie:
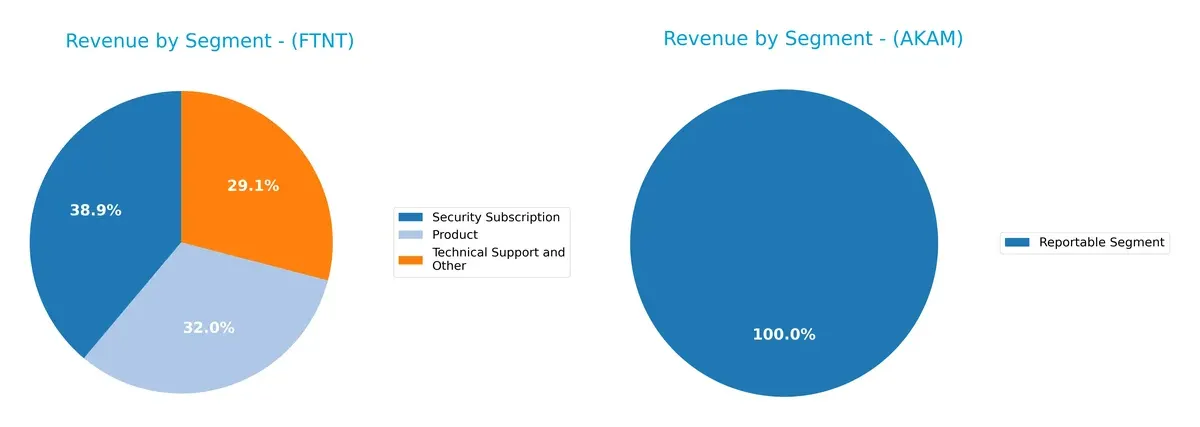
Fortinet shows a balanced revenue mix with Security Subscription at $2.3B, Products at $1.9B, and Technical Support at $1.7B. Akamai reveals no segment breakdown, reporting $3.99B in a single category. Fortinet’s diversified model anchors resilience and ecosystem lock-in. Akamai’s undifferentiated revenue hints at concentration risk or infrastructure dominance without clear diversification.
Strengths and Weaknesses Comparison
This table compares the strengths and weaknesses of Fortinet, Inc. and Akamai Technologies, Inc.:
Fortinet Strengths
- High net margin of 27.26%
- Strong ROE at 149.77%
- ROIC of 28.76% exceeds WACC
- Favorable quick ratio of 1.09
- Low debt-to-assets at 9.59%
- Robust fixed asset turnover of 4.2
- Diversified revenue streams across products and services
- Broad global presence with balanced regional sales
Akamai Strengths
- Favorable net margin at 12.65%
- WACC lower than Fortinet at 6.23%
- Favorable quick ratio of 1.23
- Interest coverage of 22.65
- Moderate P/B ratio at 2.97
- Significant US and Non-US revenue base
- Consistent global market presence
Fortinet Weaknesses
- Unfavorable P/E of 32.48 and P/B of 48.64 suggest high valuation
- Zero dividend yield
- Neutral current ratio of 1.17
- Moderate debt/equity of 0.81
- Asset turnover neutral at 0.65
- No dividend yield
Akamai Weaknesses
- Low ROIC at 4.74% below WACC
- Unfavorable asset turnover of 0.38
- Neutral P/B at 2.97 but P/E still unfavorable at 28.68
- Debt-to-assets relatively high at 44.7%
- Zero dividend yield
- Neutral current ratio of 1.23
Fortinet excels in profitability and capital efficiency but trades at a high valuation multiple. Akamai shows solid liquidity and a lower cost of capital but faces challenges in capital returns and asset utilization. Each company’s financial profile suggests different strategic priorities.
The Moat Duel: Analyzing Competitive Defensibility
A structural moat protects long-term profits from relentless competition erosion. Only a strong moat ensures durable advantage and value creation:
Fortinet, Inc.: Switching Costs and Integrated Security Ecosystem
Fortinet’s moat stems from high switching costs and a broad, integrated cybersecurity platform. Its 33% EBIT margin signals efficient capital use. In 2026, expanding cloud security could deepen its moat.
Akamai Technologies, Inc.: Network Effects with Content Delivery
Akamai depends on network effects in content delivery and edge computing, contrasting Fortinet’s switching cost advantage. However, declining ROIC and margins suggest weakening positioning. New edge compute services offer growth but face stiff competition.
Switching Costs vs. Network Effects: Fortinet’s Advantage
Fortinet boasts a wider and growing moat with ROIC exceeding WACC by 20%, demonstrating strong value creation. Akamai’s declining ROIC and negative value spread show a shrinking moat. Fortinet is better equipped to defend market share through integrated solutions and rising profitability.
Which stock offers better returns?
Over the past year, Fortinet, Inc. surged 24.04%, showing a bullish trend with decelerating price gains. Akamai Technologies, Inc. declined 11.35%, marking a bearish trend but with accelerating losses.
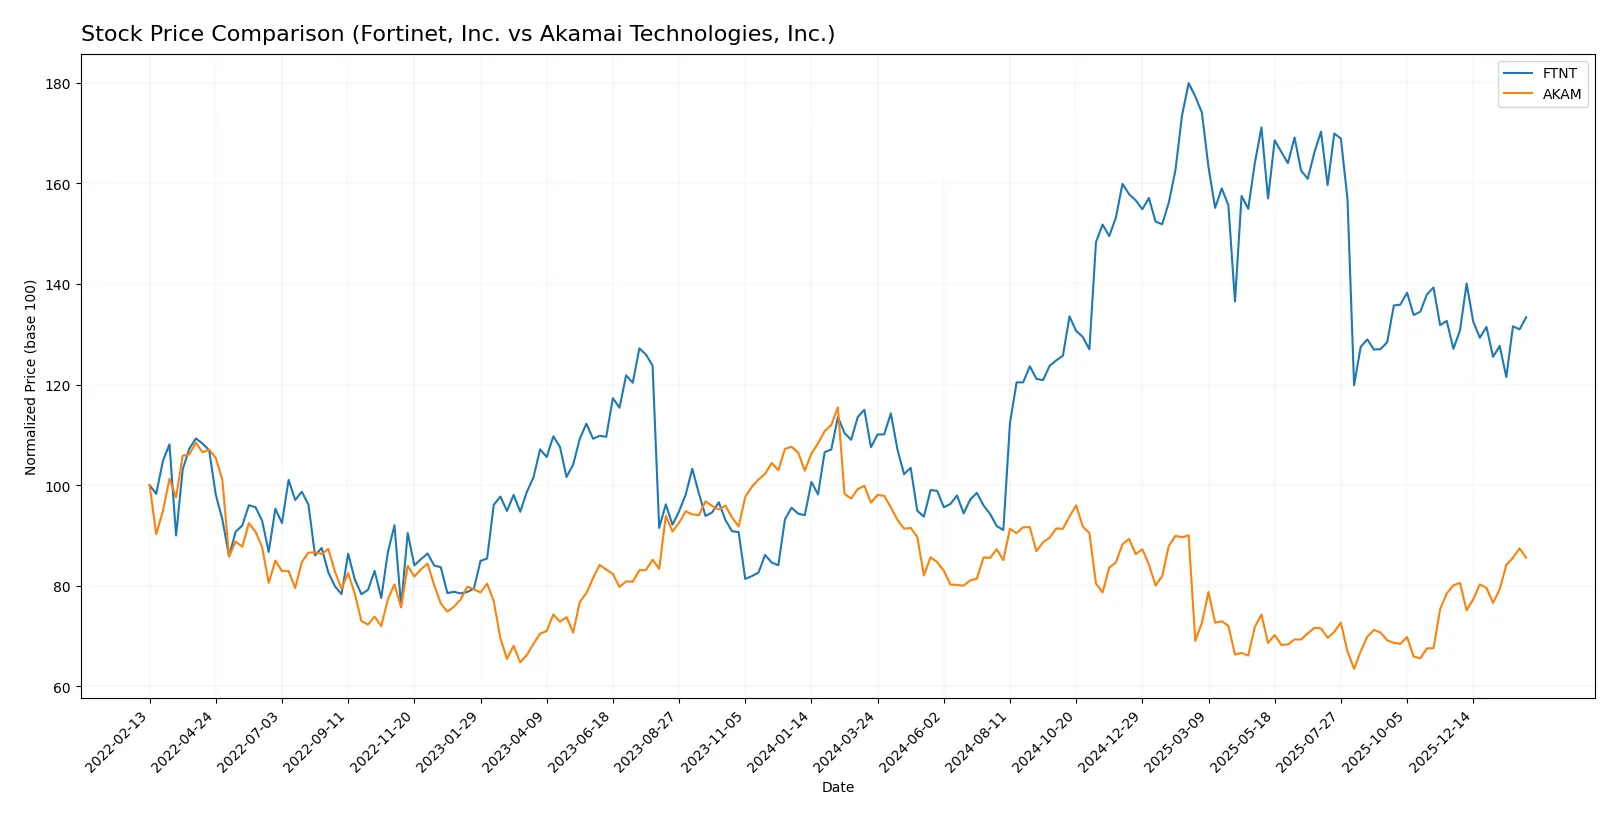
Trend Comparison
Fortinet, Inc. gained 24.04% over 12 months, reflecting a strong bullish trend despite deceleration and a high 15.07 volatility. Its price ranged between 56.51 and 111.64.
Akamai Technologies, Inc. dropped 11.35% in the same period, confirming a bearish trend with accelerating downside momentum. Volatility stood at 10.38, with prices from 70.53 to 108.97.
Fortinet outperformed Akamai by a wide margin, delivering the highest market returns over the last year.
Target Prices
Analysts present a bullish consensus for Fortinet, Inc. and Akamai Technologies, Inc., signaling upside potential.
| Company | Target Low | Target High | Consensus |
|---|---|---|---|
| Fortinet, Inc. | 70 | 90 | 85 |
| Akamai Technologies, Inc. | 89 | 115 | 107.8 |
Fortinet’s consensus target of 85 sits slightly above its current price of 82.76, suggesting moderate upside. Akamai’s 107.8 consensus target exceeds its 95.08 price, reflecting stronger expected gains.

Don’t Let Luck Decide Your Entry Point
Optimize your entry points with our advanced ProRealTime indicators. You’ll get efficient buy signals with precise price targets for maximum performance. Start outperforming now!
How do institutions grade them?
Here is a summary of recent institutional grades for Fortinet, Inc. and Akamai Technologies, Inc.:
Fortinet, Inc. Grades
The table below lists recent grades from key financial institutions for Fortinet:
| Grading Company | Action | New Grade | Date |
|---|---|---|---|
| Wedbush | maintain | Outperform | 2026-02-06 |
| JP Morgan | maintain | Underweight | 2026-02-06 |
| Mizuho | maintain | Underperform | 2026-02-06 |
| Rosenblatt | maintain | Buy | 2026-02-06 |
| RBC Capital | maintain | Sector Perform | 2026-02-06 |
| Scotiabank | downgrade | Sector Perform | 2026-02-02 |
| JP Morgan | maintain | Underweight | 2026-01-30 |
| Rosenblatt | upgrade | Buy | 2026-01-29 |
| TD Cowen | upgrade | Buy | 2026-01-23 |
| Citigroup | maintain | Neutral | 2026-01-13 |
Akamai Technologies, Inc. Grades
The table below lists recent grades from key financial institutions for Akamai Technologies:
| Grading Company | Action | New Grade | Date |
|---|---|---|---|
| Citigroup | maintain | Neutral | 2026-01-16 |
| Morgan Stanley | upgrade | Overweight | 2026-01-12 |
| Scotiabank | maintain | Sector Outperform | 2026-01-09 |
| RBC Capital | maintain | Sector Perform | 2026-01-05 |
| Piper Sandler | maintain | Neutral | 2026-01-05 |
| Keybanc | upgrade | Overweight | 2025-12-15 |
| TD Cowen | maintain | Hold | 2025-11-13 |
| Citigroup | maintain | Neutral | 2025-11-11 |
| Scotiabank | maintain | Sector Outperform | 2025-11-07 |
| Piper Sandler | maintain | Neutral | 2025-11-07 |
Which company has the best grades?
Akamai Technologies holds more consistent positive upgrades, including recent Overweight ratings by Morgan Stanley and Keybanc. Fortinet shows a mix of Buy and Outperform ratings but also Underweight and Underperform grades. Akamai’s stronger grade consensus may suggest better institutional confidence, impacting investor sentiment accordingly.
Risks specific to each company
The following categories identify the critical pressure points and systemic threats facing both firms in the 2026 market environment:
1. Market & Competition
Fortinet, Inc.
- Leads in cybersecurity with integrated solutions but faces intense competition from peers like Palo Alto Networks.
Akamai Technologies, Inc.
- Dominates in cloud content delivery yet contends with rivals such as Cloudflare and Amazon CloudFront.
2. Capital Structure & Debt
Fortinet, Inc.
- Maintains moderate leverage (D/E 0.81) with strong interest coverage (113x), signaling robust debt management.
Akamai Technologies, Inc.
- Slightly higher leverage (D/E 0.95) with good interest coverage (22.65x), but debt to assets at 44.7% is a concern.
3. Stock Volatility
Fortinet, Inc.
- Beta near 1.05 indicates stock moves roughly with the market, implying moderate volatility.
Akamai Technologies, Inc.
- Lower beta of 0.72 signals less sensitivity to market swings, offering defensive characteristics.
4. Regulatory & Legal
Fortinet, Inc.
- Faces stringent cybersecurity regulations globally, especially in government and financial sectors.
Akamai Technologies, Inc.
- Must comply with data privacy and content delivery regulations, including GDPR and net neutrality rules.
5. Supply Chain & Operations
Fortinet, Inc.
- Relies on hardware components, exposing it to global supply chain disruptions and semiconductor shortages.
Akamai Technologies, Inc.
- Mostly software and cloud-based, reducing direct supply chain risk but dependent on global data center infrastructure.
6. ESG & Climate Transition
Fortinet, Inc.
- Increasing pressure to improve energy efficiency in hardware production and data centers.
Akamai Technologies, Inc.
- Actively investing in sustainable cloud infrastructure and carbon footprint reduction initiatives.
7. Geopolitical Exposure
Fortinet, Inc.
- Operates globally with exposure to trade tensions and cybersecurity geopolitics, especially US-China relations.
Akamai Technologies, Inc.
- Global presence entails risks from internet censorship and regulatory fragmentation in key markets.
Which company shows a better risk-adjusted profile?
Fortinet’s most impactful risk is supply chain disruption due to hardware reliance. Akamai’s top risk lies in geopolitical exposure from regulatory fragmentation. Fortinet’s stronger financial ratios and higher Altman Z-score place it in a safer zone. Akamai’s lower volatility and stronger Piotroski score indicate operational strength but greater financial caution. Overall, Fortinet offers a better risk-adjusted profile given its robust balance sheet and superior profitability metrics.
Final Verdict: Which stock to choose?
Fortinet, Inc. wields unmatched operational efficiency and a robust economic moat, demonstrated by its consistently growing ROIC well above WACC. Its ability to generate substantial free cash flow underpins a strong growth trajectory. A point of vigilance remains its stretched valuation multiples, which might temper near-term upside. Fortinet suits portfolios targeting aggressive growth with tolerance for premium pricing.
Akamai Technologies, Inc. commands a strategic moat rooted in its recurring revenue streams and cloud infrastructure presence. It offers a comparatively safer profile with moderate valuation metrics and a strong free cash flow yield. However, its declining ROIC and profitability trends signal caution. Akamai fits well within GARP portfolios seeking stability with measured growth potential.
If you prioritize aggressive growth and can absorb valuation premiums, Fortinet outshines with its scalable cash generation and sustainable competitive advantage. However, if you seek more stability and a margin of safety, Akamai offers better downside protection despite its weaker profitability trends. Each presents a distinct analytical scenario tailored to specific investor risk appetites and strategic goals.
Disclaimer: Investment carries a risk of loss of initial capital. The past performance is not a reliable indicator of future results. Be sure to understand risks before making an investment decision.
Go Further
I encourage you to read the complete analyses of Fortinet, Inc. and Akamai Technologies, Inc. to enhance your investment decisions: