Home > Comparison > Technology > FFIV vs AKAM
The strategic rivalry between F5, Inc. and Akamai Technologies defines the evolution of software infrastructure. F5 operates as a multi-cloud application security and delivery specialist, blending hardware and software solutions. Akamai focuses on cloud-based content delivery and cybersecurity services, emphasizing scalability and edge computing. This clash highlights a battle between integrated security platforms and cloud-optimized delivery models. This analysis will reveal which company presents the superior risk-adjusted opportunity for a diversified portfolio in technology.

Table of contents
Companies Overview
F5, Inc. and Akamai Technologies, Inc. both shape the competitive landscape of cloud and application infrastructure.
F5, Inc.: Multi-Cloud Application Security Leader
F5 dominates the multi-cloud application security and delivery market. It generates revenue mainly from its BIG-IP appliances and software modules that secure and optimize network applications. In 2026, F5 strategically focuses on expanding partnerships with major cloud providers like AWS, Azure, and Google Cloud to enhance hybrid and multi-cloud solutions.
Akamai Technologies, Inc.: Cloud Performance and Security Specialist
Akamai leads in cloud services for securing and optimizing content delivery over the internet. Its core revenue comes from cloud security, media delivery, and edge compute solutions. The company’s 2026 strategy centers on advancing edge computing and cybersecurity offerings to protect and accelerate digital experiences globally.
Strategic Collision: Similarities & Divergences
Both firms excel in software infrastructure security but diverge in approach: F5 emphasizes multi-cloud integration while Akamai prioritizes edge computing and content delivery. The battleground lies in capturing enterprise cloud and internet security budgets. Their distinct profiles appeal differently—F5 leverages deep hardware-software synergy, whereas Akamai rides the wave of edge innovation and scale.
Income Statement Comparison
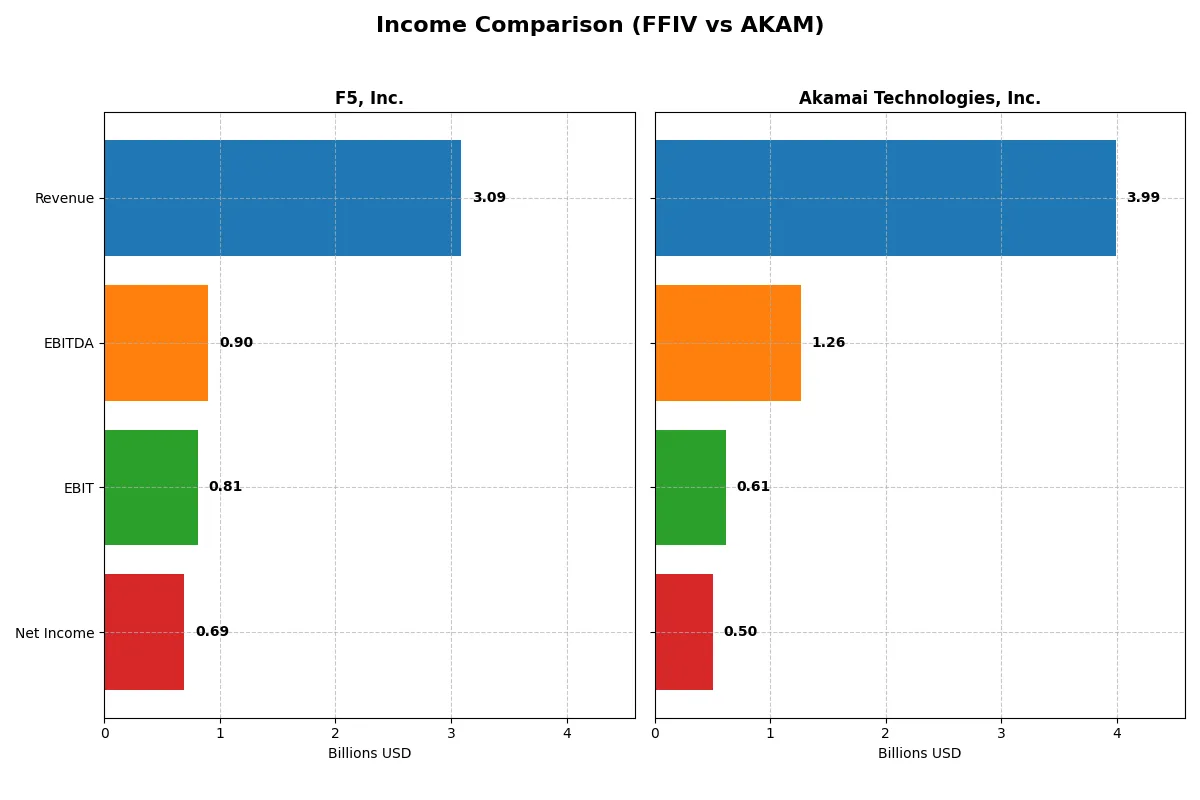
This data dissects the core profitability and scalability of both corporate engines to reveal who dominates the bottom line:
| Metric | F5, Inc. (FFIV) | Akamai Technologies, Inc. (AKAM) |
|---|---|---|
| Revenue | 3.09B | 3.99B |
| Cost of Revenue | 564M | 1.62B |
| Operating Expenses | 1.76B | 1.84B |
| Gross Profit | 2.52B | 2.37B |
| EBITDA | 901M | 1.26B |
| EBIT | 808M | 614M |
| Interest Expense | 0 | 27M |
| Net Income | 692M | 505M |
| EPS | 11.95 | 3.34 |
| Fiscal Year | 2025 | 2024 |
Income Statement Analysis: The Bottom-Line Duel
This income statement comparison reveals which company operates its business more efficiently and converts revenue into profit more effectively.
F5, Inc. Analysis
F5, Inc. posts a strong revenue rise from $2.6B in 2021 to $3.1B in 2025, with net income surging 109% to $692M. The company maintains robust gross margins above 81%, indicating excellent cost control. In 2025, net margin expands to 22.4%, reflecting exceptional operational leverage and profit momentum.
Akamai Technologies, Inc. Analysis
Akamai’s revenue grows steadily from $3.2B in 2020 to $4.0B in 2024, but net income declines 9% to $505M. Gross margin holds at a healthy 59%, yet net margin slips to 12.7%, signaling rising expenses. The latest year shows margin compression and weaker earnings momentum despite top-line growth.
Margin Strength vs. Revenue Growth
F5, Inc. outshines Akamai with superior margin expansion and rapid profit growth, delivering more earnings per dollar of sales. Akamai’s higher revenue scale is undermined by falling profitability and margin shrinkage. Investors seeking efficient profit generation will find F5’s profile more compelling amid margin resilience and earnings acceleration.
Financial Ratios Comparison
These vital ratios act as a diagnostic tool to expose the underlying fiscal health, valuation premiums, and capital efficiency of the companies compared below:
| Ratios | F5, Inc. (FFIV) | Akamai Technologies, Inc. (AKAM) |
|---|---|---|
| ROE | 19.3% | 10.4% |
| ROIC | 14.0% | 4.7% |
| P/E | 26.9 | 28.7 |
| P/B | 5.19 | 2.97 |
| Current Ratio | 1.56 | 1.23 |
| Quick Ratio | 1.51 | 1.23 |
| D/E | 0.06 | 0.95 |
| Debt-to-Assets | 3.7% | 44.7% |
| Interest Coverage | 0 | 19.7 |
| Asset Turnover | 0.49 | 0.38 |
| Fixed Asset Turnover | 9.02 | 1.33 |
| Payout ratio | 0 | 0 |
| Dividend yield | 0% | 0% |
| Fiscal Year | 2025 | 2024 |
Efficiency & Valuation Duel: The Vital Signs
Financial ratios act as a company’s DNA, uncovering hidden risks and revealing operational strengths crucial for investment decisions.
F5, Inc.
F5, Inc. demonstrates strong profitability with a 19.28% ROE and a robust 22.42% net margin, signaling operational efficiency. Its valuation appears stretched with a P/E of 26.91 and P/B of 5.19, both unfavorable. The company reinvests heavily in R&D, foregoing dividends to fuel long-term growth and shareholder value.
Akamai Technologies, Inc.
Akamai posts a modest 10.35% ROE and a 12.65% net margin, reflecting moderate profitability but less operational efficiency than its peer. The P/E ratio of 28.68 suggests the stock is expensive. Akamai carries significant debt, and like F5, it pays no dividend, focusing on growth investments instead.
Operational Efficiency vs. Valuation Premium
F5 offers higher profitability and a more favorable overall ratio profile, despite a stretched valuation. Akamai’s lower margins and higher leverage present more risk amid an expensive price. Investors seeking operational strength may prefer F5, while those tolerating risk for growth exposure might consider Akamai.
Which one offers the Superior Shareholder Reward?
F5, Inc. (FFIV) and Akamai Technologies, Inc. (AKAM) both avoid dividends, focusing on reinvestment and buybacks. FFIV’s free cash flow per share stands at $15.7 with a strong buyback program, while AKAM’s free cash flow per share is $5.5, with a less aggressive buyback. FFIV’s payout ratio is zero, signaling full FCF reinvestment into growth or buybacks, which I find more sustainable given its superior operating margins (~26% EBIT vs. AKAM’s ~15%) and low debt (6% debt to capital vs. AKAM’s 49%). AKAM’s heavy leverage and lower FCF yield pressure its ability to sustain buybacks long-term. I see FFIV as the more attractive total return play in 2026, driven by higher FCF, robust buybacks, and a conservative capital structure that supports consistent shareholder reward.
Comparative Score Analysis: The Strategic Profile
The radar chart reveals the fundamental DNA and trade-offs of F5, Inc. and Akamai Technologies, Inc., highlighting their strategic financial strengths and vulnerabilities:
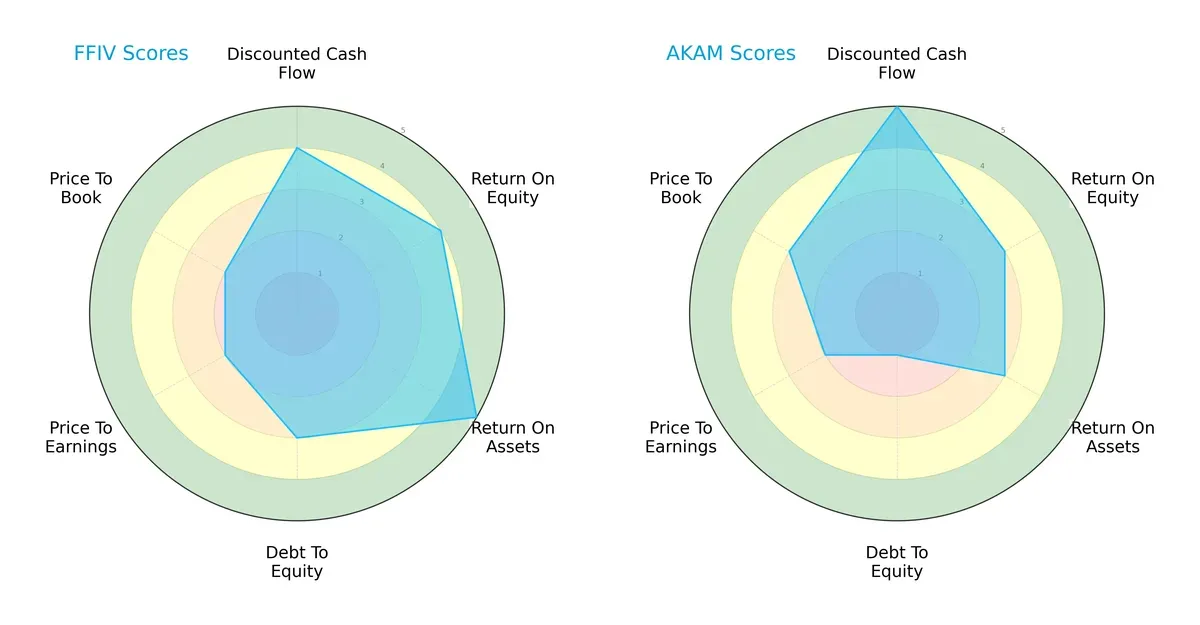
F5, Inc. shows a balanced profile with strong ROE (4) and ROA (5) scores, indicating efficient profit generation and asset use. Akamai leads in discounted cash flow (5), suggesting better valuation potential, but suffers from a weak debt-to-equity score (1), exposing higher financial risk. F5’s moderate valuation scores contrast with Akamai’s slightly better price-to-book (3), yet overall, F5 maintains a more stable and diversified financial footing.
Bankruptcy Risk: Solvency Showdown
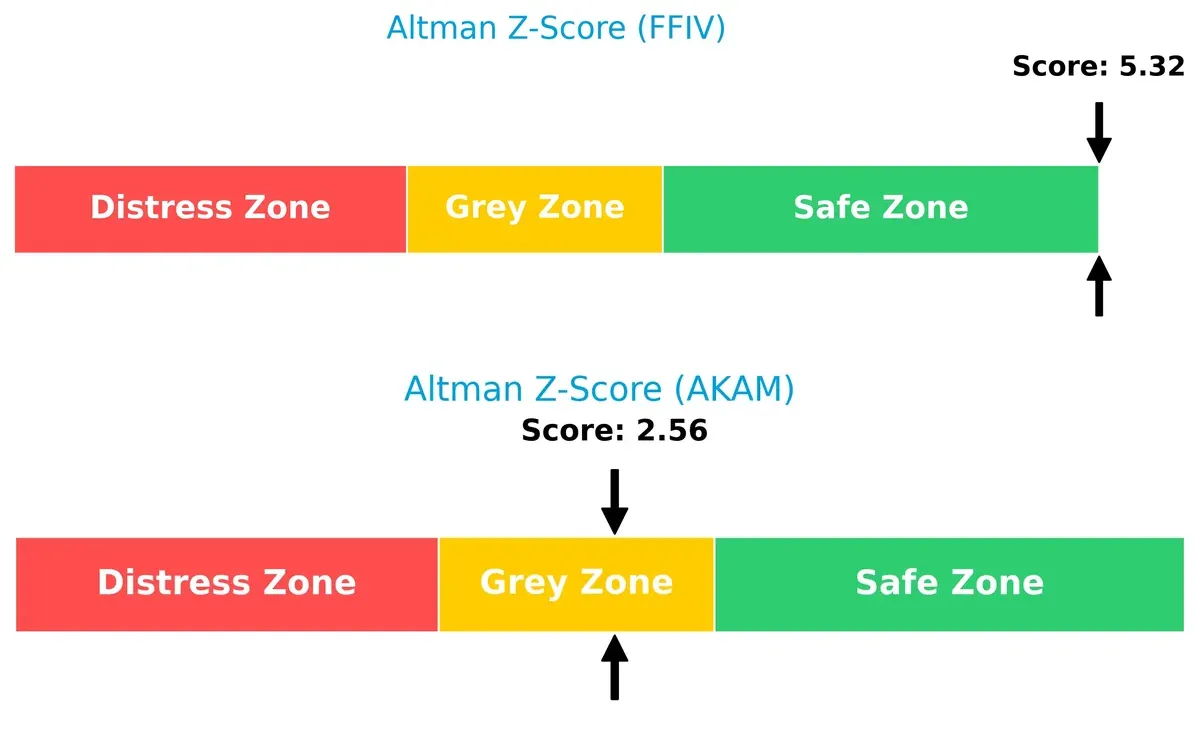
F5’s Altman Z-Score of 5.32 firmly places it in the safe zone, while Akamai’s 2.56 sits in the grey zone, signaling moderate bankruptcy risk. This gap suggests F5 has a stronger buffer against economic downturns and financial distress in the current cycle:
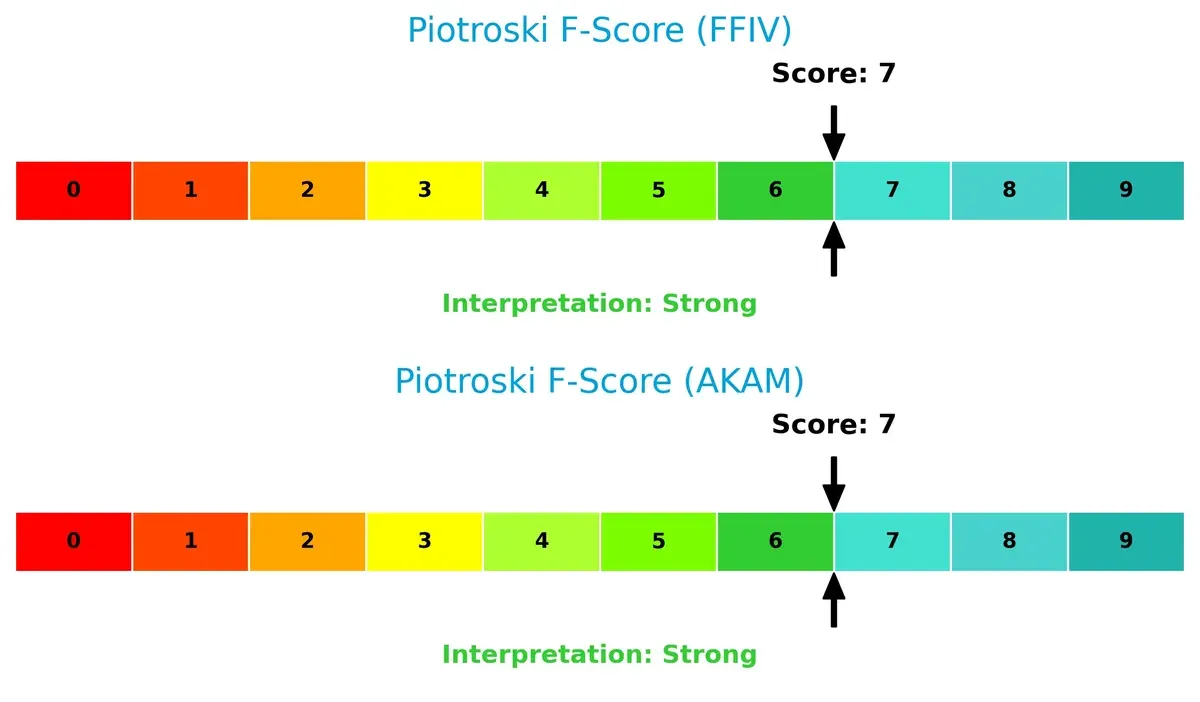
Financial Health: Quality of Operations
Both companies score a 7 on the Piotroski F-Score, reflecting strong financial health and operational quality. Neither shows immediate red flags; however, investors should monitor Akamai’s solvency due to its weaker balance sheet despite solid internal metrics:
How are the two companies positioned?
This section dissects the operational DNA of F5 and Akamai by comparing their revenue distribution and internal dynamics. The goal is to confront their economic moats to identify which model offers the most resilient competitive advantage today.
Revenue Segmentation: The Strategic Mix
This comparison dissects how F5, Inc. and Akamai Technologies diversify their income streams and where their primary sector bets lie:
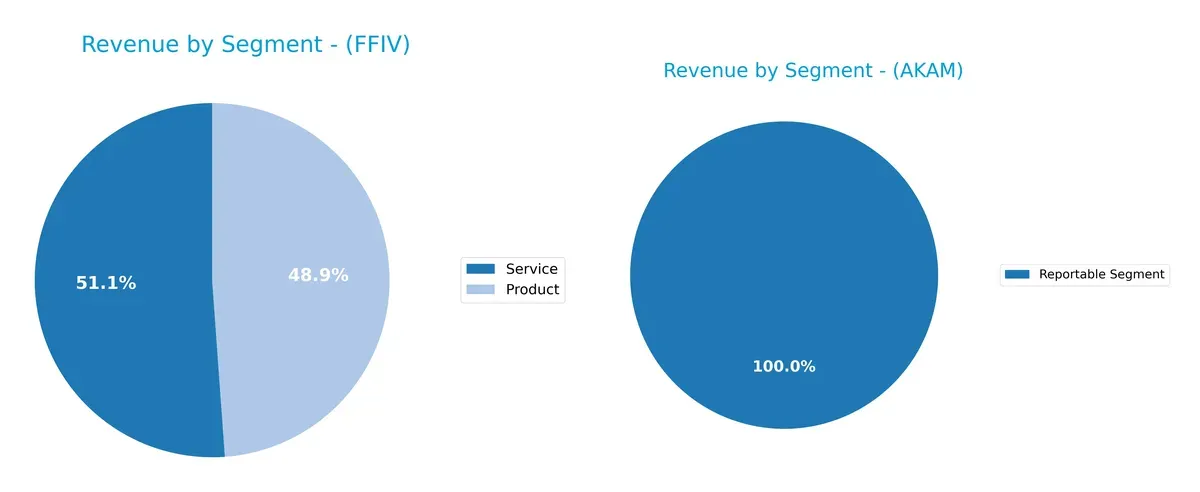
F5, Inc. balances revenue between Product ($1.5B) and Service ($1.58B) segments, showing a diversified portfolio. Akamai relies solely on one reportable segment generating $3.99B, indicating concentration risk. F5’s mix suggests resilience through ecosystem lock-in, while Akamai’s focus on a single segment pivots on infrastructure dominance but faces higher vulnerability if market conditions shift.
Strengths and Weaknesses Comparison
This table compares the strengths and weaknesses of F5, Inc. and Akamai Technologies, Inc.:
F5 Strengths
- Balanced revenue from products and services
- Favorable net margin at 22.42%
- Strong return on equity at 19.28%
- Low debt with 3.65% debt-to-assets
- High fixed asset turnover at 9.02
- Diversified geographic presence across Americas, EMEA, Asia Pacific
Akamai Strengths
- Large total revenue of 3.99B in one segment
- Favorable net margin at 12.65%
- Strong interest coverage at 22.65
- Favorable weighted average cost of capital at 6.14%
- Significant US and international revenue split
- Neutral to favorable liquidity ratios
F5 Weaknesses
- Unfavorable price-to-earnings (26.91) and price-to-book (5.19) ratios
- Asset turnover is low at 0.49
- No dividend yield
- WACC neutral at 8.31%
- Reliance on two revenue streams only
Akamai Weaknesses
- Low return on invested capital at 4.74%
- Moderate leverage with debt-to-assets at 44.7%
- Unfavorable price-to-earnings (28.68)
- Price-to-book ratio neutral at 2.97
- Slightly lower current ratio at 1.23
- No dividend yield
- Asset turnover low at 0.38
F5 exhibits stronger profitability and balance sheet metrics with diversified revenue streams and global reach. Akamai shows strengths in revenue scale and interest coverage but faces challenges with lower capital efficiency and higher leverage. Both companies’ valuation multiples suggest market caution.
The Moat Duel: Analyzing Competitive Defensibility
A structural moat protects long-term profits from relentless competition erosion. Without it, gains vanish quickly in this sector:
F5, Inc.: Hardware-Software Integration Moat
F5 dominates through its unique hardware-software synergy, driving high ROIC and stable 26% EBIT margins. Its multi-cloud security innovations in 2026 promise to deepen this advantage.
Akamai Technologies, Inc.: Content Delivery Scale Moat
Akamai leverages massive global network scale, unlike F5’s integrated stack. Yet, declining ROIC and shrinking margins reveal weakening moat durability. Edge computing offers a potential rebound path.
Integration Synergy vs. Network Scale: The Moat Face-off
F5’s growing ROIC and strong profit margins show a wider, more durable moat than Akamai’s shrinking returns. F5 stands better poised to defend and grow market share in 2026.
Which stock offers better returns?
Over the past year, F5, Inc. surged 42.85%, showing accelerating gains and a notable high of 331.75. Akamai Technologies, Inc. declined 12.48%, despite recent upward momentum from late 2025.
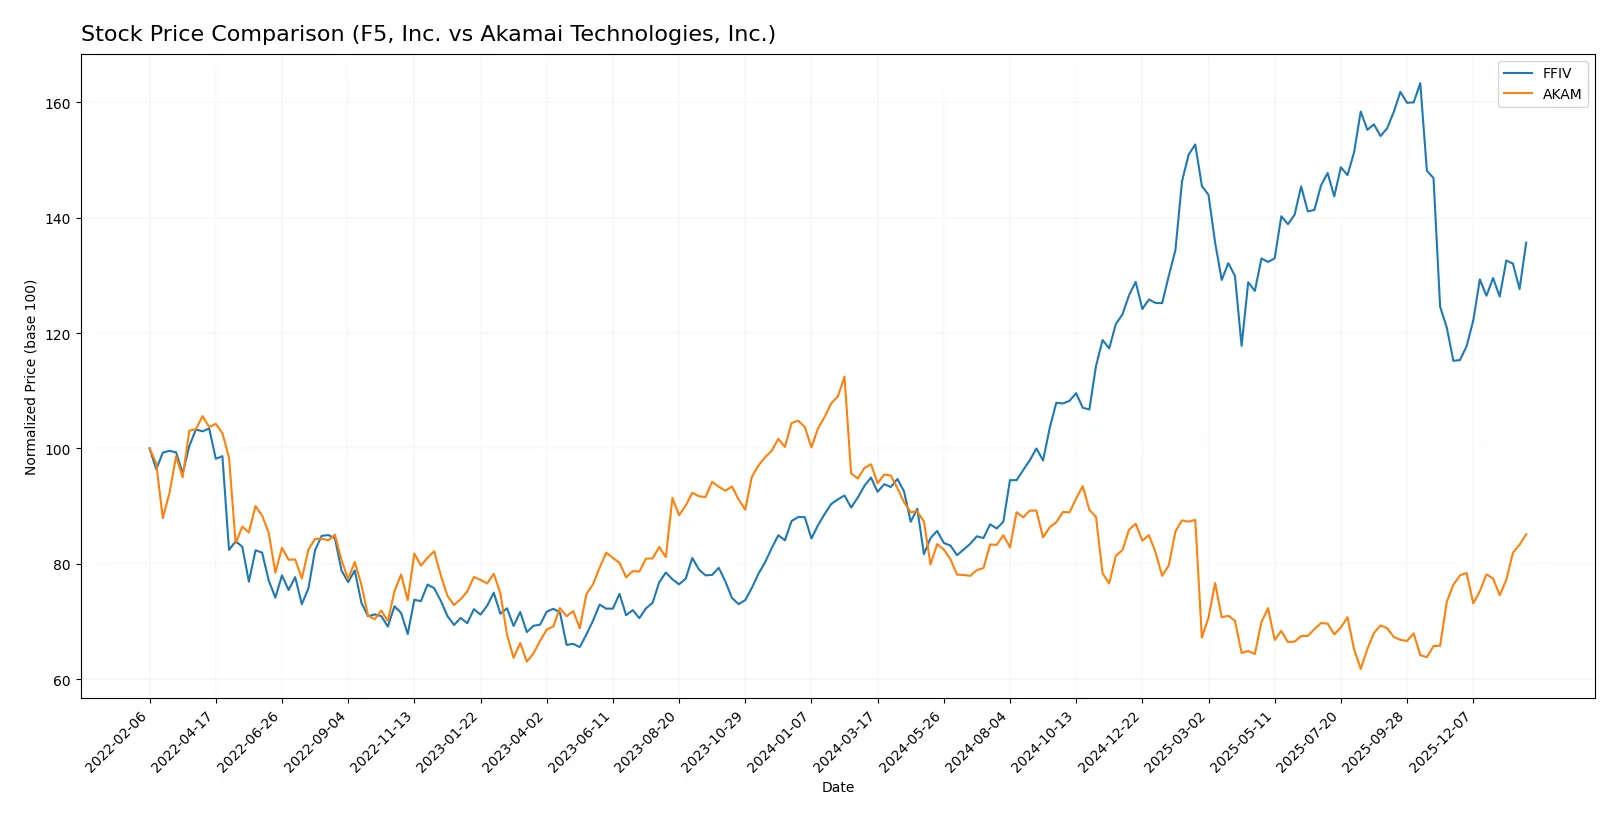
Trend Comparison
F5, Inc. exhibits a bullish trend with a 42.85% price increase over 12 months, accelerating gains, and a high volatility level at 48.51 standard deviation. Akamai Technologies, Inc. shows a bearish 12.48% decline over the same period but recent price movement indicates a modest 11.45% rise with lower volatility at 3.9 standard deviation. F5, Inc. outperforms Akamai Technologies, Inc. with significantly higher returns and strong buyer dominance throughout the year.
Target Prices
Analysts present a moderately bullish consensus for both F5, Inc. and Akamai Technologies, Inc.
| Company | Target Low | Target High | Consensus |
|---|---|---|---|
| F5, Inc. | 295 | 352 | 328.25 |
| Akamai Technologies, Inc. | 89 | 115 | 104.8 |
The consensus target prices exceed current market prices—F5 trades at 275.61 and Akamai at 97.15—indicating analyst expectations for price appreciation. Both companies show upside potential relative to their latest stock values.

Don’t Let Luck Decide Your Entry Point
Optimize your entry points with our advanced ProRealTime indicators. You’ll get efficient buy signals with precise price targets for maximum performance. Start outperforming now!
How do institutions grade them?
Here is a summary of recent institutional grades for F5, Inc. and Akamai Technologies, Inc.:
F5, Inc. Grades
The table below shows current analyst ratings and grades for F5, Inc.:
| Grading Company | Action | New Grade | Date |
|---|---|---|---|
| RBC Capital | Maintain | Outperform | 2026-01-28 |
| Needham | Maintain | Hold | 2026-01-28 |
| Goldman Sachs | Maintain | Neutral | 2026-01-28 |
| Piper Sandler | Maintain | Overweight | 2026-01-28 |
| Barclays | Maintain | Equal Weight | 2026-01-28 |
| JP Morgan | Upgrade | Overweight | 2026-01-15 |
| Piper Sandler | Upgrade | Overweight | 2026-01-05 |
| RBC Capital | Upgrade | Outperform | 2026-01-05 |
| Morgan Stanley | Maintain | Equal Weight | 2025-12-17 |
| Morgan Stanley | Maintain | Equal Weight | 2025-10-28 |
Akamai Technologies, Inc. Grades
The table below shows current analyst ratings and grades for Akamai Technologies, Inc.:
| Grading Company | Action | New Grade | Date |
|---|---|---|---|
| Citigroup | Maintain | Neutral | 2026-01-16 |
| Morgan Stanley | Upgrade | Overweight | 2026-01-12 |
| Scotiabank | Maintain | Sector Outperform | 2026-01-09 |
| RBC Capital | Maintain | Sector Perform | 2026-01-05 |
| Piper Sandler | Maintain | Neutral | 2026-01-05 |
| Keybanc | Upgrade | Overweight | 2025-12-15 |
| TD Cowen | Maintain | Hold | 2025-11-13 |
| Citigroup | Maintain | Neutral | 2025-11-11 |
| Scotiabank | Maintain | Sector Outperform | 2025-11-07 |
| Piper Sandler | Maintain | Neutral | 2025-11-07 |
Which company has the best grades?
F5, Inc. receives multiple Outperform and Overweight upgrades from top firms, indicating stronger confidence. Akamai shows upgrades to Overweight but more Neutral and Sector Perform ratings. Investors may view F5 as slightly more favored by analysts, suggesting potentially higher growth expectations.
Risks specific to each company
The following categories identify the critical pressure points and systemic threats facing both firms in the 2026 market environment:
1. Market & Competition
F5, Inc.
- Strong multi-cloud security niche but faces competition from hyperscalers and agile startups.
Akamai Technologies, Inc.
- Broad cloud services but pressured by larger cloud providers entering content delivery and edge computing.
2. Capital Structure & Debt
F5, Inc.
- Very low debt-to-equity (0.06), signaling strong balance sheet and low financial risk.
Akamai Technologies, Inc.
- High debt-to-equity (0.95), presenting moderate financial leverage risk amid tightening credit markets.
3. Stock Volatility
F5, Inc.
- Beta near 1 (0.975) implies stock moves roughly with the market, moderate volatility.
Akamai Technologies, Inc.
- Lower beta (0.685) suggests less sensitivity to market swings, more defensive stock behavior.
4. Regulatory & Legal
F5, Inc.
- Operates globally with exposure to data privacy regulations and cybersecurity compliance risks.
Akamai Technologies, Inc.
- Similar global regulatory exposure, with added scrutiny on content delivery and data sovereignty.
5. Supply Chain & Operations
F5, Inc.
- Complex hardware-software integration could face supply delays and cost pressures.
Akamai Technologies, Inc.
- Primarily software/cloud-based, less vulnerable to physical supply chain disruptions.
6. ESG & Climate Transition
F5, Inc.
- Moderate ESG focus; hardware manufacturing impacts carbon footprint.
Akamai Technologies, Inc.
- Stronger emphasis on cloud efficiencies and energy-saving edge computing solutions.
7. Geopolitical Exposure
F5, Inc.
- Revenue diversified globally but sensitive to US-China tensions affecting supply and sales.
Akamai Technologies, Inc.
- Also globally diversified; edge services face geopolitical risks around internet governance and censorship.
Which company shows a better risk-adjusted profile?
F5’s strongest risk is market competition intensified by hyperscalers expanding into application security. Akamai’s highest risk lies in its elevated leverage, increasing financial vulnerability. F5’s low debt and superior Altman Z-Score (5.32 safe zone) grant it a more resilient risk-adjusted profile. Akamai’s moderate Altman Z-Score (2.56 grey zone) flags caution despite solid operational strength. The contrast in financial stability is underscored by F5’s minimal debt-to-assets ratio (3.65%) versus Akamai’s 44.7%, marking F5 as the safer investment amid current market volatility.
Final Verdict: Which stock to choose?
F5, Inc. (FFIV) excels as a cash generator with a strong value creation engine, evidenced by its growing ROIC well above WACC. Its main point of vigilance is a relatively high price-to-book multiple, which suggests premium valuation risk. FFIV suits investors targeting aggressive growth with solid financial discipline.
Akamai Technologies, Inc. (AKAM) leverages its strategic moat in cloud delivery and recurring contracts, offering stable cash flow. However, its declining ROIC and higher leverage temper its safety profile compared to FFIV. AKAM fits well within a GARP (Growth at a Reasonable Price) portfolio seeking steady income with moderate risk.
If you prioritize robust value creation and accelerating growth, FFIV outshines due to its durable competitive advantage and superior profitability. However, if you seek more stable cash flow with a focus on recurring revenue and can tolerate slower growth, AKAM offers better stability despite profitability challenges. Both cases demand cautious risk management given their distinct financial profiles.
Disclaimer: Investment carries a risk of loss of initial capital. The past performance is not a reliable indicator of future results. Be sure to understand risks before making an investment decision.
Go Further
I encourage you to read the complete analyses of F5, Inc. and Akamai Technologies, Inc. to enhance your investment decisions: