In today’s fast-evolving technology landscape, CyberArk Software Ltd. and Akamai Technologies, Inc. stand out as key players in the software infrastructure industry. Both companies focus on cybersecurity and cloud services, addressing critical needs around secure access and data delivery. Their innovation strategies and market overlap make them prime candidates for comparison. Join me as we explore which company presents the most compelling investment opportunity in 2026.

Table of contents
Companies Overview
I will begin the comparison between CyberArk Software Ltd. and Akamai Technologies, Inc. by providing an overview of these two companies and their main differences.
CyberArk Overview
CyberArk Software Ltd. focuses on developing software-based security solutions primarily in privileged access management and identity services. Founded in 1999 and headquartered in Petah Tikva, Israel, CyberArk serves industries such as financial services, healthcare, and telecommunications globally. The company emphasizes risk-based credential security and cloud entitlement management, positioning itself as a leader in securing privileged access across various environments.
Akamai Overview
Akamai Technologies, Inc., founded in 1998 and based in Cambridge, Massachusetts, provides cloud services aimed at securing, delivering, and optimizing internet content and business applications. Its offerings include cybersecurity protection, media delivery, and edge compute solutions. Akamai targets a broad range of clients internationally, focusing on enhancing web and mobile performance and protecting infrastructure from cyberattacks through a comprehensive cloud platform.
Key similarities and differences
Both CyberArk and Akamai operate within the software infrastructure sector, emphasizing cybersecurity and cloud-based solutions. CyberArk specializes in privileged access and identity management, focusing on internal security controls, while Akamai centers on content delivery, internet application optimization, and broader cloud security services. Despite overlapping goals in protecting digital assets, their business models cater to distinct aspects of cybersecurity and infrastructure performance.
Income Statement Comparison
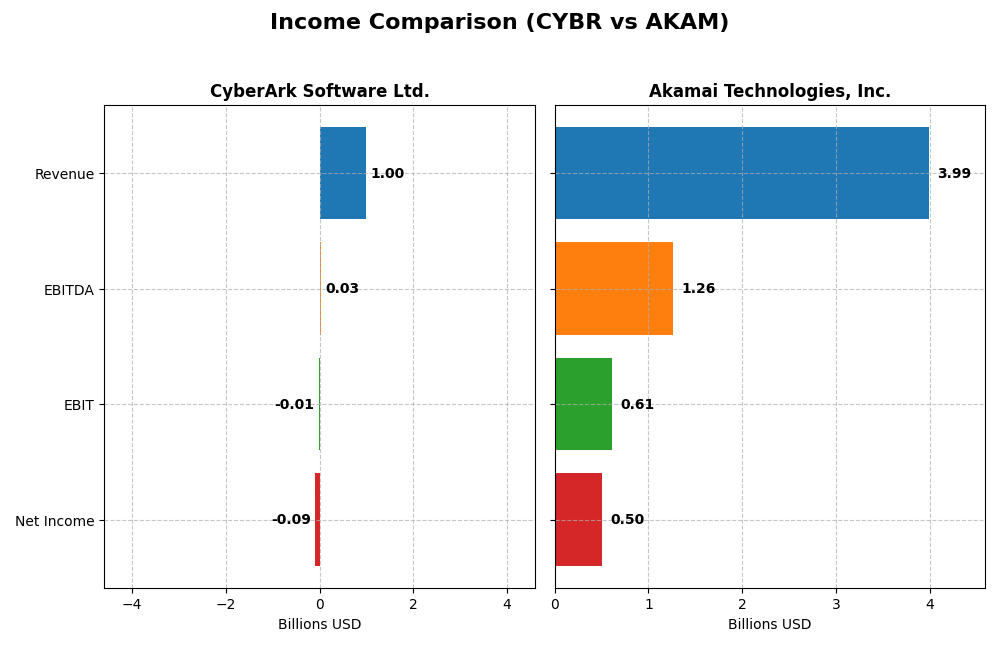
This table compares key income statement metrics for CyberArk Software Ltd. and Akamai Technologies, Inc. based on their most recent fiscal year ended 2024.
| Metric | CyberArk Software Ltd. | Akamai Technologies, Inc. |
|---|---|---|
| Market Cap | 22.9B | 13.4B |
| Revenue | 1.00B | 3.99B |
| EBITDA | 29M | 1.26B |
| EBIT | -13.3M | 614M |
| Net Income | -93.5M | 505M |
| EPS | -2.12 | 3.34 |
| Fiscal Year | 2024 | 2024 |
Income Statement Interpretations
CyberArk Software Ltd.
CyberArk’s revenue showed strong growth, increasing from $464M in 2020 to $1.0B in 2024, a 115% rise. However, net income remained negative throughout, widening from -$5.8M in 2020 to -$93.5M in 2024. Gross margin remained high and favorable at 79.2%, but EBIT and net margins stayed negative. The 2024 year saw revenue and gross profit grow significantly, yet net margin deteriorated further.
Akamai Technologies, Inc.
Akamai’s revenue gradually increased from $3.2B in 2020 to nearly $4.0B in 2024, a 24.8% rise. Net income declined from $557M to $505M over the same period. Margins remained positive and favorable, with a 59.4% gross margin and a 12.7% net margin in 2024. The latest year saw modest revenue growth at 4.7%, but EBIT and net margin experienced declines, indicating some margin pressure.
Which one has the stronger fundamentals?
CyberArk benefits from robust revenue growth and a strong gross margin but struggles with persistent losses and negative net margins. Akamai has stable positive profitability and solid margins but shows slower revenue growth and recent margin erosion. Both companies present mixed signals, with CyberArk’s growth offset by losses and Akamai’s stability countered by declining margins, resulting in contrasting fundamental strengths.
Financial Ratios Comparison
This table presents a side-by-side comparison of key financial ratios for CyberArk Software Ltd. and Akamai Technologies, Inc. based on their 2024 fiscal year data.
| Ratios | CyberArk Software Ltd. (CYBR) | Akamai Technologies, Inc. (AKAM) |
|---|---|---|
| ROE | -3.94% | 10.35% |
| ROIC | -2.85% | 4.74% |
| P/E | -157.49 | 28.68 |
| P/B | 6.21 | 2.97 |
| Current Ratio | 1.48 | 1.23 |
| Quick Ratio | 1.48 | 1.23 |
| D/E (Debt-to-Equity) | 0.012 | 0.95 |
| Debt-to-Assets | 0.009 | 0.45 |
| Interest Coverage | -17.90 | 19.67 |
| Asset Turnover | 0.30 | 0.38 |
| Fixed Asset Turnover | 51.11 | 1.33 |
| Payout ratio | 0 | 0 |
| Dividend yield | 0 | 0 |
Interpretation of the Ratios
CyberArk Software Ltd.
CyberArk shows several weak financial ratios with negative net margin (-9.34%), ROE (-3.94%), and ROIC (-2.85%), indicating profitability and efficiency challenges. Its low debt levels and strong quick ratio are positive, but interest coverage is poor at -3.27. The company does not pay dividends, likely due to negative earnings and reinvestment in growth and R&D.
Akamai Technologies, Inc.
Akamai presents a mixed ratio profile with a favorable net margin of 12.65% and strong interest coverage at 22.65, supporting operational stability. ROE is neutral at 10.35%, while ROIC is slightly unfavorable at 4.74%. Despite no dividend payments, the company maintains balanced leverage and liquidity ratios, reflecting a cautious capital structure.
Which one has the best ratios?
Akamai holds a more balanced ratio profile with fewer unfavorable metrics and stronger profitability measures. CyberArk’s ratios are generally weaker, heavily impacted by negative returns and coverage ratios despite good debt management. Overall, Akamai’s ratios appear neutral, while CyberArk’s are slightly unfavorable.
Strategic Positioning
This section compares the strategic positioning of CyberArk Software Ltd. and Akamai Technologies, Inc., including Market position, Key segments, and exposure to technological disruption:
CyberArk Software Ltd.
- Market position and competitive pressure
- Key segments and business drivers
- Exposure to technological disruption
Akamai Technologies, Inc.
- Focused on software-based security solutions; serves diverse industries globally.
- Revenue driven by SaaS, self-hosted subscriptions, and maintenance/support in cybersecurity.
- Positioned in identity and access management with emphasis on SaaS and cloud entitlement solutions.
CyberArk vs Akamai Positioning
CyberArk has a more concentrated focus on privileged access and identity management security, relying on multiple software delivery models. Akamai offers a diversified cloud service portfolio including security, content delivery, and edge computing, targeting broader internet infrastructure needs.
Which has the best competitive advantage?
Both companies show very unfavorable MOAT evaluations with declining ROICs below WACC, indicating value destruction and weakening competitive advantages based on the provided financial data.
Stock Comparison
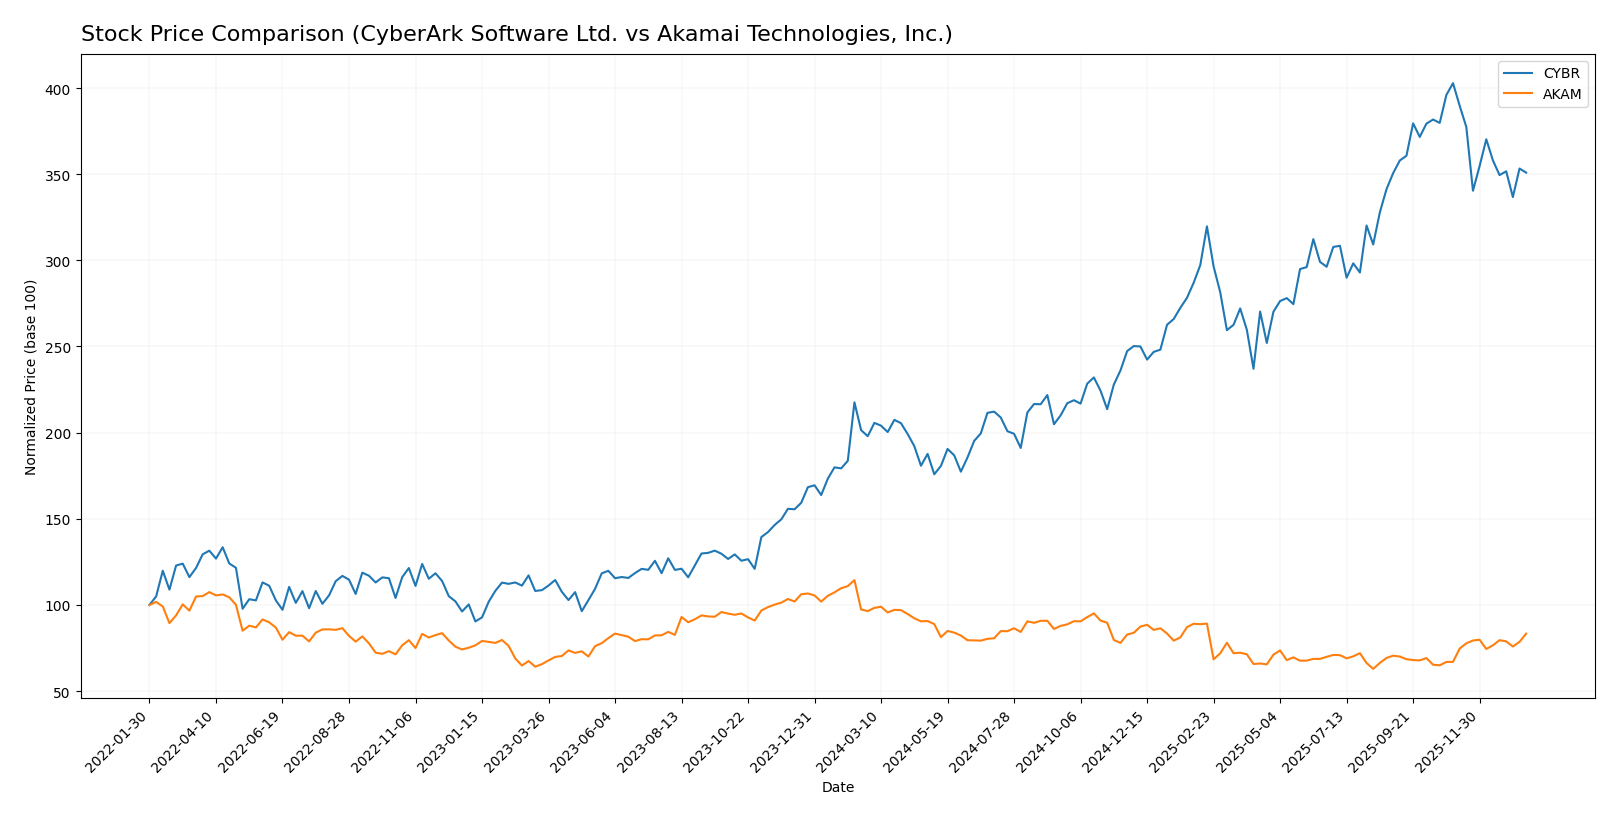
The stock prices of CyberArk Software Ltd. (CYBR) and Akamai Technologies, Inc. (AKAM) have shown contrasting dynamics over the past 12 months, with CYBR exhibiting strong gains despite recent decline, while AKAM experienced an overall drop but a recent rebound.
Trend Analysis
CyberArk Software Ltd. (CYBR) showed a bullish trend with a 77.27% price increase over the past year, although the trend is decelerating. The stock reached a high of 520.78 and a low of 227.32, with significant volatility (std deviation 82.45).
Akamai Technologies, Inc. (AKAM) experienced a bearish trend, declining 13.57% over the same period. However, the downward trend accelerated, with a high of 111.0 and a low of 70.53, and lower volatility (std deviation 10.92).
Comparing the two, CYBR delivered the highest market performance with a strong overall gain, while AKAM’s stock showed a negative return despite a recent upward movement.
Target Prices
Analyst consensus suggests potential upside for both CyberArk Software Ltd. and Akamai Technologies, Inc.
| Company | Target High | Target Low | Consensus |
|---|---|---|---|
| CyberArk Software Ltd. | 520 | 440 | 479.22 |
| Akamai Technologies, Inc. | 115 | 89 | 104.8 |
For CyberArk, the consensus target price of 479.22 is about 5.6% above the current price of 453.65, indicating moderate upside potential. Akamai’s consensus target of 104.8 also implies a roughly 12% increase from the current price of 93.49, reflecting positive analyst expectations.
Analyst Opinions Comparison
This section compares analysts’ ratings and grades for CyberArk Software Ltd. and Akamai Technologies, Inc.:
Rating Comparison
CyberArk Rating
- Rating: C- indicating a very favorable view
- Discounted Cash Flow Score: 3, moderate
- ROE Score: 1, very unfavorable
- ROA Score: 1, very unfavorable
- Debt To Equity Score: 2, moderate
- Overall Score: 1, very unfavorable
Akamai Rating
- Rating: B indicating a very favorable view
- Discounted Cash Flow Score: 5, very favorable
- ROE Score: 3, moderate
- ROA Score: 3, moderate
- Debt To Equity Score: 1, very unfavorable
- Overall Score: 3, moderate
Which one is the best rated?
Based purely on the provided data, Akamai holds the better rating with a B grade and higher scores in discounted cash flow, ROE, ROA, and overall score. CyberArk’s scores are generally lower, reflecting a less favorable analyst view.
Scores Comparison
Here is the comparison of financial scores for CyberArk Software Ltd. and Akamai Technologies, Inc.:
CyberArk Scores
- Altman Z-Score: 6.52, indicating a safe zone.
- Piotroski Score: 3, classified as very weak.
Akamai Scores
- Altman Z-Score: 2.46, indicating a grey zone.
- Piotroski Score: 7, classified as strong.
Which company has the best scores?
CyberArk has a much higher Altman Z-Score in the safe zone, suggesting stronger bankruptcy safety. Akamai scores higher on Piotroski, showing better financial strength. Each leads in a different key financial metric.
Grades Comparison
The following is a comparison of the latest available grades from recognized grading companies for both CyberArk Software Ltd. and Akamai Technologies, Inc.:
CyberArk Software Ltd. Grades
This table summarizes recent analyst grades and actions for CyberArk Software Ltd.:
| Grading Company | Action | New Grade | Date |
|---|---|---|---|
| Oppenheimer | Maintain | Outperform | 2024-10-22 |
| Keybanc | Maintain | Overweight | 2024-10-18 |
| Mizuho | Maintain | Outperform | 2024-10-17 |
| BTIG | Maintain | Buy | 2024-10-09 |
| Barclays | Maintain | Overweight | 2024-10-07 |
| Wedbush | Maintain | Outperform | 2024-10-01 |
| Jefferies | Maintain | Buy | 2024-09-24 |
| DA Davidson | Maintain | Buy | 2024-08-09 |
| Rosenblatt | Maintain | Buy | 2024-08-09 |
| Susquehanna | Maintain | Positive | 2024-08-09 |
CyberArk’s grades consistently reflect positive analyst sentiment, with multiple “Buy,” “Outperform,” and “Overweight” ratings maintained over recent months.
Akamai Technologies, Inc. Grades
This table summarizes recent analyst grades and actions for Akamai Technologies, Inc.:
| Grading Company | Action | New Grade | Date |
|---|---|---|---|
| Citigroup | Maintain | Neutral | 2026-01-16 |
| Morgan Stanley | Upgrade | Overweight | 2026-01-12 |
| Scotiabank | Maintain | Sector Outperform | 2026-01-09 |
| RBC Capital | Maintain | Sector Perform | 2026-01-05 |
| Piper Sandler | Maintain | Neutral | 2026-01-05 |
| Keybanc | Upgrade | Overweight | 2025-12-15 |
| TD Cowen | Maintain | Hold | 2025-11-13 |
| Citigroup | Maintain | Neutral | 2025-11-11 |
| Scotiabank | Maintain | Sector Outperform | 2025-11-07 |
| Piper Sandler | Maintain | Neutral | 2025-11-07 |
Akamai’s grades show a mix of “Neutral,” “Hold,” and some upgrades to “Overweight” and “Sector Outperform,” indicating a moderate but less consistently bullish outlook compared to CyberArk.
Which company has the best grades?
CyberArk Software Ltd. has received consistently stronger grades, predominantly “Buy,” “Outperform,” and “Overweight,” indicating greater analyst confidence. Akamai Technologies, Inc. shows a more mixed consensus with several “Neutral” and “Hold” ratings. For investors, this difference may reflect varying expectations of growth or risk profiles between the two companies.
Strengths and Weaknesses
Below is a comparison of key strengths and weaknesses for CyberArk Software Ltd. (CYBR) and Akamai Technologies, Inc. (AKAM) based on their recent financial and strategic performance.
| Criterion | CyberArk Software Ltd. (CYBR) | Akamai Technologies, Inc. (AKAM) |
|---|---|---|
| Diversification | Moderate: Focused on cybersecurity with diversified revenue streams including SaaS, subscriptions, and maintenance | High: Broadly diversified across multiple digital and cloud services markets |
| Profitability | Weak: Negative net margin (-9.34%), negative ROIC (-2.85%), value destroying | Moderate: Positive net margin (12.65%), positive ROE (10.35%), but ROIC (4.74%) below WACC |
| Innovation | Strong in SaaS growth (SaaS revenue rose to $469M in 2024), but declining overall ROIC signals challenges | Solid innovation in cloud and edge computing, stable revenue near $4B, but ROIC trending down |
| Global presence | Growing but limited global scale compared to larger peers | Established global footprint with diversified client base |
| Market Share | Niche cybersecurity leader with strong subscription growth | Large player in content delivery and cloud services with significant market share |
Key takeaway: CyberArk shows strong SaaS revenue growth but is currently value-destroying with declining profitability, signaling caution. Akamai maintains profitability and a strong market position but faces challenges with declining ROIC, requiring close monitoring of efficiency improvements.
Risk Analysis
Below is a comparative risk overview of CyberArk Software Ltd. (CYBR) and Akamai Technologies, Inc. (AKAM) based on the most recent 2024 data.
| Metric | CyberArk Software Ltd. (CYBR) | Akamai Technologies, Inc. (AKAM) |
|---|---|---|
| Market Risk | Moderate (Beta: 0.915) | Lower (Beta: 0.685) |
| Debt level | Very Low (Debt-to-Equity: 0.01) | Moderate to High (Debt-to-Equity: 0.95) |
| Regulatory Risk | Moderate (Global operations, cybersecurity regulations) | Moderate (US-focused, cybersecurity regulations) |
| Operational Risk | Elevated (Negative net margin and ROE, operational inefficiencies) | Moderate (Positive margins but asset turnover concerns) |
| Environmental Risk | Low (Software sector, limited direct exposure) | Low (Software sector, limited direct exposure) |
| Geopolitical Risk | Moderate (Based in Israel with international exposure) | Low to Moderate (US-based with global operations) |
CyberArk faces higher operational and financial risks due to negative profitability and low debt but benefits from a strong balance sheet. Akamai has better profitability and financial scores but carries higher debt, which may increase financial risk if market conditions worsen.
Which Stock to Choose?
CyberArk Software Ltd. (CYBR) shows strong revenue growth of 33.1% in 2024 with a favorable gross margin of 79.18%, but profitability remains negative with a -9.34% net margin and declining returns on equity and assets. Its debt levels are low, supported by favorable debt-to-equity ratios, yet several financial ratios and interest coverage signal weaknesses. The overall rating is very favorable, despite a slightly unfavorable ratio profile and very unfavorable economic moat due to value destruction.
Akamai Technologies, Inc. (AKAM) reports a moderate revenue growth of 4.7% in 2024 and a solid net margin of 12.65%, alongside positive returns on equity (10.35%) and assets (4.87%). The company carries higher debt with a net debt to EBITDA of 3.26, reflected in a moderate debt-to-equity rating. Its financial ratios present a balanced picture with a neutral overall evaluation, a very favorable rating, and a grey-zone economic moat indicating some value erosion but better stability than CYBR.
Investors focused on growth might find CyberArk’s significant revenue expansion appealing despite profitability challenges, while those prioritizing financial stability and consistent profitability could see Akamai as more favorable, given its stronger earnings metrics and balanced financial ratios. Both companies exhibit value destruction in their moats, suggesting caution regarding long-term capital efficiency.
Disclaimer: Investment carries a risk of loss of initial capital. The past performance is not a reliable indicator of future results. Be sure to understand risks before making an investment decision.
Go Further
I encourage you to read the complete analyses of CyberArk Software Ltd. and Akamai Technologies, Inc. to enhance your investment decisions: