Home > Comparison > Technology > CPAY vs AKAM
The strategic rivalry between Corpay, Inc. and Akamai Technologies, Inc. defines the current trajectory of the software infrastructure sector. Corpay excels as a payments-focused technology firm specializing in vehicle and corporate expense solutions. In contrast, Akamai leads with cloud services enhancing cybersecurity and content delivery worldwide. This analysis pits Corpay’s transactional scale against Akamai’s network innovation to identify which growth model offers superior risk-adjusted returns for a diversified portfolio.

Table of contents
Companies Overview
Corpay, Inc. and Akamai Technologies, Inc. are two pivotal players in the software infrastructure sector.
Corpay, Inc.: Payments Infrastructure Specialist
Corpay dominates the payments infrastructure market, focusing on vehicle, lodging, and corporate payments. Its core revenue stems from managing vehicle-related expenses and offering corporate payment solutions worldwide. In 2026, Corpay sharpens its strategy on expanding cross-border and prepaid payment products to capture global market share.
Akamai Technologies, Inc.: Cloud Security and Performance Leader
Akamai commands the cloud services space, specializing in cybersecurity and content delivery. It generates revenue by securing and optimizing internet content, applications, and APIs for enterprises worldwide. In 2026, Akamai prioritizes enhancing edge computing and media delivery solutions to meet rising demand for low-latency digital experiences.
Strategic Collision: Similarities & Divergences
Corpay and Akamai both operate in software infrastructure but diverge sharply in philosophy: Corpay builds a payments ecosystem, while Akamai offers an open cloud platform focused on security and performance. Their battleground lies in serving enterprise clients seeking digital transformation. Corpay’s investment profile leans on steady transaction volumes, whereas Akamai bets on innovation in edge computing and cybersecurity.
Income Statement Comparison
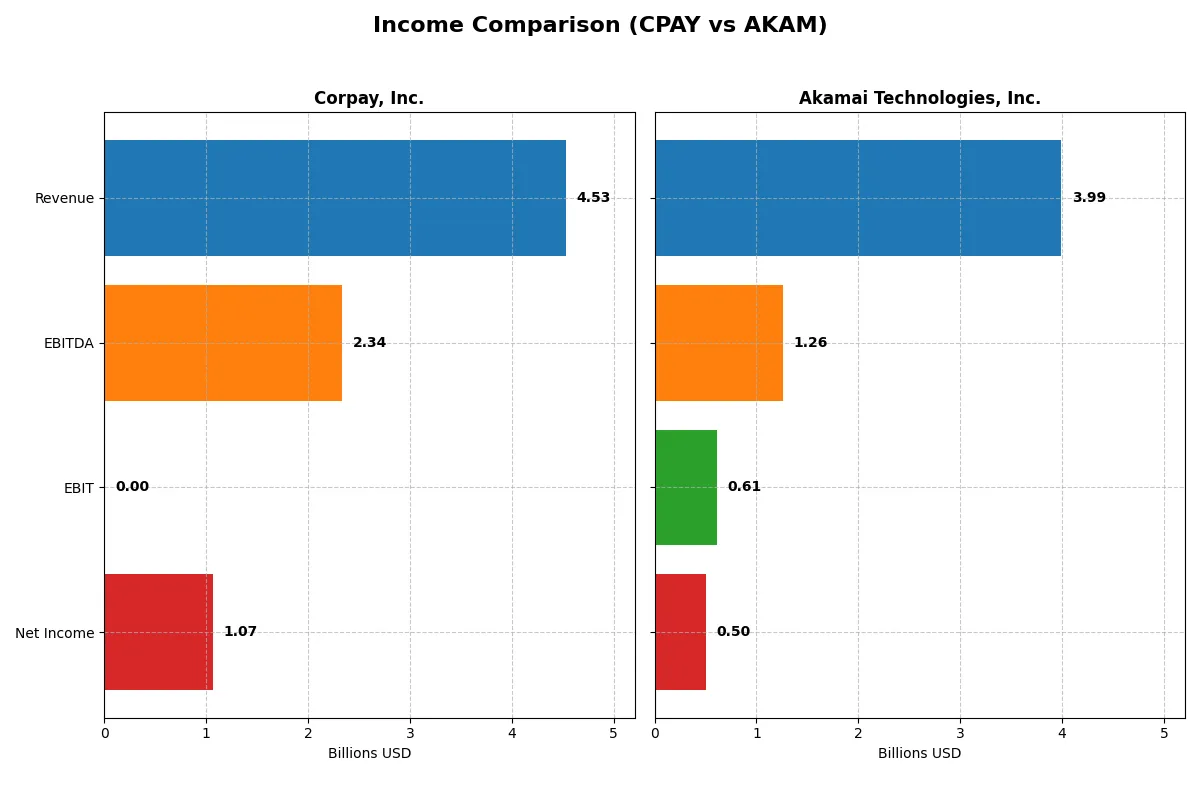
This data dissects the core profitability and scalability of both corporate engines to reveal who dominates the bottom line:
| Metric | Corpay, Inc. (CPAY) | Akamai Technologies, Inc. (AKAM) |
|---|---|---|
| Revenue | 4.53B | 3.99B |
| Cost of Revenue | 0 | 1.62B |
| Operating Expenses | 2.53B | 1.84B |
| Gross Profit | 0 | 2.37B |
| EBITDA | 2.34B | 1.26B |
| EBIT | 0 | 614M |
| Interest Expense | 404M | 27M |
| Net Income | 1.07B | 505M |
| EPS | 15.03 | 3.34 |
| Fiscal Year | 2025 | 2024 |
Income Statement Analysis: The Bottom-Line Duel
This income statement comparison reveals how efficiently each company converts revenue into profit, spotlighting their operational strengths and weaknesses.
Corpay, Inc. Analysis
Corpay’s revenue surged 13.9% in 2025 to 4.53B, driving net income up 6.5% to 1.07B. Despite zero reported gross profit in 2025, net margin remains strong at 23.6%, highlighting tight expense control. However, falling gross and EBIT margins signal underlying cost structure challenges that could pressure future profitability.
Akamai Technologies, Inc. Analysis
Akamai’s 2024 revenue climbed modestly by 4.7% to 3.99B, but net income declined 8% to 505M. The company maintains healthy gross and EBIT margins at 59.4% and 15.4%, respectively, reflecting operational resilience. Yet, recent margin compression and declining EPS suggest slowing momentum and rising costs that weigh on earnings quality.
Margin Dominance vs. Revenue Growth
Corpay leads in top-line growth and net margin, delivering a more robust profit expansion than Akamai. Conversely, Akamai boasts superior gross and EBIT margins but struggles to translate these into net income growth. For investors, Corpay’s aggressive revenue gains paired with solid profitability offer a growth-oriented profile, while Akamai presents a margin-focused but challenged earnings trajectory.
Financial Ratios Comparison
These vital ratios act as a diagnostic tool to expose the underlying fiscal health, valuation premiums, and capital efficiency of the companies compared below:
| Ratios | Corpay, Inc. (CPAY) | Akamai Technologies, Inc. (AKAM) |
|---|---|---|
| ROE | 32.1% | 10.4% |
| ROIC | 10.8% | 4.7% |
| P/E | 23.7 | 28.7 |
| P/B | 7.62 | 2.97 |
| Current Ratio | 1.00 | 1.23 |
| Quick Ratio | 1.00 | 1.23 |
| D/E | 2.56 | 0.95 |
| Debt-to-Assets | 44.5% | 44.7% |
| Interest Coverage | 4.67 | 19.7 |
| Asset Turnover | 0.22 | 0.38 |
| Fixed Asset Turnover | 10.5 | 1.33 |
| Payout ratio | 0 | 0 |
| Dividend yield | 0 | 0 |
| Fiscal Year | 2024 | 2024 |
Efficiency & Valuation Duel: The Vital Signs
Ratios act as a company’s financial DNA, revealing hidden risks and operational excellence that numbers alone cannot capture.
Corpay, Inc.
Corpay posts a strong 32.15% ROE and a robust 25.25% net margin, signaling solid profitability. Its P/E at 23.7 is fairly valued, but a high PB ratio of 7.62 suggests a stretched valuation. The company pays no dividends, likely reinvesting cash to support growth, though its high debt-to-equity ratio and weak current ratio signal financial risk.
Akamai Technologies, Inc.
Akamai delivers a modest 10.35% ROE and a 12.65% net margin, indicating moderate profitability. The stock trades at a higher P/E of 28.7, making it relatively expensive versus peers. Akamai maintains a healthier balance sheet with a better current ratio and strong interest coverage, but it also pays no dividends, focusing on R&D to fuel future innovation.
Premium Valuation vs. Operational Safety
Corpay offers superior profitability but carries financial leverage and liquidity concerns, while Akamai balances moderate returns with a stronger balance sheet. Investors seeking growth might favor Corpay’s aggressive profile; those prioritizing stability may lean toward Akamai’s steadier metrics.
Which one offers the Superior Shareholder Reward?
Corpay, Inc. (CPAY) and Akamai Technologies, Inc. (AKAM) both forgo dividends, focusing on reinvestment and buybacks. CPAY delivers higher net margins (~25% vs. ~13%), with robust free cash flow per share ($25 vs. $5.5 in 2024). CPAY’s payout is zero, but its aggressive buyback strategy, supported by a free cash flow-to-operating cash flow ratio near 0.91, signals strong capital return potential. AKAM’s buybacks are modest relative to cash flow, and lower operating margins limit excess cash. Given CPAY’s superior margin profile, efficient capital allocation, and stronger buyback capacity, I see CPAY as offering the more attractive total return profile for 2026 investors.
Comparative Score Analysis: The Strategic Profile
The radar chart reveals the fundamental DNA and trade-offs of Corpay, Inc. and Akamai Technologies, Inc., highlighting their core financial strengths and vulnerabilities:
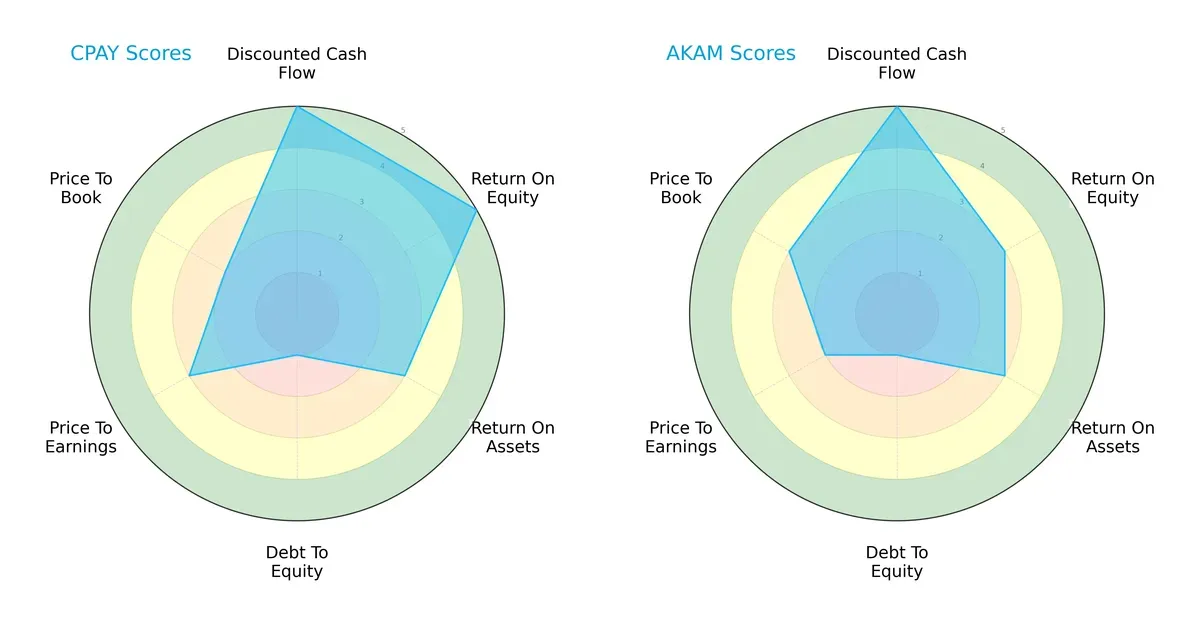
Corpay excels with a superior ROE of 5 versus Akamai’s 3, showing stronger equity efficiency. Both share a perfect DCF score of 5, signaling robust future cash flow expectations. Asset utilization (ROA) is equal at 3, but Corpay’s weaker debt-to-equity score of 1 flags higher leverage risk, matching Akamai’s low score. Valuation metrics diverge: Corpay’s P/E score of 3 and P/B of 2 suggest moderate pricing, while Akamai’s lower P/E (2) and higher P/B (3) indicate a different market perception. Corpay’s profile is less balanced, relying heavily on equity returns, whereas Akamai shows a steadier, if less aggressive, approach.
Bankruptcy Risk: Solvency Showdown
Corpay’s Altman Z-Score of 2.11 trails Akamai’s 2.53, placing both firms in the grey zone with moderate bankruptcy risk in this cycle:
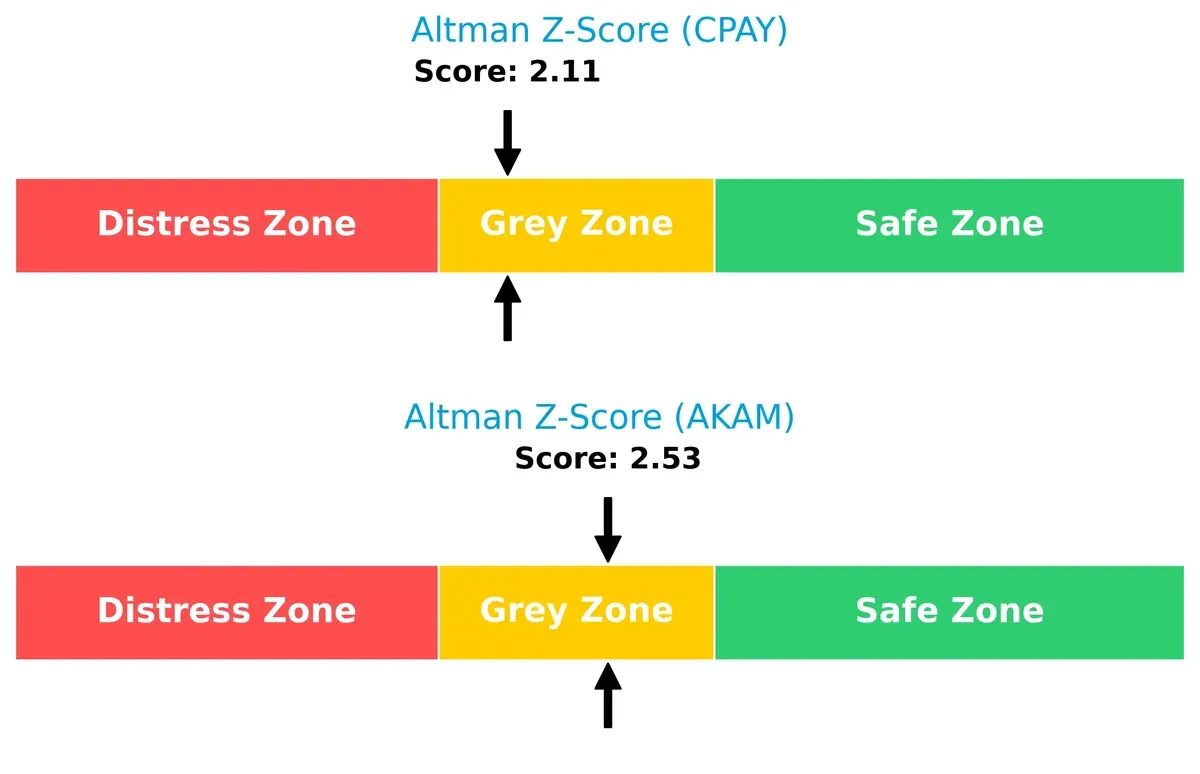
This proximity signals caution. Neither company is in the safe zone above 3, but Akamai’s edge indicates marginally better financial stability and resilience in downturns.
Financial Health: Quality of Operations
Akamai’s Piotroski F-Score of 7 outpaces Corpay’s 5, marking Akamai as financially stronger with fewer internal red flags:
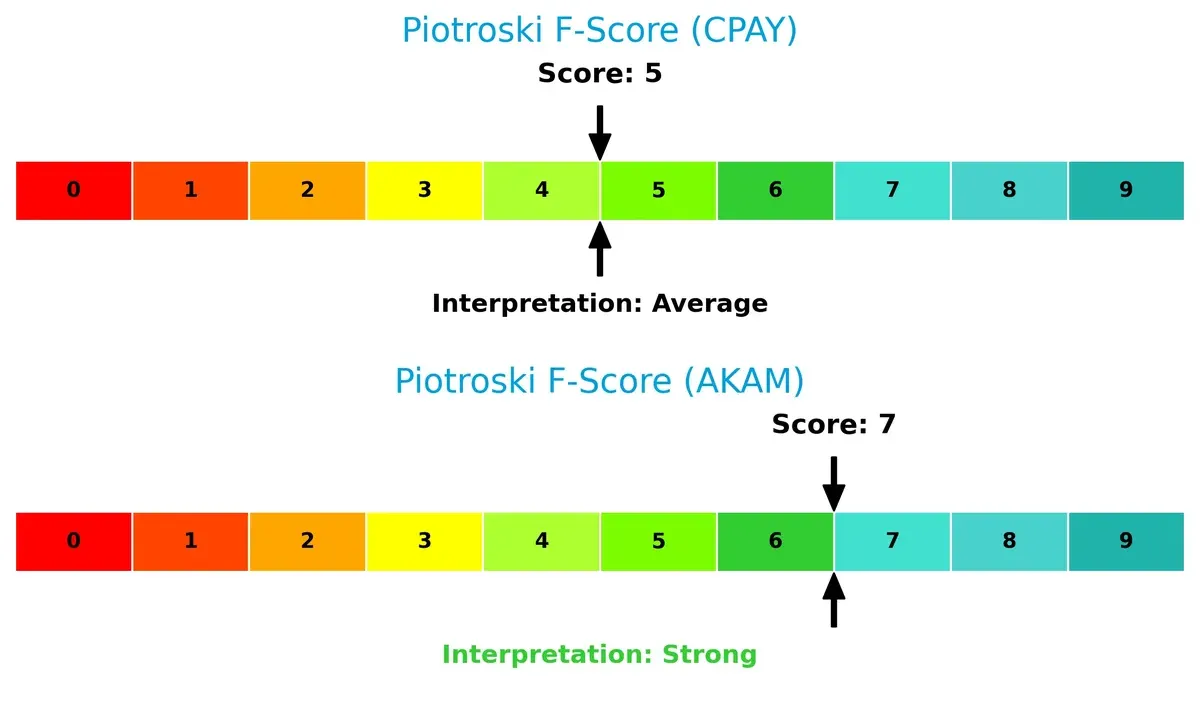
Scores below 6 often suggest operational weaknesses. Akamai’s score reflects more consistent profitability, liquidity, and efficiency metrics, enhancing its investment appeal over Corpay, which shows average financial health.
How are the two companies positioned?
This section dissects the operational DNA of Corpay and Akamai by comparing their revenue distribution and internal dynamics. The goal is to confront their economic moats to identify the most resilient and sustainable advantage today.
Revenue Segmentation: The Strategic Mix
This visual comparison dissects how Corpay, Inc. and Akamai Technologies diversify their income streams and highlights their primary sector bets:
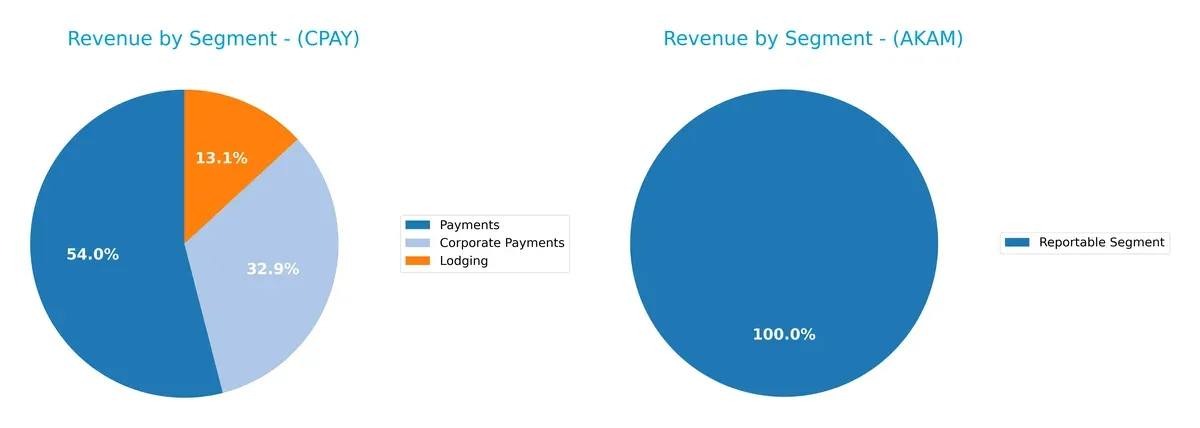
Corpay anchors its revenue in Payments with $2B, supported by Corporate Payments at $1.2B and Lodging at $489M, showing a diversified portfolio. Akamai’s revenue pivots entirely on a single reportable segment of $3.99B, indicating heavy concentration risk. Corpay’s mix suggests ecosystem lock-in across financial services, while Akamai relies on infrastructure dominance but faces vulnerability if that segment underperforms.
Strengths and Weaknesses Comparison
This table compares the strengths and weaknesses of Corpay and Akamai based on diversification, profitability, financials, innovation, global presence, and market share:
Corpay Strengths
- Diversified revenue streams across Corporate Payments, Lodging, and Payments
- High net margin at 25.25%
- Strong ROE at 32.15%
- Favorable fixed asset turnover at 10.52
- Significant US and international revenue, including UK and Brazil
Akamai Strengths
- Favorable net margin of 12.65%
- Positive WACC at 6.28% indicating cost-efficient capital
- Strong interest coverage at 22.65
- Neutral debt to assets at 44.7%
- Balanced US and Non-US revenue near 2B USD each
Corpay Weaknesses
- Unfavorable PB ratio at 7.62 indicating possible overvaluation
- Low current ratio at 1.0 signals tight liquidity
- High debt-to-equity at 2.56 increases financial risk
- Zero interest coverage raises solvency concerns
- Low asset turnover at 0.22 reduces efficiency
- No dividend yield
Akamai Weaknesses
- Unfavorable ROIC at 4.74% below WACC
- High PE at 28.68 may suggest expensive valuation
- Unfavorable asset turnover at 0.38 limits asset use
- No dividend yield
- Moderate ROE at 10.35%
Both companies show strengths in profitability and global presence but face challenges in liquidity and asset efficiency. Corpay’s higher leverage and tighter liquidity contrast with Akamai’s cost of capital advantage yet weaker returns on invested capital. These factors shape their financial resilience and strategic priorities.
The Moat Duel: Analyzing Competitive Defensibility
A structural moat is the only thing protecting long-term profits from competition erosion. Let’s dissect the distinct moats defining these two tech firms:
Corpay, Inc.: Resilient Switching Costs in Payments
Corpay’s moat centers on high switching costs embedded in vehicle and corporate payment solutions. This manifests as stable net margins near 24% despite margin pressure. Expansion into lodging and cross-border markets could deepen its moat in 2026.
Akamai Technologies, Inc.: Fading Cost Advantage in Cloud Services
Akamai relies on cost advantages from its cloud and cybersecurity infrastructure. Unlike Corpay, its ROIC falls below WACC, signaling value destruction. New edge compute offerings may stabilize margins but face intense competition ahead.
Verdict: Switching Costs vs. Cost Advantage Under Pressure
Corpay’s growing ROIC and sticky customer base create a deeper moat than Akamai’s declining profitability and shrinking returns. Corpay is better equipped to defend and expand market share in 2026.
Which stock offers better returns?
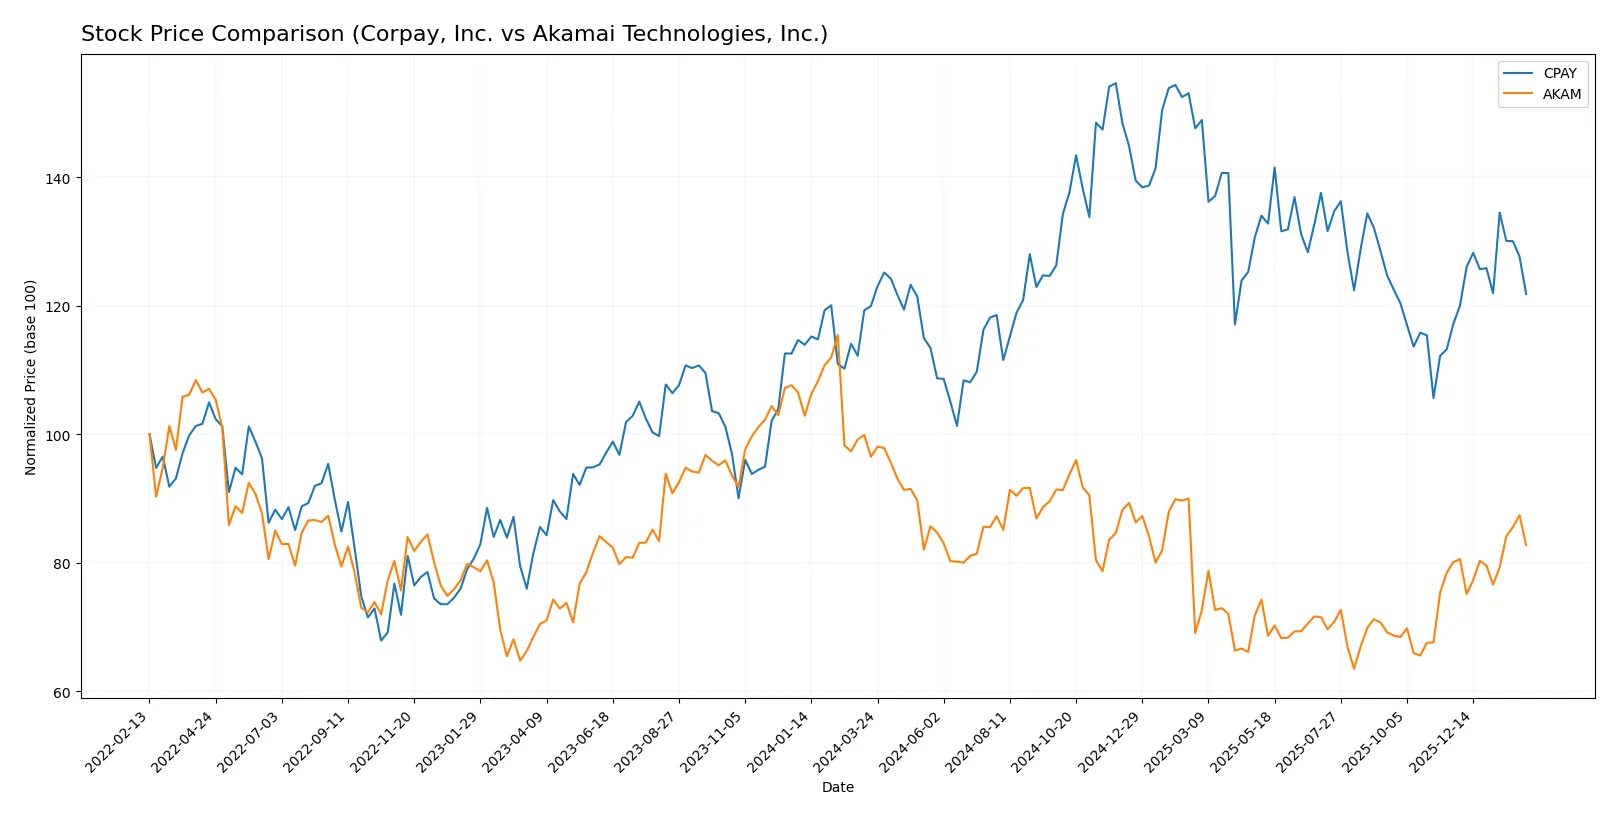
Over the past 12 months, Corpay, Inc. showed a modest price increase with accelerating momentum, while Akamai Technologies, Inc. experienced a significant decline despite recent signs of recovery.
Trend Comparison
Corpay, Inc. posted a 1.57% price rise over the past year, indicating a bullish trend with accelerating gains and notable volatility between 249.66 and 381.18. Akamai Technologies, Inc. fell 14.29% over the same period, reflecting a bearish trend despite recent 3.27% gains and an acceleration in price movement. Corpay’s stock delivered the highest market performance, sustaining overall growth, while Akamai faced a pronounced downward trend despite recent upward correction.
Target Prices
Analysts project solid upside potential based on current consensus target prices.
| Company | Target Low | Target High | Consensus |
|---|---|---|---|
| Corpay, Inc. | 300 | 392 | 367.2 |
| Akamai Technologies, Inc. | 89 | 115 | 104.8 |
Corpay’s consensus target of 367.2 implies a 22% premium to its 300.28 stock price, signaling optimism. Akamai’s 104.8 target is about 14% above its 91.92 price, reflecting moderate upside expectations.

Don’t Let Luck Decide Your Entry Point
Optimize your entry points with our advanced ProRealTime indicators. You’ll get efficient buy signals with precise price targets for maximum performance. Start outperforming now!
How do institutions grade them?
Institutional grades for Corpay, Inc. and Akamai Technologies, Inc. reveal recent analyst perspectives:
Corpay, Inc. Grades
The table below summarizes recent grades from respected financial institutions for Corpay, Inc.:
| Grading Company | Action | New Grade | Date |
|---|---|---|---|
| Morgan Stanley | Upgrade | Overweight | 2026-01-26 |
| Oppenheimer | Maintain | Outperform | 2026-01-12 |
| Oppenheimer | Upgrade | Outperform | 2025-12-05 |
| JP Morgan | Maintain | Overweight | 2025-11-06 |
| RBC Capital | Maintain | Sector Perform | 2025-11-06 |
| UBS | Maintain | Neutral | 2025-11-06 |
| Keefe, Bruyette & Woods | Maintain | Outperform | 2025-10-01 |
| Morgan Stanley | Maintain | Equal Weight | 2025-08-11 |
| UBS | Maintain | Neutral | 2025-08-07 |
| Raymond James | Maintain | Outperform | 2025-08-07 |
Akamai Technologies, Inc. Grades
The table below summarizes recent grades from respected financial institutions for Akamai Technologies, Inc.:
| Grading Company | Action | New Grade | Date |
|---|---|---|---|
| Citigroup | Maintain | Neutral | 2026-01-16 |
| Morgan Stanley | Upgrade | Overweight | 2026-01-12 |
| Scotiabank | Maintain | Sector Outperform | 2026-01-09 |
| RBC Capital | Maintain | Sector Perform | 2026-01-05 |
| Piper Sandler | Maintain | Neutral | 2026-01-05 |
| Keybanc | Upgrade | Overweight | 2025-12-15 |
| TD Cowen | Maintain | Hold | 2025-11-13 |
| Citigroup | Maintain | Neutral | 2025-11-11 |
| Scotiabank | Maintain | Sector Outperform | 2025-11-07 |
| Piper Sandler | Maintain | Neutral | 2025-11-07 |
Which company has the best grades?
Corpay, Inc. consistently earns Outperform and Overweight grades, signaling strong analyst confidence. Akamai Technologies, Inc. holds solid Sector Outperform and Overweight ratings but also several Neutral and Hold grades. Investors may see Corpay’s grades as a sign of higher momentum, while Akamai’s mixed ratings suggest more cautious optimism.
Risks specific to each company
The following categories identify the critical pressure points and systemic threats facing both firms in the 2026 market environment:
1. Market & Competition
Corpay, Inc.
- Faces stiff competition in payments and expense management; sector growth demands innovation.
Akamai Technologies, Inc.
- Competes in cloud security and content delivery; must continuously evolve against cyber threats.
2. Capital Structure & Debt
Corpay, Inc.
- High debt-to-equity ratio (2.56) signals elevated financial risk and potential leverage strain.
Akamai Technologies, Inc.
- Moderate debt-to-equity (0.95) indicates better balance sheet stability and manageable risk.
3. Stock Volatility
Corpay, Inc.
- Beta of 0.808 suggests moderate sensitivity to market swings, below tech sector average.
Akamai Technologies, Inc.
- Beta of 0.723 indicates slightly lower volatility, offering steadier investor returns.
4. Regulatory & Legal
Corpay, Inc.
- Exposure to financial regulations across multiple countries adds compliance complexity.
Akamai Technologies, Inc.
- Must navigate evolving cybersecurity laws and data privacy regulations globally.
5. Supply Chain & Operations
Corpay, Inc.
- Relies on global payment networks; operational disruptions could impair service delivery.
Akamai Technologies, Inc.
- Operates distributed cloud infrastructure; resilience to outages is critical to performance.
6. ESG & Climate Transition
Corpay, Inc.
- Limited disclosure on ESG initiatives; climate risks could affect operational costs.
Akamai Technologies, Inc.
- Increasing focus on sustainable cloud services; better ESG integration seen as competitive edge.
7. Geopolitical Exposure
Corpay, Inc.
- International footprint in Brazil, UK, US exposes it to currency and political risks.
Akamai Technologies, Inc.
- Global presence in cloud services subjects it to geopolitical tensions affecting data flows.
Which company shows a better risk-adjusted profile?
Corpay’s highest risk lies in capital structure with its high leverage and weak interest coverage. Akamai faces its largest risk in market competition and regulatory pressures but maintains a healthier balance sheet and stronger liquidity. Akamai’s superior Altman Z-Score (2.53 vs. 2.11) and Piotroski score (7 vs. 5) reflect stronger financial resilience. Akamai’s stable beta and favorable interest coverage reinforce a better risk-adjusted profile. Corpay’s elevated debt-to-equity and low interest coverage highlight caution despite solid profitability metrics.
Final Verdict: Which stock to choose?
Corpay, Inc. exhibits a superpower in delivering robust returns on equity and a steadily growing ROIC trend, signaling efficient capital use. Its point of vigilance lies in a stretched balance sheet and tight liquidity, which could pressure risk-averse investors. It fits best in an aggressive growth portfolio willing to tolerate higher financial leverage.
Akamai Technologies, Inc. commands a strategic moat through its cloud infrastructure and recurring revenue streams, offering more stability than Corpay. Despite a declining ROIC and moderate profitability, it presents a safer profile with stronger liquidity metrics. It aligns well with GARP investors seeking a balance of growth and reasonable financial prudence.
If you prioritize high return on invested capital and growth potential, Corpay outshines due to its efficient capital deployment and revenue momentum. However, if you seek better stability and a proven recurring revenue moat, Akamai offers a more conservative scenario despite its value destruction signals. Each represents distinct investor profiles with trade-offs between growth and safety.
Disclaimer: Investment carries a risk of loss of initial capital. The past performance is not a reliable indicator of future results. Be sure to understand risks before making an investment decision.
Go Further
I encourage you to read the complete analyses of Corpay, Inc. and Akamai Technologies, Inc. to enhance your investment decisions: