In today’s rapidly evolving tech landscape, Block, Inc. and Akamai Technologies, Inc. stand out as key players in the software infrastructure sector. Both companies serve vital roles in digital payments and cloud security, respectively, with overlapping focuses on innovation and global market reach. This article will analyze their strengths and risks to help you decide which stock could be the most compelling addition to your portfolio in 2026.

Table of contents
Companies Overview
I will begin the comparison between Block, Inc. and Akamai Technologies, Inc. by providing an overview of these two companies and their main differences.
Block, Inc. Overview
Block, Inc. develops tools for sellers to accept card payments, offering hardware like Magstripe readers and Square terminals, alongside software solutions including point-of-sale systems and Cash App for money management. Founded in 2009 and based in Oakland, CA, it serves multiple countries and focuses on enabling seamless payment and retail experiences in the software infrastructure sector.
Akamai Technologies, Inc. Overview
Akamai Technologies provides cloud services that secure, deliver, and optimize internet content and business applications globally. Headquartered in Cambridge, MA, and founded in 1998, Akamai offers cybersecurity, media delivery, and edge compute solutions designed to protect infrastructure and enhance web and mobile performance. It operates primarily in the software infrastructure industry.
Key similarities and differences
Both companies operate in the software infrastructure sector with a focus on technology solutions. Block centers on payment processing and retail tools, combining hardware and software, while Akamai specializes in cloud services for cybersecurity and content delivery. Block’s solutions target sellers and consumers, whereas Akamai focuses on internet performance and security for businesses and developers. Their markets and technology applications reflect distinct but complementary roles in digital infrastructure.
Income Statement Comparison
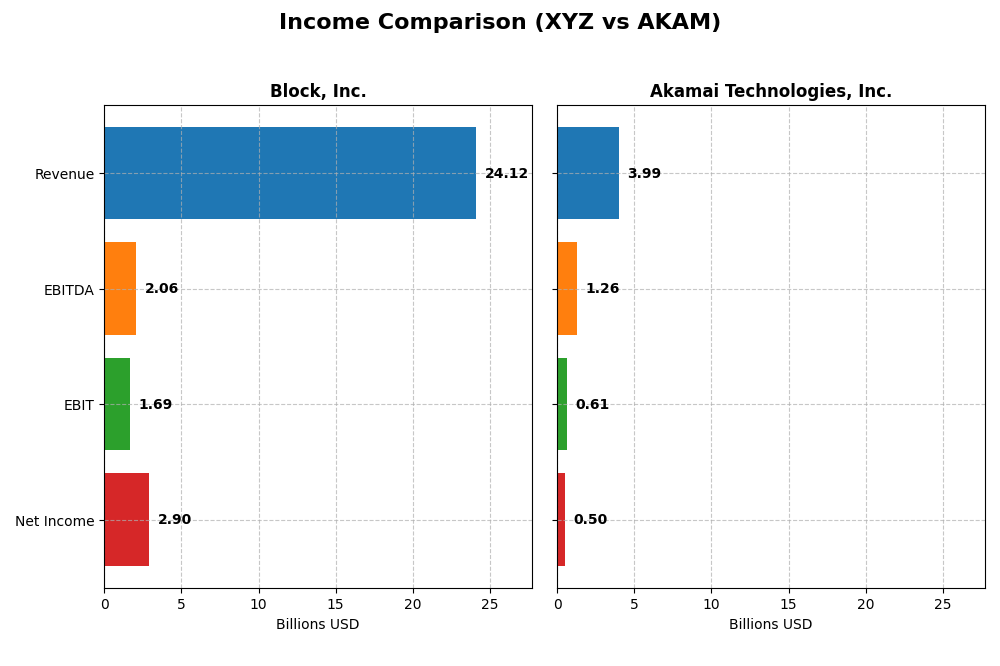
The following table compares key income statement metrics for Block, Inc. and Akamai Technologies, Inc. based on their fiscal year 2024 results.
| Metric | Block, Inc. (XYZ) | Akamai Technologies, Inc. (AKAM) |
|---|---|---|
| Market Cap | 40.2B | 13.4B |
| Revenue | 24.1B | 4.0B |
| EBITDA | 2.06B | 1.26B |
| EBIT | 1.69B | 614M |
| Net Income | 2.90B | 505M |
| EPS | 4.70 | 3.34 |
| Fiscal Year | 2024 | 2024 |
Income Statement Interpretations
Block, Inc.
Block, Inc. shows a strong upward trend in revenue, reaching $24.1B in 2024, with net income dramatically improving to $2.9B. Gross margin remains favorable at 36.85%, and net margin improved to 12.01%. The latest year highlights robust growth in revenue and profitability, although operating expenses grew in line with revenue.
Akamai Technologies, Inc.
Akamai Technologies reported steady revenue growth, reaching $4.0B in 2024, while net income declined to $505M. The company maintains a high gross margin of 59.39% and a solid net margin of 12.65%, but EBIT margin and net margin decreased in 2024. Recent performance shows slower revenue growth and unfavorable trends in earnings and margins.
Which one has the stronger fundamentals?
Block, Inc. demonstrates stronger fundamentals with significant revenue and net income growth, favorable margin expansions, and a positive income statement evaluation. Conversely, Akamai faces headwinds with declining net income and margins despite stable gross profitability. Overall, Block’s income statement metrics reflect a more favorable financial trajectory.
Financial Ratios Comparison
The table below presents a side-by-side comparison of key financial ratios for Block, Inc. (XYZ) and Akamai Technologies, Inc. (AKAM) for the fiscal year 2024.
| Ratios | Block, Inc. (XYZ) | Akamai Technologies, Inc. (AKAM) |
|---|---|---|
| ROE | 13.62% | 10.35% |
| ROIC | 3.03% | 4.74% |
| P/E | 18.10 | 28.68 |
| P/B | 2.47 | 2.97 |
| Current Ratio | 2.33 | 1.23 |
| Quick Ratio | 2.31 | 1.23 |
| D/E | 0.37 | 0.95 |
| Debt-to-Assets | 21.53% | 44.70% |
| Interest Coverage | 95.93 | 19.67 |
| Asset Turnover | 0.66 | 0.38 |
| Fixed Asset Turnover | 45.14 | 1.33 |
| Payout Ratio | 0 | 0 |
| Dividend Yield | 0 | 0 |
Interpretation of the Ratios
Block, Inc.
Block, Inc. shows a balanced mix of favorable and neutral ratios, with strong liquidity reflected in a current ratio of 2.33 and a very high interest coverage ratio of 181.31, which indicates solid debt servicing capacity. However, its return on invested capital (3.03%) and weighted average cost of capital (14.27%) are unfavorable, raising concerns about capital efficiency. The company does not pay dividends, likely prioritizing reinvestment and growth.
Akamai Technologies, Inc.
Akamai Technologies presents a combination of favorable and neutral ratios but also some weaknesses. It has a favorable net margin of 12.65% and a low WACC at 6.14%, supporting value creation. However, its price-to-earnings ratio is relatively high at 28.68, which is unfavorable, and asset turnover is weak at 0.38. Akamai also does not pay dividends, possibly emphasizing reinvestment and innovation over shareholder payouts.
Which one has the best ratios?
Block, Inc. holds a slightly favorable overall ratio profile with half of its metrics rated positively, especially in liquidity and debt management, while Akamai displays a neutral stance with equal favorable and unfavorable ratios, mainly hindered by high valuation and asset efficiency concerns. Thus, Block, Inc. currently exhibits the more robust financial ratio set.
Strategic Positioning
This section compares the strategic positioning of Block, Inc. and Akamai Technologies, Inc., focusing on market position, key segments, and exposure to technological disruption:
Block, Inc.
- Large market cap of 40B in software infrastructure, facing competitive pressure in payment solutions.
- Diversified revenue from software, cryptocurrency assets, hardware, and transaction services.
- Moderate exposure to disruption through evolving payment technologies and cryptocurrency markets.
Akamai Technologies, Inc.
- Mid-sized 13B market cap, active in cloud services and content delivery with moderate competitive pressure.
- Concentrated revenue mainly from cloud and security services for internet content and applications.
- High exposure to disruption via cybersecurity threats and evolving internet infrastructure technologies.
Block, Inc. vs Akamai Technologies, Inc. Positioning
Block has a diversified business model spanning payment hardware, software, and cryptocurrency, offering resilience across segments. Akamai is more concentrated in cloud security and content delivery, which may present focused but riskier exposure to internet technology changes.
Which has the best competitive advantage?
Both companies are currently shedding value, but Block shows a slightly unfavorable yet improving ROIC trend, whereas Akamai faces a very unfavorable trend with declining profitability, indicating Block’s competitive advantage may be more sustainable at present.
Stock Comparison
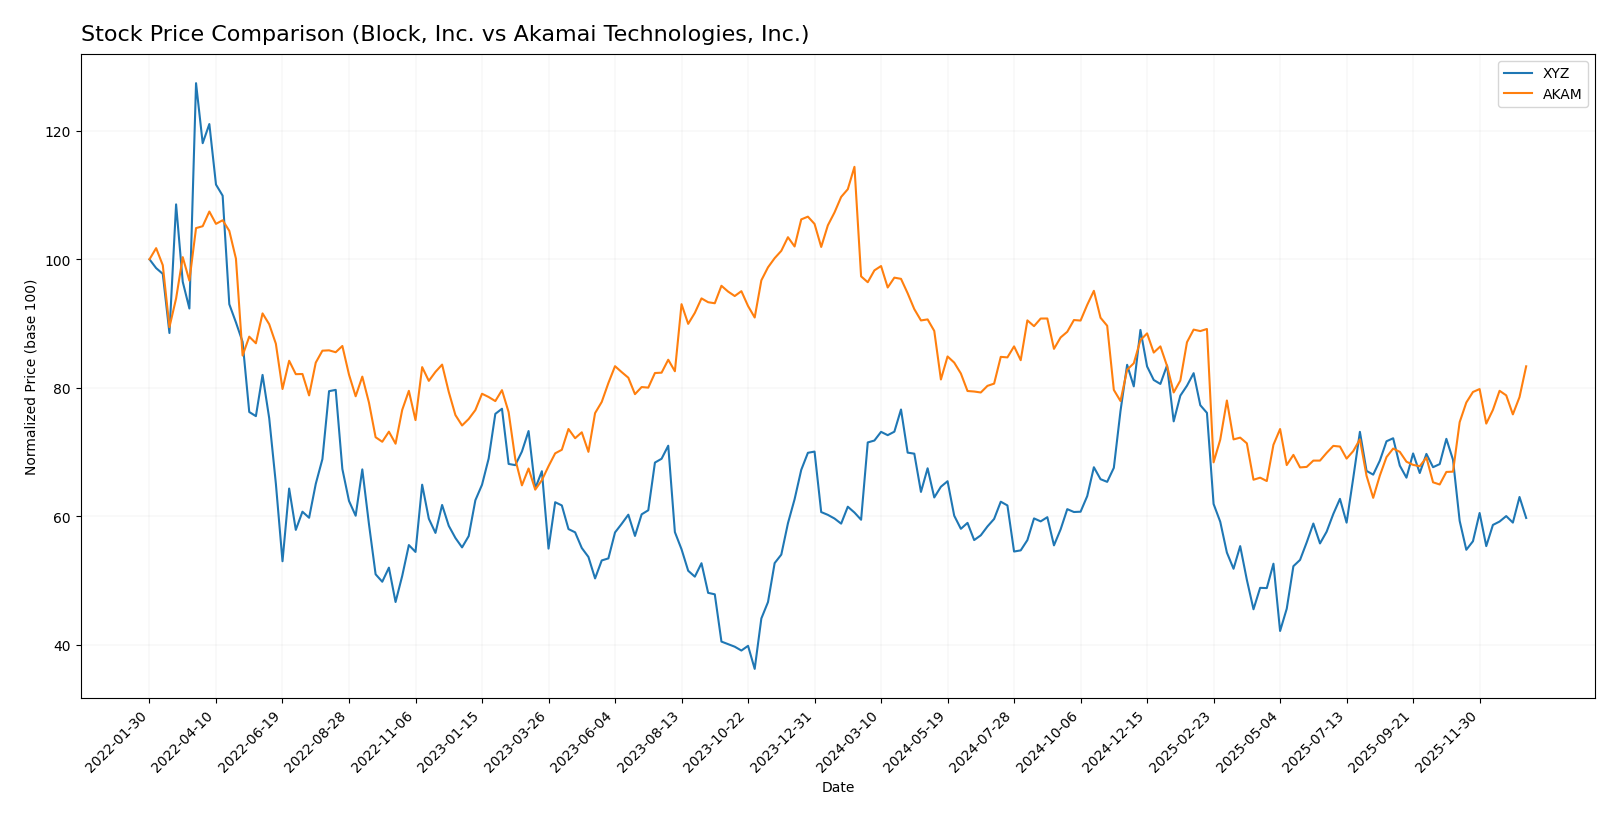
The stock price movements of Block, Inc. and Akamai Technologies, Inc. over the past year reveal contrasting dynamics, with both experiencing overall declines but diverging in recent performance and trading activity.
Trend Analysis
Block, Inc. shows a bearish trend over the last 12 months with a -16.43% price change and a deceleration in decline. The stock fluctuated between a high of 98.25 and a low of 46.53, with overall volatility at 10.43.
Akamai Technologies, Inc. also experienced a bearish trend over 12 months, declining -13.57%, but with accelerating downward momentum. Its price ranged from 70.53 to 111.0, and volatility measured slightly higher at 10.92.
Comparing recent trends, Akamai outperformed Block with a 24.49% price increase versus Block’s -13.16%, indicating stronger short-term momentum and higher buyer dominance in trading volume.
Target Prices
Analysts present a clear target price consensus for Block, Inc. and Akamai Technologies, Inc.
| Company | Target High | Target Low | Consensus |
|---|---|---|---|
| Block, Inc. | 100 | 65 | 84.91 |
| Akamai Technologies, Inc. | 115 | 89 | 104.8 |
The consensus target prices suggest upside potential for both stocks compared to current prices: Block, Inc. trades near 65.95, below its 84.91 consensus, while Akamai trades at 93.49, below its 104.8 consensus. This indicates moderate analyst optimism for both.
Analyst Opinions Comparison
This section compares analysts’ ratings and grades for Block, Inc. and Akamai Technologies, Inc.:
Rating Comparison
Block, Inc. Rating
- Rating: B+, considered very favorable by analysts.
- Discounted Cash Flow Score: Moderate at 3 out of 5.
- ROE Score: Favorable at 4, indicating efficient profit generation.
- ROA Score: Favorable at 4, showing effective asset use.
- Debt To Equity Score: Moderate at 2, moderate financial risk.
- Overall Score: Moderate at 3, indicating average standing.
Akamai Technologies, Inc. Rating
- Rating: B, also considered very favorable by analysts.
- Discounted Cash Flow Score: Very favorable at 5 out of 5.
- ROE Score: Moderate at 3, indicating average efficiency.
- ROA Score: Moderate at 3, showing average asset use.
- Debt To Equity Score: Very unfavorable at 1, higher risk.
- Overall Score: Moderate at 3, indicating average standing.
Which one is the best rated?
Based strictly on the data, Block, Inc. holds a higher rating (B+) and stronger ROE and ROA scores compared to Akamai, which has a better Discounted Cash Flow score but a weaker debt to equity score. Overall, Block appears better rated in profitability and financial risk.
Scores Comparison
Here is a comparison of the financial scores for Block, Inc. and Akamai Technologies, Inc.:
Block, Inc. Scores
- Altman Z-Score: 2.70, indicating moderate bankruptcy risk in the grey zone.
- Piotroski Score: 6, reflecting average financial strength.
Akamai Technologies, Inc. Scores
- Altman Z-Score: 2.46, also in the grey zone with moderate bankruptcy risk.
- Piotroski Score: 7, indicating strong financial health.
Which company has the best scores?
Based on the provided data, Akamai Technologies shows a slightly lower Altman Z-Score but remains in the grey zone, and a higher Piotroski Score than Block, suggesting relatively stronger financial health.
Grades Comparison
Here is a comparison of the latest grades from recognized grading companies for Block, Inc. and Akamai Technologies, Inc.:
Block, Inc. Grades
This table summarizes recent grades and rating actions from leading financial analysts for Block, Inc.:
| Grading Company | Action | New Grade | Date |
|---|---|---|---|
| Piper Sandler | Maintain | Underweight | 2026-01-14 |
| Keefe, Bruyette & Woods | Maintain | Outperform | 2026-01-02 |
| Needham | Maintain | Buy | 2025-11-24 |
| B of A Securities | Maintain | Buy | 2025-11-21 |
| Morgan Stanley | Maintain | Equal Weight | 2025-11-21 |
| BTIG | Maintain | Buy | 2025-11-20 |
| RBC Capital | Maintain | Outperform | 2025-11-20 |
| Stephens & Co. | Maintain | Overweight | 2025-11-20 |
| Mizuho | Maintain | Outperform | 2025-11-20 |
| BTIG | Maintain | Buy | 2025-11-14 |
The overall trend for Block, Inc. shows a majority of buy and outperform ratings, with a few analysts maintaining neutral or underweight positions.
Akamai Technologies, Inc. Grades
Below are the recent grade updates from established grading firms for Akamai Technologies, Inc.:
| Grading Company | Action | New Grade | Date |
|---|---|---|---|
| Citigroup | Maintain | Neutral | 2026-01-16 |
| Morgan Stanley | Upgrade | Overweight | 2026-01-12 |
| Scotiabank | Maintain | Sector Outperform | 2026-01-09 |
| RBC Capital | Maintain | Sector Perform | 2026-01-05 |
| Piper Sandler | Maintain | Neutral | 2026-01-05 |
| Keybanc | Upgrade | Overweight | 2025-12-15 |
| TD Cowen | Maintain | Hold | 2025-11-13 |
| Citigroup | Maintain | Neutral | 2025-11-11 |
| Scotiabank | Maintain | Sector Outperform | 2025-11-07 |
| Piper Sandler | Maintain | Neutral | 2025-11-07 |
Akamai Technologies shows a mixed but generally neutral to positive set of ratings, including upgrades to overweight and consistent sector outperform calls.
Which company has the best grades?
Block, Inc. has predominantly buy and outperform grades, indicating stronger analyst confidence compared to Akamai Technologies, which holds mostly neutral to sector perform ratings with fewer buy-side upgrades. This could influence investors seeking more aggressive growth opportunities toward Block, while Akamai’s grades suggest a more cautious stance.
Strengths and Weaknesses
Below is a comparison of key strengths and weaknesses for Block, Inc. (XYZ) and Akamai Technologies, Inc. (AKAM) based on the most recent financial data and strategic positioning.
| Criterion | Block, Inc. (XYZ) | Akamai Technologies, Inc. (AKAM) |
|---|---|---|
| Diversification | Highly diversified revenue streams: Software & Data Products (7.16B), Cryptocurrency Assets (10.2B), Hardware & Transaction services | Less diversified, single main segment revenue of ~4.0B USD |
| Profitability | Net margin favorable at 12.01%, but ROIC (3.03%) below WACC (14.27%) indicating value destruction | Net margin favorable at 12.65%, ROIC (4.74%) above WACC (6.14%) but overall value destruction with declining profitability |
| Innovation | Strong growth in Software and Cryptocurrency sectors, indicating innovation focus | Moderate innovation with stable technology offerings but no significant growth in core metrics |
| Global presence | Broad global footprint supporting multiple sectors, especially in digital payments and crypto | Global CDN and cloud services presence but limited revenue diversification |
| Market Share | Significant in fintech and crypto markets, growing transaction base | Established player in content delivery networks but facing market pressure and slowing growth |
Key takeaways: Block, Inc. shows strong diversification and favorable profit margins, yet struggles with capital efficiency and value creation. Akamai has stable profitability but suffers from declining ROIC and less diversification, signaling higher risk. Investors should weigh growth potential against value destruction risks in both cases.
Risk Analysis
The following table summarizes the key risks faced by Block, Inc. and Akamai Technologies, Inc. as of 2024, helping investors compare their risk profiles effectively.
| Metric | Block, Inc. (XYZ) | Akamai Technologies, Inc. (AKAM) |
|---|---|---|
| Market Risk | High beta of 2.67 indicates high volatility and sensitivity to market swings. | Low beta of 0.69 suggests lower volatility and more stability relative to the market. |
| Debt level | Low debt-to-equity ratio of 0.37, indicating moderate leverage and financial stability. | Higher debt-to-equity ratio near 0.95, reflecting significant leverage and increased financial risk. |
| Regulatory Risk | Moderate, operating in multiple countries with evolving payment and data regulations. | Moderate, due to global cloud and cybersecurity regulations. |
| Operational Risk | Exposure to hardware and software integration challenges; reliance on continuous innovation. | Dependence on cybersecurity effectiveness and cloud infrastructure reliability. |
| Environmental Risk | Limited direct environmental impact; focus on digital services reduces exposure. | Similar low environmental footprint but increasing scrutiny on data centers’ energy use. |
| Geopolitical Risk | Moderate, with operations in US, Europe, Japan, Australia; sensitive to trade and data transfer policies. | Moderate, global presence exposes it to geopolitical tensions affecting internet infrastructure. |
Block, Inc. carries higher market risk due to its elevated beta and faces operational risks tied to hardware-software synergy. Akamai’s high leverage is a critical financial risk, though it benefits from lower market volatility. Both companies face moderate regulatory and geopolitical risks given their international footprints. Investors should weigh Block’s innovation-driven volatility against Akamai’s debt-related caution.
Which Stock to Choose?
Block, Inc. (XYZ) shows a favorable income evolution with 10.06% revenue growth and strong net margin improvement. Its financial ratios are slightly favorable, highlighting good liquidity and low debt. Profitability is moderate, and the company’s rating is very favorable (B+). Debt levels remain low, and interest coverage is strong.
Akamai Technologies, Inc. (AKAM) displays a neutral income evolution with modest revenue growth but unfavorable net income trends over the period. Its financial ratios are neutral overall, with some strengths in cash flow but higher leverage. Profitability is solid with a favorable net margin, and the rating is also very favorable (B), yet debt metrics are less favorable.
For investors, the choice might depend on risk tolerance: those seeking growth exposure could see Block’s improving profitability and strong liquidity as positive signals, while more conservative or income-focused investors might view Akamai’s stable profit margins and recent positive price trend as attractive, despite its higher leverage and less favorable income dynamics.
Disclaimer: Investment carries a risk of loss of initial capital. The past performance is not a reliable indicator of future results. Be sure to understand risks before making an investment decision.
Go Further
I encourage you to read the complete analyses of Block, Inc. and Akamai Technologies, Inc. to enhance your investment decisions: