Home > Comparison > Consumer Cyclical > ABNB vs RCL
The strategic rivalry between Airbnb, Inc. and Royal Caribbean Cruises Ltd. shapes the future of travel services. Airbnb operates a scalable, asset-light platform connecting hosts and guests globally, while Royal Caribbean commands a capital-intensive cruise fleet with extensive global itineraries. This analysis pits platform-driven growth against traditional experiential travel. I will evaluate which company’s business model offers a superior risk-adjusted return for a diversified portfolio in the evolving consumer cyclical sector.
Table of contents
Companies Overview
Airbnb and Royal Caribbean Cruises dominate distinct segments of the travel services industry with unique market approaches.
Airbnb, Inc.: Marketplace Pioneer in Travel Stays
Airbnb, Inc. leads as a platform-based marketplace connecting hosts and guests worldwide. It generates revenue by facilitating bookings for private rooms and vacation homes through its online and mobile channels. In 2026, Airbnb focuses strategically on expanding its user base and enhancing its technological infrastructure to deepen market penetration.
Royal Caribbean Cruises Ltd.: Global Cruise Operator
Royal Caribbean Cruises Ltd. stands as a premier cruise company operating 61 ships across diverse brands. Its core revenue stems from providing cruise experiences to roughly 1,000 destinations globally. In 2026, Royal Caribbean targets fleet modernization and route expansion to reclaim market share post-pandemic.
Strategic Collision: Similarities & Divergences
Both companies thrive in the travel sector but diverge sharply in delivery models—Airbnb’s digital marketplace contrasts with Royal Caribbean’s asset-heavy cruise operations. Their primary battleground lies in capturing discretionary travel spending. Airbnb’s scalability appeals to tech-savvy travelers, while Royal Caribbean leverages experiential luxury. These differences shape distinct investment profiles: one asset-light and tech-driven, the other capital-intensive and experience-focused.
Income Statement Comparison
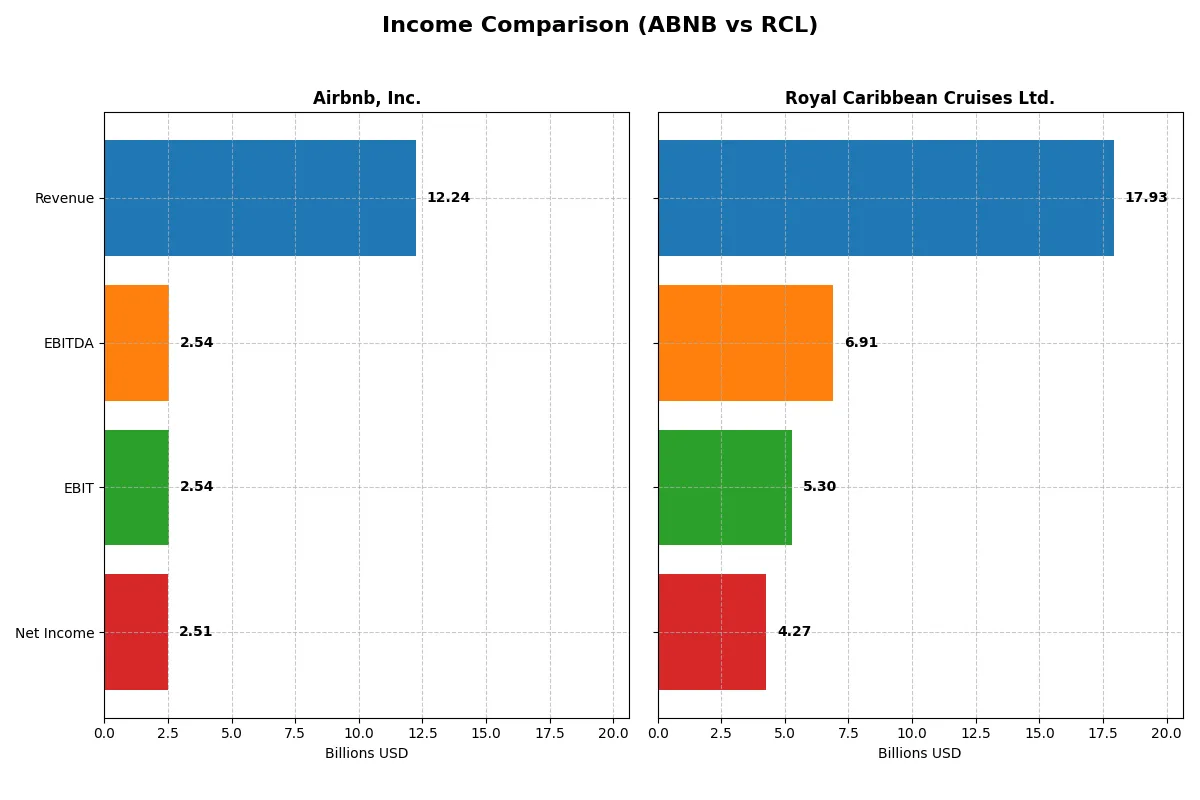
This data dissects the core profitability and scalability of both corporate engines to reveal who dominates the bottom line:
| Metric | Airbnb, Inc. (ABNB) | Royal Caribbean Cruises Ltd. (RCL) |
|---|---|---|
| Revenue | 12.2B | 17.9B |
| Cost of Revenue | 2.09B | 9.54B |
| Operating Expenses | 7.61B | 3.49B |
| Gross Profit | 10.2B | 8.40B |
| EBITDA | 2.54B | 6.91B |
| EBIT | 2.54B | 5.30B |
| Interest Expense | 0 | 992M |
| Net Income | 2.51B | 4.29B |
| EPS | 4.1 | 15.73 |
| Fiscal Year | 2025 | 2025 |
Income Statement Analysis: The Bottom-Line Duel
This income statement comparison reveals which company runs its business engine with greater efficiency and profit momentum.
Airbnb, Inc. Analysis
Airbnb’s revenue climbed steadily to $12.2B in 2025, with net income reaching $2.5B. Its gross margin remains robust at 83%, showcasing strong cost control. However, net income slightly dipped year-over-year, reflecting tightening net margins and a small decline in EBIT despite solid revenue growth.
Royal Caribbean Cruises Ltd. Analysis
Royal Caribbean posted higher revenue of $17.9B in 2025, with net income at $4.3B. The company’s gross margin is a more modest 47%, yet its EBIT margin excels at nearly 30%. It improved net margin and EPS sharply over the last year, signaling operational leverage and strong profit momentum.
Margin Power vs. Revenue Scale
Royal Caribbean delivers superior EBIT and net margin growth, capitalizing on scale and operational efficiency. Airbnb boasts higher gross margins but faces margin pressure and slight earnings decline. For investors, Royal Caribbean’s profile offers stronger profitability acceleration, while Airbnb shows resilience with a premium margin base.
Financial Ratios Comparison
These vital ratios act as a diagnostic tool to expose the underlying fiscal health, valuation premiums, and capital efficiency of the companies compared below:
| Ratios | Airbnb, Inc. (ABNB) | Royal Caribbean Cruises Ltd. (RCL) |
|---|---|---|
| ROE | 30.63% | 42.57% |
| ROIC | 19.29% | 14.90% |
| P/E | 33.13 | 17.69 |
| P/B | 10.15 | 7.53 |
| Current Ratio | 1.38 | 0.18 |
| Quick Ratio | 1.38 | 0.16 |
| D/E (Debt-to-Equity) | 0.24 | 2.26 |
| Debt-to-Assets | 9.00% | 54.39% |
| Interest Coverage | 0 | 4.95 |
| Asset Turnover | 0.55 | 0.43 |
| Fixed Asset Turnover | 0 | 0.49 |
| Payout Ratio | 0 | 6.18% |
| Dividend Yield | 0 | 0.35% |
| Fiscal Year | 2025 | 2025 |
Efficiency & Valuation Duel: The Vital Signs
Financial ratios act as a company’s DNA, revealing hidden risks, operational strengths, and valuation nuances critical for investment decisions.
Airbnb, Inc.
Airbnb demonstrates strong profitability with a 30.6% ROE and a 20.5% net margin, signaling operational efficiency. Its valuation appears stretched, with a high P/E of 33.1 and P/B of 10.1. The firm retains earnings for aggressive R&D, foregoing dividends to fuel growth and innovation.
Royal Caribbean Cruises Ltd.
Royal Caribbean posts a robust 42.6% ROE and a 23.8% net margin, reflecting solid profitability. It trades at a more moderate P/E of 17.7 but bears heavy leverage, with a debt-to-equity ratio of 2.26. The company pays a modest dividend yield of 0.35%, balancing shareholder returns with capital needs.
Growth Potential vs. Financial Stability
Airbnb offers a growth-focused profile with favorable returns on capital but a stretched valuation. Royal Caribbean delivers higher immediate profitability but carries significant financial risk due to leverage. Investors seeking growth may prefer Airbnb’s reinvestment strategy; those prioritizing income and established returns might lean toward Royal Caribbean.
Which one offers the Superior Shareholder Reward?
I see Airbnb (ABNB) pays no dividends, reinvesting its robust free cash flow (7.6/share in 2025) into growth and innovation. Royal Caribbean (RCL) offers a modest 0.35% dividend yield with a low 6% payout ratio, but its buyback impact is unclear. Airbnb’s zero payout ratio and strong buybacks reflect a sustainable growth-driven model. RCL’s high debt and thin free cash flow coverage raise red flags for dividend sustainability. I conclude Airbnb offers a superior total return potential in 2026, balancing disciplined capital allocation and growth.
Comparative Score Analysis: The Strategic Profile
The radar chart reveals the fundamental DNA and trade-offs of Airbnb, Inc. and Royal Caribbean Cruises Ltd., illustrating their distinct financial strengths and vulnerabilities:
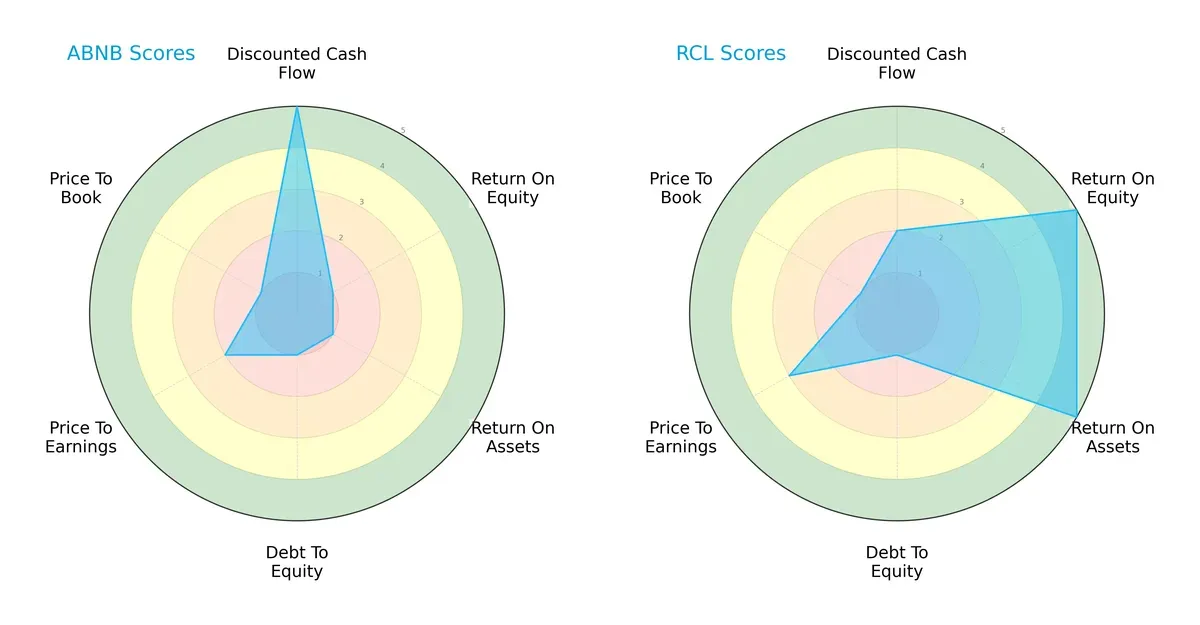
Airbnb shines with a top-tier discounted cash flow (DCF) score of 5, signaling strong future cash flow expectations. However, it suffers in profitability and leverage, scoring just 1 in ROE, ROA, and debt-to-equity, reflecting operational challenges and high financial risk. Royal Caribbean, by contrast, excels in profitability metrics (ROE and ROA both 5), showcasing robust asset and equity efficiency, but struggles with valuation and leverage, similar to Airbnb. Overall, Royal Caribbean presents a more balanced profile, leveraging core operational strengths, while Airbnb relies heavily on its growth potential.
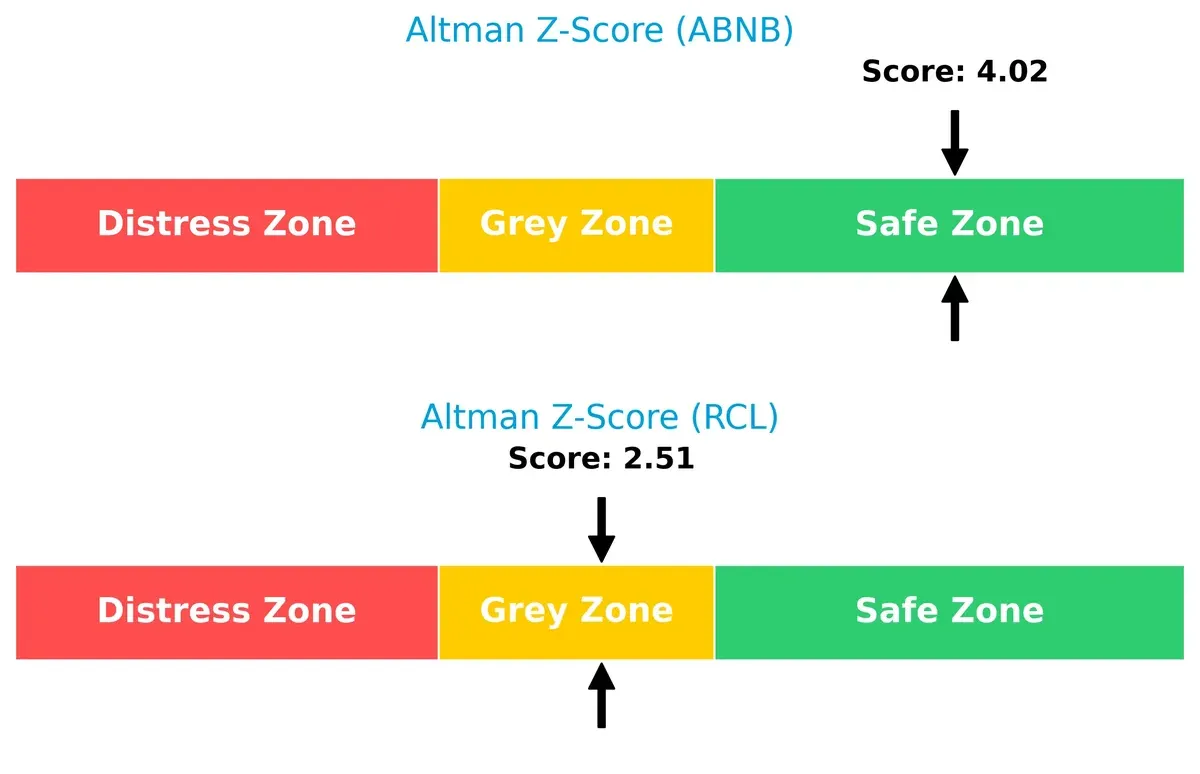
Bankruptcy Risk: Solvency Showdown
The Altman Z-Score delta favors Airbnb with a 4.02 score in the safe zone, signaling strong solvency and low bankruptcy risk. Royal Caribbean’s 2.51 lands in the grey zone, indicating moderate financial distress risk in this cycle:
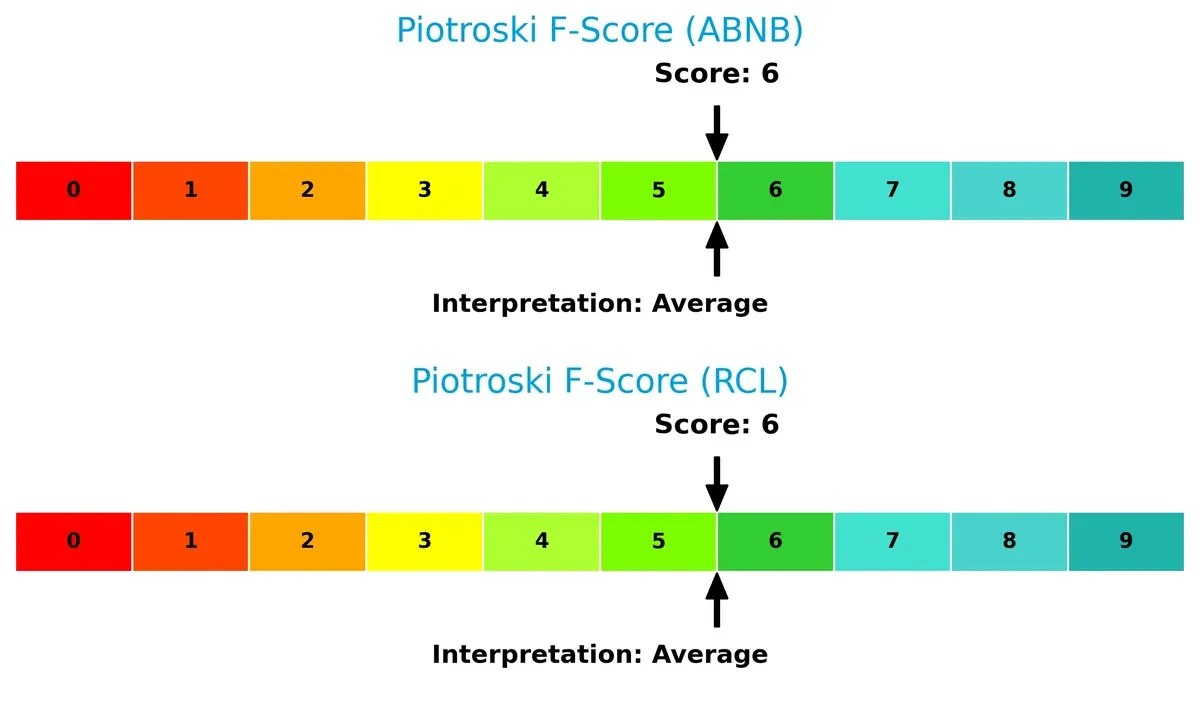
Financial Health: Quality of Operations
Both firms share an identical Piotroski F-Score of 6, placing them in average financial health territory. Neither shows acute red flags, but both have room to strengthen internal financial controls and profitability metrics:
How are the two companies positioned?
This section dissects Airbnb’s and Royal Caribbean’s operational DNA by comparing their revenue segments and internal dynamics. The goal is to confront their economic moats and identify which model offers the most resilient competitive advantage today.
Revenue Segmentation: The Strategic Mix
This comparison dissects how Airbnb and Royal Caribbean diversify income streams and reveals their primary sector bets:
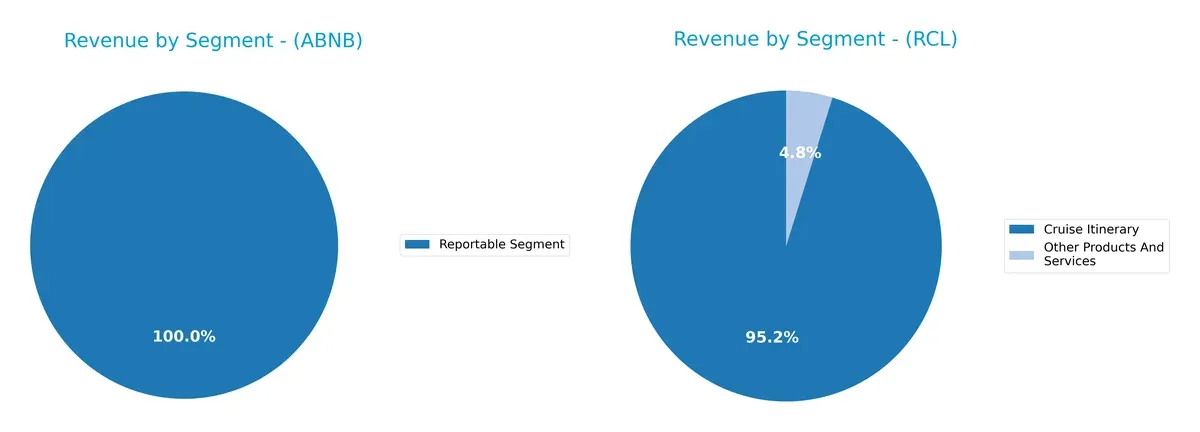
Airbnb’s revenue comes from a single reported segment, anchoring its income in platform-driven lodging services totaling $12.2B in 2025. Royal Caribbean dwarfs this with $17.1B from Cruise Itineraries and $864M from Other Products, showing a more diversified mix. RCL’s reliance on cruise itineraries signals infrastructure dominance but exposes it to sector-specific risks, while Airbnb’s concentration may risk volatility but benefits from ecosystem lock-in.
Strengths and Weaknesses Comparison
This table compares the strengths and weaknesses of Airbnb, Inc. and Royal Caribbean Cruises Ltd.:
Airbnb, Inc. Strengths
- Favorable net margin at 20.51%
- High ROE at 30.63%
- Strong ROIC at 19.29%
- Low debt to assets at 9.0%
- Favorable quick ratio at 1.38
- Diversified global revenue across North America, EMEA, Asia Pacific, Latin America
Royal Caribbean Cruises Ltd. Strengths
- Higher net margin at 23.82%
- Very high ROE at 42.57%
- Favorable ROIC at 14.9%
- Positive interest coverage at 5.34
- Large revenue base with cruise and other services
- Broad global presence weighted in North America, Europe, Asia Pacific
Airbnb, Inc. Weaknesses
- Unfavorable high P/E at 33.13 and P/B at 10.15
- No dividend yield
- Fixed asset turnover at 0 indicating asset-light model
- Neutral current ratio at 1.38 may limit short-term flexibility
Royal Caribbean Cruises Ltd. Weaknesses
- Unfavorable high debt to equity at 2.26 and debt to assets at 54.39%
- Low current and quick ratios at 0.18 and 0.16
- Unfavorable P/B at 7.53 and dividend yield at 0.35%
- Lower asset turnover ratios reflecting capital-intensive operations
Airbnb shows strong profitability and low leverage with broad geographic diversification but carries valuation risk and limited asset base. Royal Caribbean delivers higher returns but faces significant financial leverage and liquidity risks, reflecting the capital-intensive cruise industry.
The Moat Duel: Analyzing Competitive Defensibility
A structural moat is the only barrier protecting long-term profits from relentless competitive erosion in dynamic markets. Let’s dissect how two travel giants defend their turf:
Airbnb, Inc.: Network Effects Powerhouse
Airbnb’s core moat lies in its network effects, connecting millions of hosts and guests globally. This generates high ROIC of 10.4%, showcasing efficient capital use and margin stability. Expansion into new markets like Asia Pacific in 2026 could deepen this advantage, but rising competition from alternative platforms poses risks.
Royal Caribbean Cruises Ltd.: Scale-Driven Cost Advantage
Royal Caribbean’s moat stems from its massive fleet and global itinerary scale, enabling cost advantages and premium pricing. It boasts a solid ROIC spread over WACC of 4.1%, driven by operational efficiency and strong EBIT margin near 30%. Future growth hinges on fleet modernization and expansion into emerging cruise markets.
Network Effects vs. Scale Economies: Who Fortifies Better?
Airbnb’s wider moat benefits from digital network effects and scalable platform economics. Royal Caribbean’s moat, while deep in capital intensity and scale, faces higher capital reinvestment demands. I conclude Airbnb holds the deeper moat, better equipped to defend market share amid evolving consumer travel preferences.
Which stock offers better returns?
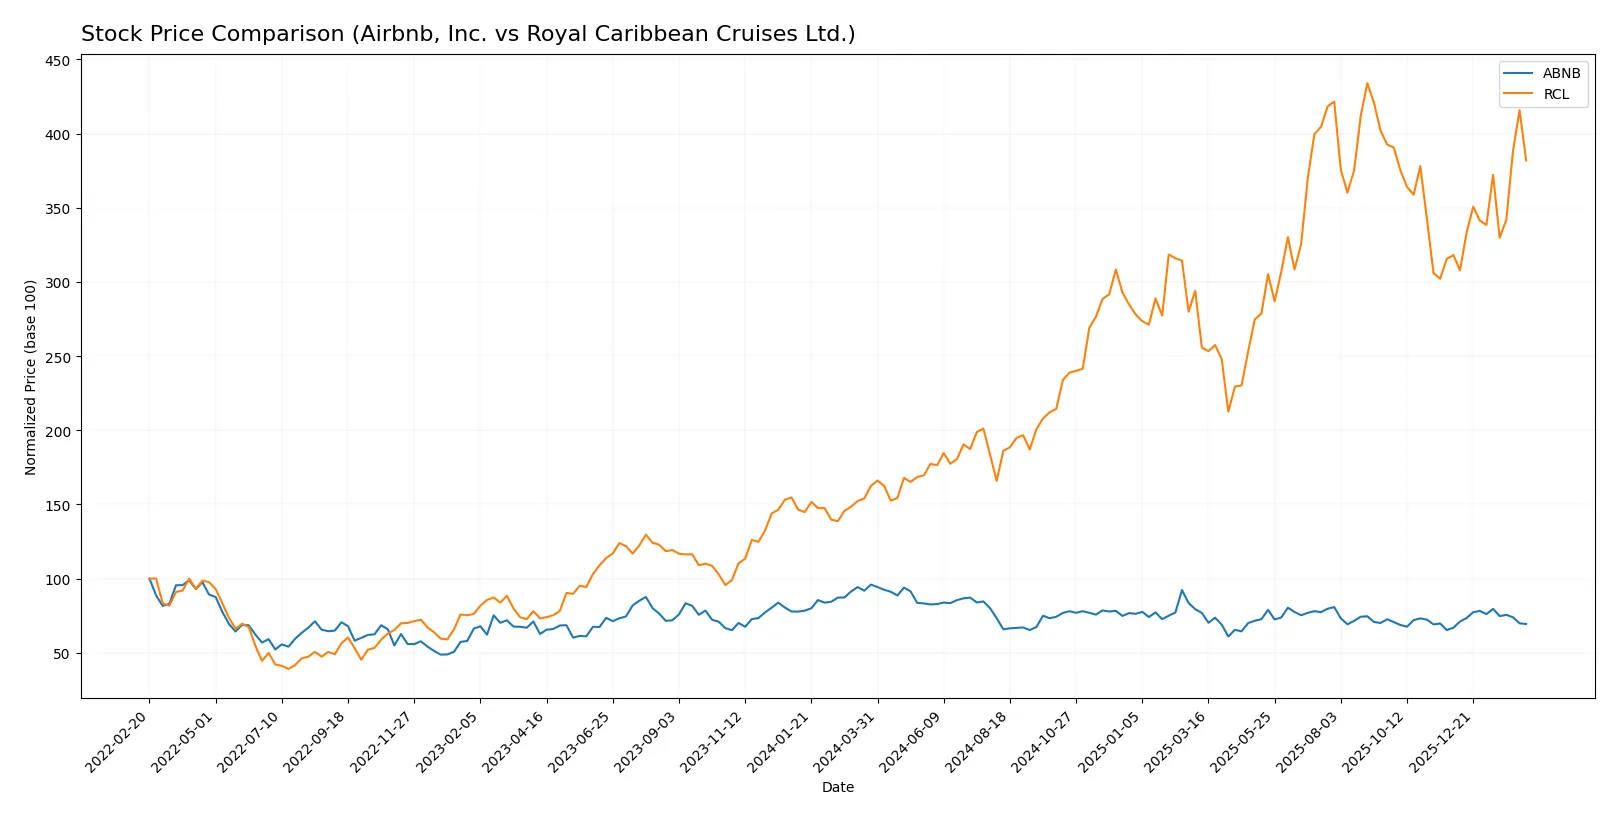
Over the past 12 months, Airbnb’s stock declined sharply while Royal Caribbean surged, showing contrasting trading dynamics and notable price volatility in both cases.
Trend Comparison
Airbnb’s stock fell 27.71% over the past year, marking a bearish trend with accelerating decline and a high price volatility of 12.58. The recent three-month period shows a modest 3.73% rebound.
Royal Caribbean’s stock gained 134.97% over the last year, reflecting a strong bullish trend with accelerating momentum and high volatility at 66.51. Its recent three-month rise accelerated sharply by 20.04%.
Royal Caribbean outperformed Airbnb significantly, delivering the highest market returns with sustained strong upward momentum throughout the year.
Target Prices
Analysts present a cautiously optimistic consensus on Airbnb, Inc. and Royal Caribbean Cruises Ltd., suggesting upside potential from current levels.
| Company | Target Low | Target High | Consensus |
|---|---|---|---|
| Airbnb, Inc. | 107 | 170 | 141.93 |
| Royal Caribbean Cruises Ltd. | 318 | 425 | 367.5 |
The consensus target for Airbnb at $141.93 implies a 17% upside from its $121.35 price. Royal Caribbean’s $367.5 target suggests a 15% gain versus its $319.61 price, reflecting solid analyst confidence.

Don’t Let Luck Decide Your Entry Point
Optimize your entry points with our advanced ProRealTime indicators. You’ll get efficient buy signals with precise price targets for maximum performance. Start outperforming now!
How do institutions grade them?
The following tables summarize recent institutional grades for Airbnb, Inc. and Royal Caribbean Cruises Ltd.:
Airbnb, Inc. Grades
Below are the latest grade updates from reputable grading firms for Airbnb, Inc.:
| Grading Company | Action | New Grade | Date |
|---|---|---|---|
| Wedbush | Maintain | Neutral | 2026-02-13 |
| Evercore ISI Group | Upgrade | Outperform | 2026-02-13 |
| Barclays | Maintain | Equal Weight | 2026-02-13 |
| Deutsche Bank | Upgrade | Buy | 2026-02-13 |
| TD Cowen | Maintain | Buy | 2026-02-13 |
| Wells Fargo | Maintain | Equal Weight | 2026-02-13 |
| BMO Capital | Maintain | Market Perform | 2026-02-13 |
| Benchmark | Maintain | Buy | 2026-02-13 |
| Wedbush | Maintain | Neutral | 2026-02-06 |
| Citizens | Upgrade | Market Outperform | 2026-02-04 |
Royal Caribbean Cruises Ltd. Grades
The following are recent institutional grade actions concerning Royal Caribbean Cruises Ltd.:
| Grading Company | Action | New Grade | Date |
|---|---|---|---|
| Tigress Financial | Maintain | Buy | 2026-02-06 |
| Morgan Stanley | Maintain | Equal Weight | 2026-02-03 |
| Citigroup | Maintain | Buy | 2026-02-02 |
| Wells Fargo | Maintain | Overweight | 2026-02-02 |
| Goldman Sachs | Maintain | Buy | 2026-02-02 |
| JP Morgan | Maintain | Overweight | 2026-02-02 |
| Jefferies | Maintain | Hold | 2026-01-30 |
| Stifel | Maintain | Buy | 2026-01-30 |
| Barclays | Maintain | Overweight | 2026-01-30 |
| Goldman Sachs | Maintain | Buy | 2026-01-23 |
Which company has the best grades?
Airbnb, Inc. shows several upgrades to Outperform and Buy, indicating growing institutional confidence. Royal Caribbean Cruises Ltd. maintains strong Buy and Overweight ratings but no recent upgrades. Investors may view Airbnb’s rising grades as a signal of positive momentum.
Risks specific to each company
The following categories identify the critical pressure points and systemic threats facing both firms in the 2026 market environment:
1. Market & Competition
Airbnb, Inc.
- Faces intense competition from online travel agencies and alternative lodging platforms, requiring constant innovation.
Royal Caribbean Cruises Ltd.
- Operates in a highly competitive cruise industry with pressure from other leisure options and evolving customer preferences.
2. Capital Structure & Debt
Airbnb, Inc.
- Maintains a low debt-to-equity ratio (0.24), signaling conservative leverage and a strong balance sheet.
Royal Caribbean Cruises Ltd.
- Carries high leverage with a debt-to-equity ratio of 2.26, increasing financial risk amid volatile market conditions.
3. Stock Volatility
Airbnb, Inc.
- Exhibits moderate volatility with a beta of 1.15, reflecting sensitivity to market swings but relative stability.
Royal Caribbean Cruises Ltd.
- Shows high volatility with a beta of 1.87, exposing investors to larger price fluctuations and market risk.
4. Regulatory & Legal
Airbnb, Inc.
- Faces regulatory risks from local lodging laws, zoning restrictions, and evolving data privacy standards.
Royal Caribbean Cruises Ltd.
- Subject to maritime regulations, environmental laws, and potential litigation related to passenger safety and emissions.
5. Supply Chain & Operations
Airbnb, Inc.
- Operates a platform model with minimal fixed assets, reducing supply chain risks but reliant on host participation.
Royal Caribbean Cruises Ltd.
- Dependent on ship maintenance, fuel costs, and port access, making operations vulnerable to supply disruptions and cost inflation.
6. ESG & Climate Transition
Airbnb, Inc.
- Faces pressure to enhance sustainability practices and address community impact of short-term rentals.
Royal Caribbean Cruises Ltd.
- Under significant pressure to reduce carbon emissions and invest in greener technologies to meet climate goals.
7. Geopolitical Exposure
Airbnb, Inc.
- Exposed to varying geopolitical risks through global market presence but benefits from platform flexibility.
Royal Caribbean Cruises Ltd.
- Highly exposed to geopolitical tensions affecting cruise routes, travel restrictions, and fuel price volatility.
Which company shows a better risk-adjusted profile?
Airbnb’s strongest risk is regulatory uncertainty in diverse jurisdictions, while Royal Caribbean’s highest risk lies in heavy leverage and operational cost sensitivity. Airbnb’s low debt and moderate volatility form a superior risk-adjusted profile. Royal Caribbean’s high debt and stock volatility raise caution, despite solid profitability metrics. The 2025 capital structure data reveal Airbnb’s prudent balance sheet management versus Royal Caribbean’s burdened leverage, justifying my preference for Airbnb’s risk posture.
Final Verdict: Which stock to choose?
Airbnb’s superpower lies in its scalable platform model that drives strong returns on invested capital and robust profitability. However, its lofty valuation multiples warrant caution as a key point of vigilance. It fits best in an aggressive growth portfolio that tolerates premium pricing for innovation and market expansion.
Royal Caribbean boasts a strategic moat in its tangible asset base and operational scale, delivering solid earnings growth and a compelling income statement. Compared to Airbnb, it carries higher financial leverage and liquidity risks but offers better dividend potential. It suits a GARP (Growth at a Reasonable Price) portfolio seeking income with growth.
If you prioritize rapid innovation and market dominance, Airbnb is the compelling choice due to its superior ROIC and scalable business model. However, if you seek a blend of growth and income with more tangible asset backing, Royal Caribbean offers better stability despite leverage concerns. Both present distinct risk-reward profiles aligned with differing investor appetites.
Disclaimer: Investment carries a risk of loss of initial capital. The past performance is not a reliable indicator of future results. Be sure to understand risks before making an investment decision.
Go Further
I encourage you to read the complete analyses of Airbnb, Inc. and Royal Caribbean Cruises Ltd. to enhance your investment decisions: