In the dynamic travel services sector, Airbnb, Inc. and Norwegian Cruise Line Holdings Ltd. stand out as leading innovators reshaping how we explore the world. Airbnb revolutionizes lodging with its peer-to-peer marketplace, while Norwegian Cruise Line offers traditional yet evolving cruise experiences. Both companies compete for consumer attention in leisure travel, making their comparison crucial. In this article, I will help you determine which company presents the most compelling investment opportunity today.
Table of contents
Companies Overview
I will begin the comparison between Airbnb and Norwegian Cruise Line Holdings by providing an overview of these two companies and their main differences.
Airbnb Overview
Airbnb, Inc. operates a digital platform connecting hosts and guests for stays and experiences worldwide. Founded in 2007 and headquartered in San Francisco, it offers private rooms, primary homes, and vacation homes through a marketplace model. The company is positioned as a key player in travel services, leveraging technology to facilitate peer-to-peer lodging bookings across diverse markets.
Norwegian Cruise Line Holdings Overview
Norwegian Cruise Line Holdings Ltd. is a cruise operator founded in 1966 and based in Miami. It runs multiple brands including Norwegian Cruise Line and Regent Seven Seas Cruises, offering itineraries internationally across numerous destinations. The company focuses on passenger cruise travel with a fleet of 28 ships and distributes products via travel advisors, onboard sales, and charter channels, serving a broad global customer base.
Key similarities and differences
Both companies operate in the travel services sector and cater to customers seeking travel experiences. Airbnb relies on a digital marketplace model facilitating peer-to-peer lodging, while Norwegian Cruise Line operates physical cruise ships providing packaged voyages. Airbnb’s asset-light platform contrasts with Norwegian’s capital-intensive fleet operations. Their business models reflect different approaches to serving global travelers within the same industry.
Income Statement Comparison
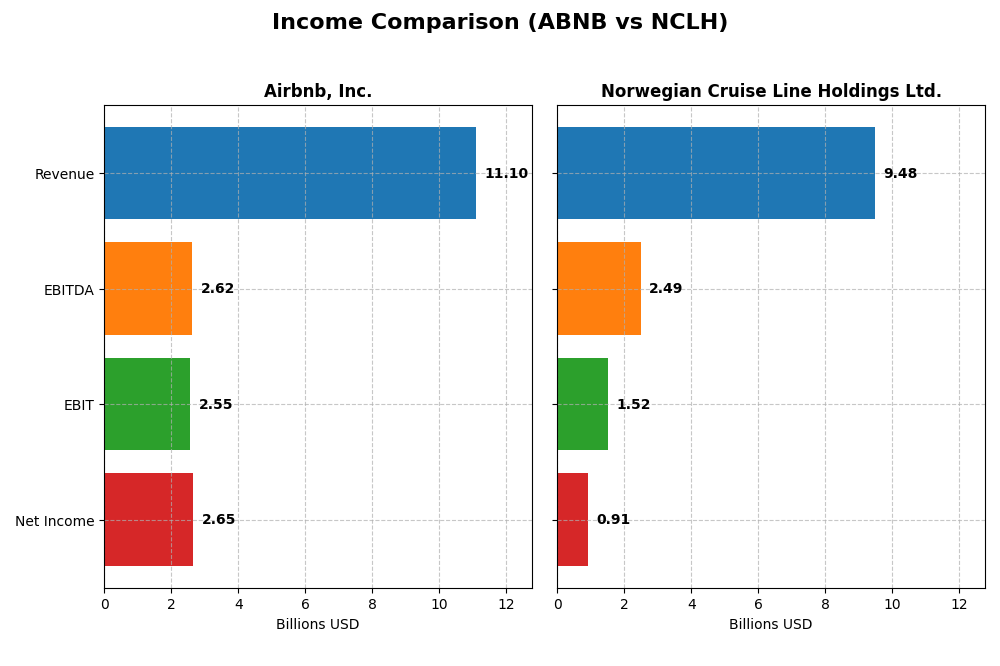
Below is a side-by-side comparison of key income statement metrics for Airbnb, Inc. and Norwegian Cruise Line Holdings Ltd. for the fiscal year 2024.
| Metric | Airbnb, Inc. (ABNB) | Norwegian Cruise Line Holdings Ltd. (NCLH) |
|---|---|---|
| Market Cap | 86.1B | 11.2B |
| Revenue | 11.1B | 9.5B |
| EBITDA | 2.62B | 2.49B |
| EBIT | 2.55B | 1.52B |
| Net Income | 2.65B | 910M |
| EPS | 4.19 | 2.09 |
| Fiscal Year | 2024 | 2024 |
Income Statement Interpretations
Airbnb, Inc.
Airbnb has shown strong revenue growth from $3.38B in 2020 to $11.1B in 2024, with net income turning positive and reaching $2.65B in the latest year. Margins have generally improved, with a gross margin of 83.08% and EBIT margin of 23.0% in 2024. However, net margin and EPS declined in 2024 despite revenue and EBIT growth, reflecting some pressure on profitability.
Norwegian Cruise Line Holdings Ltd.
Norwegian Cruise Line’s revenue surged from $1.28B in 2020 to $9.48B in 2024, with net income recovering from a loss of $4.01B to a profit of $910M. Margins improved significantly, with a gross margin near 40% and EBIT margin at 16.04% in 2024. The company’s net margin and EPS grew substantially in 2024, indicating a robust operational rebound and margin expansion.
Which one has the stronger fundamentals?
Both companies present favorable income statement trends, but Airbnb’s higher margins and consistent profitability stand out, despite recent net margin pressure. Norwegian Cruise Line shows impressive recovery and margin improvement but with lower overall margins and higher interest expense. Airbnb’s dominant margin profile contrasts with Norwegian’s stronger net margin growth momentum.
Financial Ratios Comparison
This table presents a side-by-side comparison of key financial ratios for Airbnb, Inc. and Norwegian Cruise Line Holdings Ltd. based on their latest full-year reports for 2024.
| Ratios | Airbnb, Inc. (ABNB) | Norwegian Cruise Line Holdings Ltd. (NCLH) |
|---|---|---|
| ROE | 31.5% | 63.9% |
| ROIC | 18.7% | 11.1% |
| P/E | 31.4 | 12.3 |
| P/B | 9.87 | 7.86 |
| Current Ratio | 1.69 | 0.17 |
| Quick Ratio | 1.69 | 0.15 |
| D/E (Debt-to-Equity) | 0.27 | 9.76 |
| Debt-to-Assets | 11.0% | 69.7% |
| Interest Coverage | 0 | 1.96 |
| Asset Turnover | 0.53 | 0.47 |
| Fixed Asset Turnover | 38.2 | 0.56 |
| Payout Ratio | 0 | 0 |
| Dividend Yield | 0 | 0 |
Interpretation of the Ratios
Airbnb, Inc.
Airbnb shows mostly strong financial ratios, including a favorable net margin of 23.85%, ROE at 31.48%, and ROIC of 18.69%, indicating efficient profitability and capital use. However, its high P/E of 31.36 and P/B of 9.87 are considered unfavorable, suggesting potential overvaluation. Current and quick ratios are solid at 1.69, reflecting good liquidity. Airbnb does not pay dividends, likely due to its growth and reinvestment strategy.
Norwegian Cruise Line Holdings Ltd.
Norwegian Cruise Line exhibits mixed to weak ratios. While ROE is favorable at 63.86% and P/E at 12.3 is attractive, most liquidity and leverage ratios are unfavorable: current ratio stands at 0.17 and debt to equity at 9.76, indicating high financial risk. The company also does not pay dividends, which may reflect ongoing debt management and reinvestment in operations or fleet expansion.
Which one has the best ratios?
Airbnb’s ratios are generally more favorable, with a strong profitability profile and sound liquidity, despite some valuation concerns. Norwegian Cruise Line faces significant challenges with liquidity, leverage, and asset turnover, resulting in an unfavorable overall ratio assessment. Thus, Airbnb presents a more balanced and financially stable ratio profile for 2024.
Strategic Positioning
This section compares the strategic positioning of Airbnb and Norwegian Cruise Line, focusing on market position, key segments, and exposure to technological disruption:
Airbnb, Inc.
- Leading global online travel services platform with moderate beta, facing competitive travel services market pressure.
- Focused on peer-to-peer accommodations and experiences, driving revenue through a digital marketplace model.
- Digital platform business model suggests moderate exposure to tech disruptions, leveraging mobile and online bookings.
Norwegian Cruise Line Holdings Ltd.
- Cruise operator with a significant fleet and high beta, competing in a niche, cyclical travel segment.
- Concentrated on cruise vacations with revenue split between passenger tickets and onboard services.
- Traditional cruise operations less exposed to digital disruption but dependent on physical assets and itineraries.
Airbnb vs Norwegian Cruise Line Positioning
Airbnb operates a diversified digital marketplace with global reach, while Norwegian Cruise Line focuses on a concentrated cruise segment with physical assets. Airbnb’s model offers scalability and innovation potential; Norwegian relies on established cruising demand and fleet management.
Which has the best competitive advantage?
Airbnb shows a very favorable moat with value creation and growing ROIC, indicating a durable competitive advantage. Norwegian Cruise Line has a slightly favorable moat with growing ROIC but currently sheds value, showing a weaker competitive advantage.
Stock Comparison
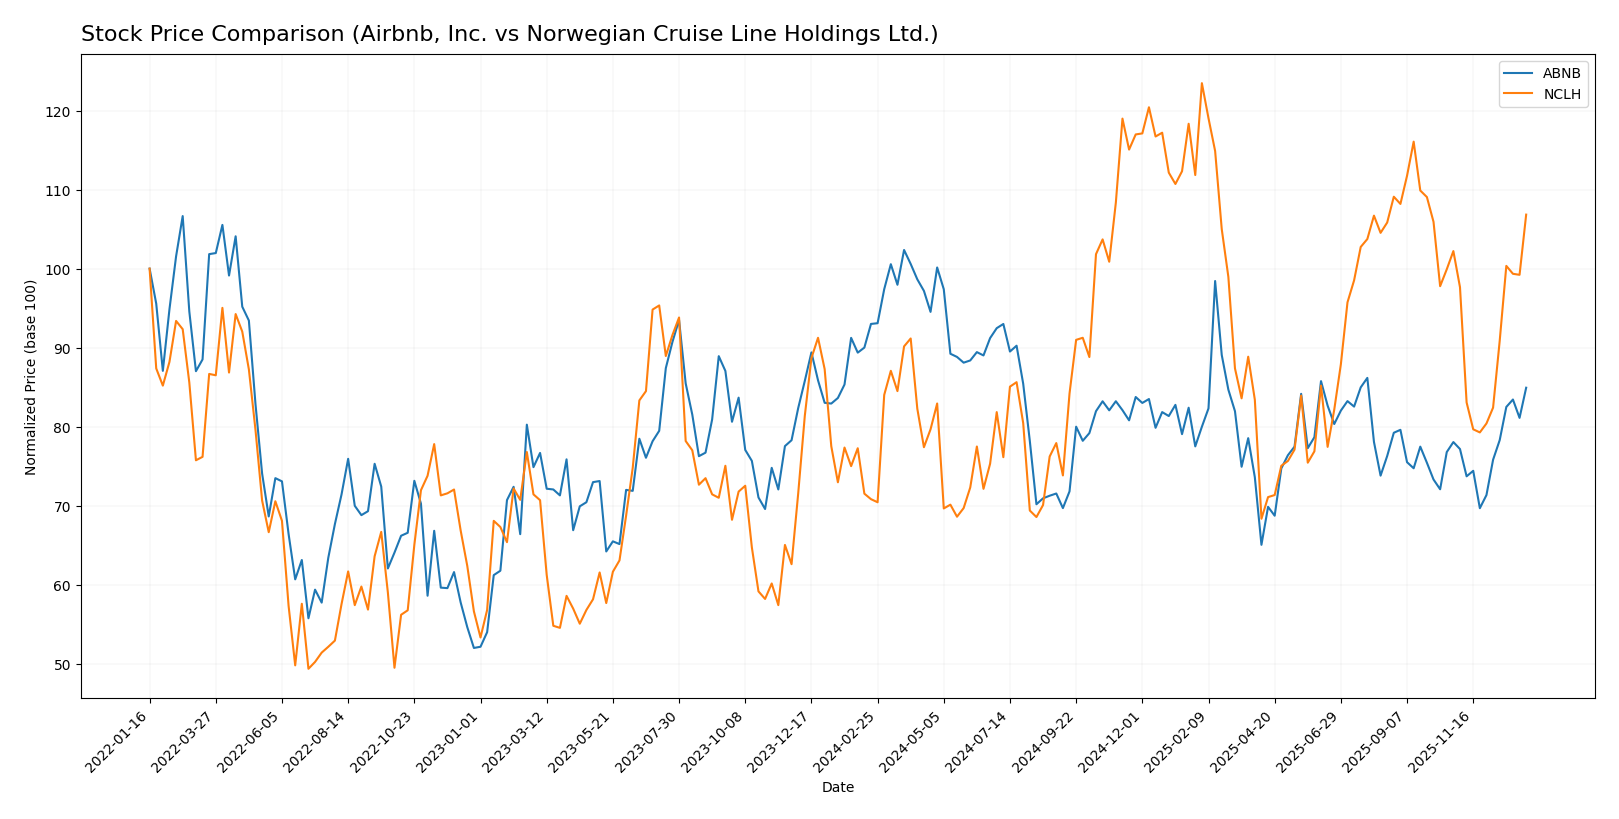
Key price movements over the past 12 months reveal a bearish trend for Airbnb, Inc. with accelerating decline, while Norwegian Cruise Line Holdings Ltd. shows a strong bullish momentum with significant gains and accelerating growth.
Trend Analysis
Airbnb, Inc. experienced an 8.68% price decline over the past year, indicating a bearish trend with accelerating downward momentum and significant volatility (std. deviation 13.6). The stock ranged between 106.66 and 167.86.
Norwegian Cruise Line Holdings Ltd. displayed a 50.86% price increase over the same period, reflecting a bullish trend with accelerating upward momentum and lower volatility (std. deviation 3.67). Prices fluctuated from 15.69 to 28.35.
Comparing both stocks, Norwegian Cruise Line Holdings Ltd. delivered the highest market performance with a strong bullish trend, outperforming Airbnb, Inc., which showed a bearish trend over the last 12 months.
Target Prices
The current analyst consensus provides a clear outlook for Airbnb, Inc. and Norwegian Cruise Line Holdings Ltd.
| Company | Target High | Target Low | Consensus |
|---|---|---|---|
| Airbnb, Inc. | 170 | 107 | 142.5 |
| Norwegian Cruise Line Holdings Ltd. | 38 | 20 | 26 |
Analysts expect Airbnb’s stock to hold moderate upside from the current price of 139.27 USD, with consensus target near 142.5 USD. Norwegian Cruise Line’s target consensus at 26 USD suggests a slight appreciation potential from its current price of 24.53 USD.
Analyst Opinions Comparison
This section compares analysts’ ratings and grades for Airbnb, Inc. and Norwegian Cruise Line Holdings Ltd.:
Rating Comparison
Airbnb, Inc. Rating
- Rating: A- with a Very Favorable status.
- Discounted Cash Flow Score: 5, Very Favorable.
- ROE Score: 5, Very Favorable.
- ROA Score: 5, Very Favorable.
- Debt To Equity Score: 3, Moderate.
- Overall Score: 4, Favorable.
Norwegian Cruise Line Holdings Ltd. Rating
- Rating: B with a Very Favorable status.
- Discounted Cash Flow Score: 3, Moderate.
- ROE Score: 5, Very Favorable.
- ROA Score: 3, Moderate.
- Debt To Equity Score: 1, Very Unfavorable.
- Overall Score: 3, Moderate.
Which one is the best rated?
Based strictly on the provided data, Airbnb holds higher overall and discounted cash flow scores, alongside better return on assets and debt to equity ratings. Norwegian Cruise Line matches Airbnb in ROE but scores lower in most other categories, making Airbnb the better rated company.
Scores Comparison
The following table compares the Altman Z-Score and Piotroski Score of Airbnb, Inc. and Norwegian Cruise Line Holdings Ltd.:
Airbnb Scores
- Altman Z-Score: 4.34, indicating a safe zone
- Piotroski Score: 7, classified as strong
Norwegian Cruise Line Scores
- Altman Z-Score: 0.32, indicating a distress zone
- Piotroski Score: 5, classified as average
Which company has the best scores?
Based strictly on the provided data, Airbnb has the higher Altman Z-Score and Piotroski Score, reflecting stronger financial stability and health compared to Norwegian Cruise Line.
Grades Comparison
Here is the detailed comparison of recent grades and ratings for Airbnb, Inc. and Norwegian Cruise Line Holdings Ltd.:
Airbnb, Inc. Grades
This table summarizes the recent stock grades and actions for Airbnb by major grading companies.
| Grading Company | Action | New Grade | Date |
|---|---|---|---|
| Barclays | upgrade | Equal Weight | 2026-01-09 |
| Wells Fargo | upgrade | Equal Weight | 2026-01-09 |
| Cantor Fitzgerald | upgrade | Neutral | 2026-01-08 |
| Bernstein | maintain | Outperform | 2026-01-06 |
| Wedbush | maintain | Neutral | 2025-12-19 |
| RBC Capital | upgrade | Outperform | 2025-12-17 |
| Jefferies | maintain | Buy | 2025-12-05 |
| DA Davidson | maintain | Buy | 2025-12-05 |
| Truist Securities | maintain | Sell | 2025-12-04 |
| Wells Fargo | maintain | Underweight | 2025-12-01 |
Airbnb’s grades show a mix of upgrades from underweight to neutral or equal weight, alongside maintain ratings at buy and outperform levels, indicating a cautiously improving outlook.
Norwegian Cruise Line Holdings Ltd. Grades
This table presents recent grades and rating changes for Norwegian Cruise Line by recognized grading firms.
| Grading Company | Action | New Grade | Date |
|---|---|---|---|
| Barclays | maintain | Overweight | 2025-12-17 |
| Jefferies | downgrade | Hold | 2025-12-15 |
| Mizuho | maintain | Outperform | 2025-12-12 |
| Goldman Sachs | downgrade | Neutral | 2025-12-09 |
| Truist Securities | maintain | Buy | 2025-12-02 |
| Wells Fargo | maintain | Overweight | 2025-12-01 |
| Susquehanna | maintain | Neutral | 2025-11-12 |
| Goldman Sachs | maintain | Buy | 2025-11-11 |
| Morgan Stanley | maintain | Equal Weight | 2025-11-10 |
| JP Morgan | maintain | Overweight | 2025-11-05 |
Norwegian Cruise Line’s ratings largely remain stable at overweight or buy, though some downgrades to hold and neutral suggest some caution among analysts.
Which company has the best grades?
Norwegian Cruise Line generally holds stronger grades with multiple overweight and buy ratings, while Airbnb’s upgrades move it mostly to neutral or equal weight. Investors may interpret Norwegian’s better grades as a more favorable analyst sentiment, potentially influencing portfolio decisions accordingly.
Strengths and Weaknesses
Below is a comparative overview of the strengths and weaknesses of Airbnb, Inc. (ABNB) and Norwegian Cruise Line Holdings Ltd. (NCLH) based on their latest financial and operational data.
| Criterion | Airbnb, Inc. (ABNB) | Norwegian Cruise Line Holdings Ltd. (NCLH) |
|---|---|---|
| Diversification | Highly diversified in short-term lodging with global listings | Primarily focused on cruise vacations, less diversified |
| Profitability | Strong profitability with 23.85% net margin and 31.48% ROE | Moderate profitability; 9.6% net margin but very high ROE at 63.86% |
| Innovation | Leading platform innovation and user experience | Moderate innovation, focusing on cruise amenities and routes |
| Global presence | Extensive global presence with billions in revenue worldwide | Global operations but more concentrated in cruise markets |
| Market Share | Large and growing market share in home-sharing | Significant player but in a niche market with strong competition |
Key takeaways: Airbnb demonstrates strong profitability, innovation, and a durable competitive advantage, making it a favorable investment despite some valuation concerns. Norwegian Cruise Line shows improving profitability but faces challenges in diversification and financial stability, warranting caution.
Risk Analysis
Below is a risk comparison table for Airbnb, Inc. (ABNB) and Norwegian Cruise Line Holdings Ltd. (NCLH) based on the most recent 2024 data:
| Metric | Airbnb, Inc. (ABNB) | Norwegian Cruise Line Holdings Ltd. (NCLH) |
|---|---|---|
| Market Risk | Moderate beta (1.1), stable price range (99.88-163.93) | High beta (2.08), more volatile price range (14.21-29.29) |
| Debt level | Low debt-to-equity (0.27), favorable debt ratios | Very high debt-to-equity (9.76), unfavorable leverage |
| Regulatory Risk | Moderate, operating global platform with data privacy concerns | High, exposure to maritime, health, and international regulations |
| Operational Risk | Platform reliance, but diversified services | High due to fleet maintenance, fuel costs, and seasonal demand |
| Environmental Risk | Moderate, pressure on sustainable tourism practices | High, cruise industry faces scrutiny over emissions and waste |
| Geopolitical Risk | Moderate, exposure to travel restrictions and geopolitical tensions | High, itineraries affected by geopolitical instability and travel bans |
Synthesis: NCLH presents the highest risks due to its heavy debt load, operational complexity, and significant environmental and geopolitical exposure. ABNB shows a more balanced risk profile with manageable debt and operational risks, but market sensitivity and regulatory scrutiny remain relevant. Investors should weigh NCLH’s financial distress signals against ABNB’s stronger financial stability.
Which Stock to Choose?
Airbnb, Inc. (ABNB) shows consistent income growth with a favorable global income statement evaluation and strong profitability metrics, including a 31.5% ROE and low debt levels. Its financial ratios are predominantly favorable, supported by a very favorable rating and a robust economic moat indicating durable competitive advantage.
Norwegian Cruise Line Holdings Ltd. (NCLH) exhibits positive revenue and net margin growth, with a high ROE of 63.9%, but carries significant debt and weaker liquidity ratios. Its financial ratios are largely unfavorable, though the income statement and rating remain very favorable. The company’s economic moat is slightly favorable, reflecting improving but still challenged profitability.
For risk-tolerant investors seeking growth, ABNB’s strong profitability, low leverage, and durable competitive moat might appear more attractive, while those willing to accept higher financial risk for potential value may find NCLH’s improving income metrics and market momentum noteworthy.
Disclaimer: Investment carries a risk of loss of initial capital. The past performance is not a reliable indicator of future results. Be sure to understand risks before making an investment decision.
Go Further
I encourage you to read the complete analyses of Airbnb, Inc. and Norwegian Cruise Line Holdings Ltd. to enhance your investment decisions: