Home > Comparison > Consumer Cyclical > ABNB vs MAR
The strategic rivalry between Airbnb, Inc. and Marriott International, Inc. shapes the future of the global hospitality sector. Airbnb operates a tech-driven, asset-light marketplace in travel services, while Marriott commands a capital-intensive global lodging empire. This analysis pits disruptive innovation against established scale, evaluating which model delivers superior risk-adjusted returns. I will determine which trajectory best suits a diversified portfolio seeking growth and resilience in consumer cyclical markets.

Table of contents
Companies Overview
Airbnb and Marriott shape the evolving landscape of global travel and lodging industries.
Airbnb, Inc.: The Digital Marketplace Pioneer
Airbnb dominates as a platform-based travel services provider connecting hosts and guests worldwide. Its core revenue stems from booking fees on private and vacation home stays. In 2026, Airbnb emphasizes expanding its marketplace model and enhancing user experiences through technology-driven innovation.
Marriott International, Inc.: The Traditional Hospitality Giant
Marriott leads as a global hotel and lodging operator and franchisor with nearly 8,000 properties across 139 countries. It generates revenue from hotel operations, franchising, and licensing fees. Marriott’s 2026 strategy centers on broadening its luxury portfolio and leveraging brand diversity to capture diverse traveler segments.
Strategic Collision: Similarities & Divergences
Airbnb and Marriott both serve the travel market but differ fundamentally: Airbnb pursues an open digital marketplace, while Marriott operates a controlled, branded hotel ecosystem. Their competition intensifies in attracting global travelers seeking accommodation flexibility versus consistent service quality. Investors face contrasting profiles: Airbnb offers growth through tech disruption; Marriott provides stability with a vast physical footprint.
Income Statement Comparison
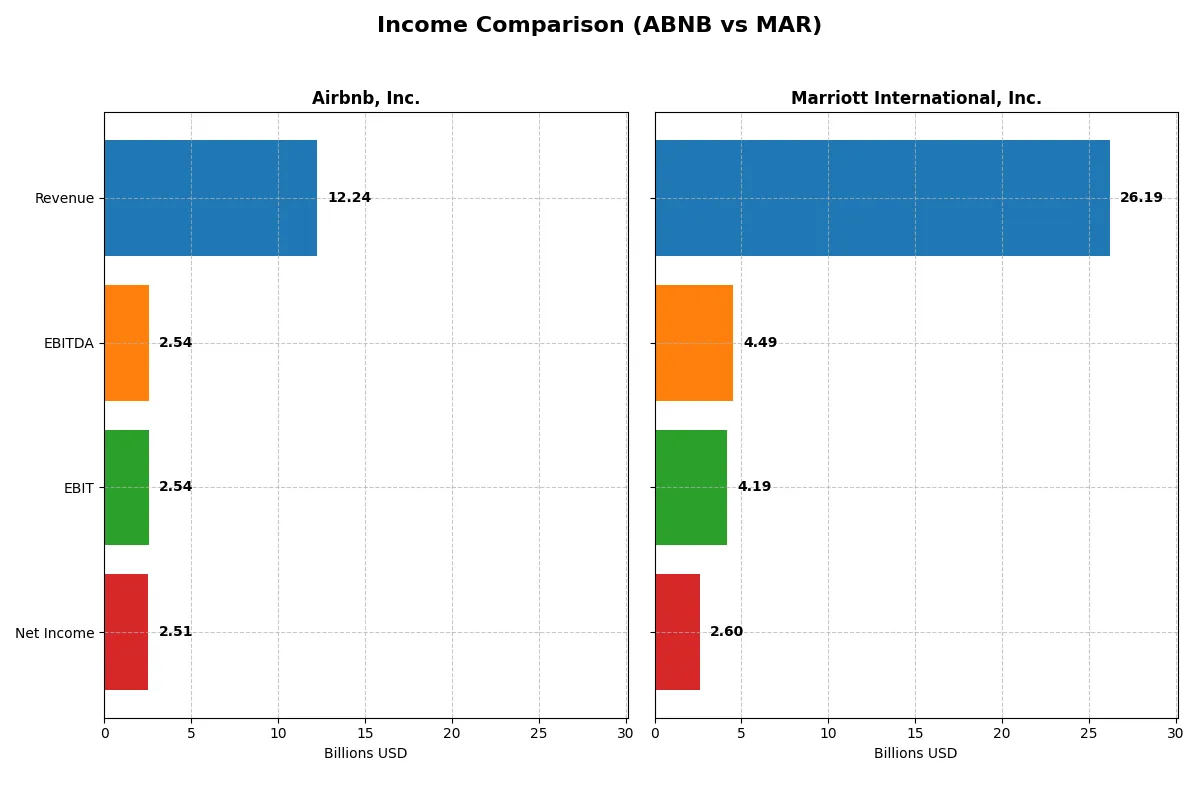
This data dissects the core profitability and scalability of both corporate engines to reveal who dominates the bottom line:
| Metric | Airbnb, Inc. (ABNB) | Marriott International, Inc. (MAR) |
|---|---|---|
| Revenue | 12.2B | 26.2B |
| Cost of Revenue | 2.1B | 20.6B |
| Operating Expenses | 7.6B | 1.5B |
| Gross Profit | 10.2B | 5.6B |
| EBITDA | 2.5B | 4.5B |
| EBIT | 2.5B | 4.2B |
| Interest Expense | 0 | 0.8B |
| Net Income | 2.5B | 2.6B |
| EPS | 4.1 | 9.5 |
| Fiscal Year | 2025 | 2025 |
Income Statement Analysis: The Bottom-Line Duel
This income statement comparison will uncover which company optimizes revenue into profit with greater efficiency and sustainable momentum.
Airbnb, Inc. Analysis
Airbnb’s revenue surged from 6B in 2021 to 12.2B in 2025, more than doubling over five years. Net income climbed sharply, reflecting strong margin expansion with a robust 83% gross margin and a 20.5% net margin in 2025. Despite a slight dip in EBIT and net margin growth last year, Airbnb maintains impressive profitability and scale.
Marriott International, Inc. Analysis
Marriott’s revenue grew steadily from 13.9B in 2021 to 26.2B in 2025, showing solid expansion at a slower pace. Its 2025 gross margin stands at 21.3%, with a 9.9% net margin, both healthy but far thinner than Airbnb’s. Marriott’s recent EBIT and EPS growth signal improving operational efficiency and consistent profit gains.
Margin Supremacy vs. Scale and Stability
Airbnb commands superior margins, converting over 20% of revenue into net profit, compared to Marriott’s sub-10% net margin. Airbnb also boasts faster top-line and bottom-line growth over the long term. Marriott counters with more stable, moderate growth and a solid margin base typical for its capital-intensive sector. Investors seeking high margin and rapid expansion may favor Airbnb’s profile, while Marriott offers steadier profit progression.
Financial Ratios Comparison
These vital ratios act as a diagnostic tool to expose the underlying fiscal health, valuation premiums, and capital efficiency of the companies compared below:
| Ratios | Airbnb, Inc. (ABNB) | Marriott International, Inc. (MAR) |
|---|---|---|
| ROE | 30.6% | -68.97% |
| ROIC | 19.3% | 15.2% |
| P/E | 33.1 | 32.0 |
| P/B | 10.1 | -22.1 |
| Current Ratio | 1.38 | 0.38 |
| Quick Ratio | 1.38 | 0.38 |
| D/E (Debt-to-Equity) | 0.24 | -4.53 |
| Debt-to-Assets | 9.0% | 62.0% |
| Interest Coverage | 0 (not meaningful) | 5.12 |
| Asset Turnover | 0.55 | 0.95 |
| Fixed Asset Turnover | 0 | 9.05 |
| Payout Ratio | 0 | 27.6% |
| Dividend Yield | 0 | 0.86% |
| Fiscal Year | 2025 | 2025 |
Efficiency & Valuation Duel: The Vital Signs
Financial ratios serve as a company’s DNA, unveiling hidden risks and operational strengths critical for investment decisions.
Airbnb, Inc.
Airbnb delivers strong profitability with a 30.63% ROE and robust 20.51% net margin, signaling operational excellence. Its valuation appears stretched, trading at a high P/E of 33.13 and P/B of 10.15, reflecting market optimism. The company reinvests heavily in R&D (19.23% of revenue) instead of paying dividends, prioritizing growth over immediate shareholder returns.
Marriott International, Inc.
Marriott shows moderate profitability with a weak -68.97% ROE and a net margin near 10%, indicating operational challenges. Its valuation is similarly elevated with a 32.03 P/E but a favorable negative P/B, suggesting asset write-downs. Dividend yield is minimal at 0.86%, while lower current and quick ratios signal liquidity concerns, despite solid asset turnover and interest coverage.
Premium Valuation vs. Operational Safety
Airbnb offers superior profitability and reinvestment strategies but carries stretched valuation risks. Marriott’s weaker returns and liquidity issues weigh heavily despite some asset efficiency. Investors seeking growth may lean Airbnb, while those prioritizing asset base might consider Marriott’s profile despite its risks.
Which one offers the Superior Shareholder Reward?
I see Airbnb (ABNB) pays no dividends but reinvests heavily in growth, supported by robust free cash flow of $7.6/share and zero dividend payout. Marriott (MAR) offers a modest 0.86% dividend yield with a 27.6% payout ratio, signaling steady income but limited reinvestment. Marriott’s buybacks appear less aggressive, while Airbnb’s reinvestment strategy fuels higher operating margins (20.8% vs. 16.0%) and superior free cash flow conversion. Despite Marriott’s income appeal, Airbnb’s sustainable growth and capital allocation promise a stronger total return in 2026. I favor Airbnb for superior shareholder reward.
Comparative Score Analysis: The Strategic Profile
The radar chart reveals the fundamental DNA and trade-offs of Airbnb, Inc. and Marriott International, Inc., highlighting their core financial strengths and weaknesses:
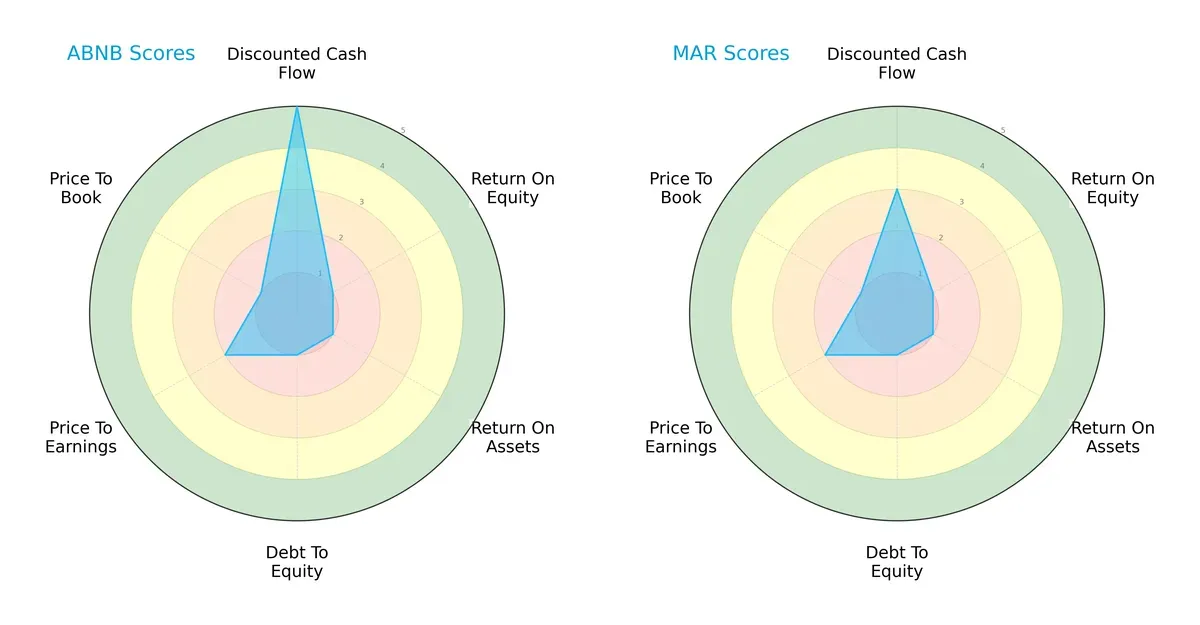
Airbnb exhibits a strong discounted cash flow (DCF) score of 5, signaling optimistic future cash flows, while Marriott’s DCF score is moderate at 3. Both firms share weak profitability scores, with ROE and ROA at 1, indicating challenges in generating returns. Their debt-to-equity and price-to-book scores are equally low, signaling financial risk and potential overvaluation. Airbnb’s profile is more balanced on valuation metrics, but Marriott lacks a distinct edge, relying on an overall weaker score.
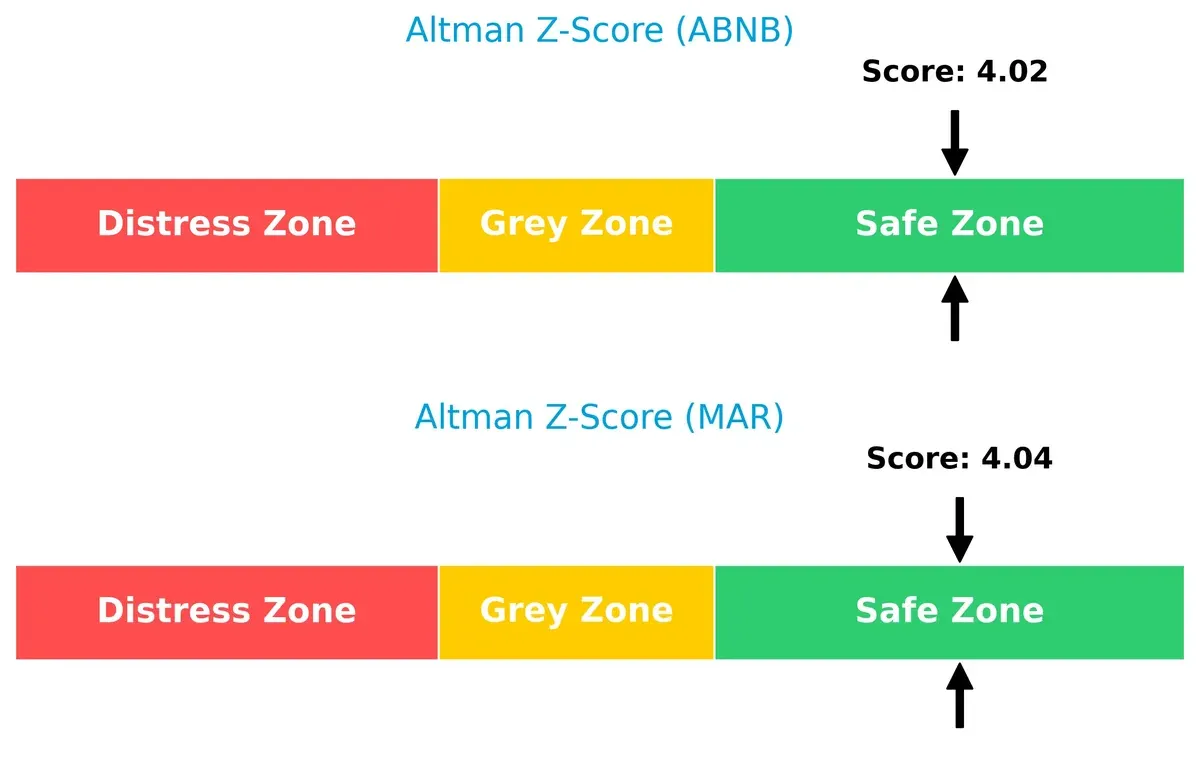
Bankruptcy Risk: Solvency Showdown
The Altman Z-Scores for Airbnb (4.02) and Marriott (4.04) place both firmly in the safe zone, indicating strong long-term solvency and low bankruptcy risk in the current economic cycle:
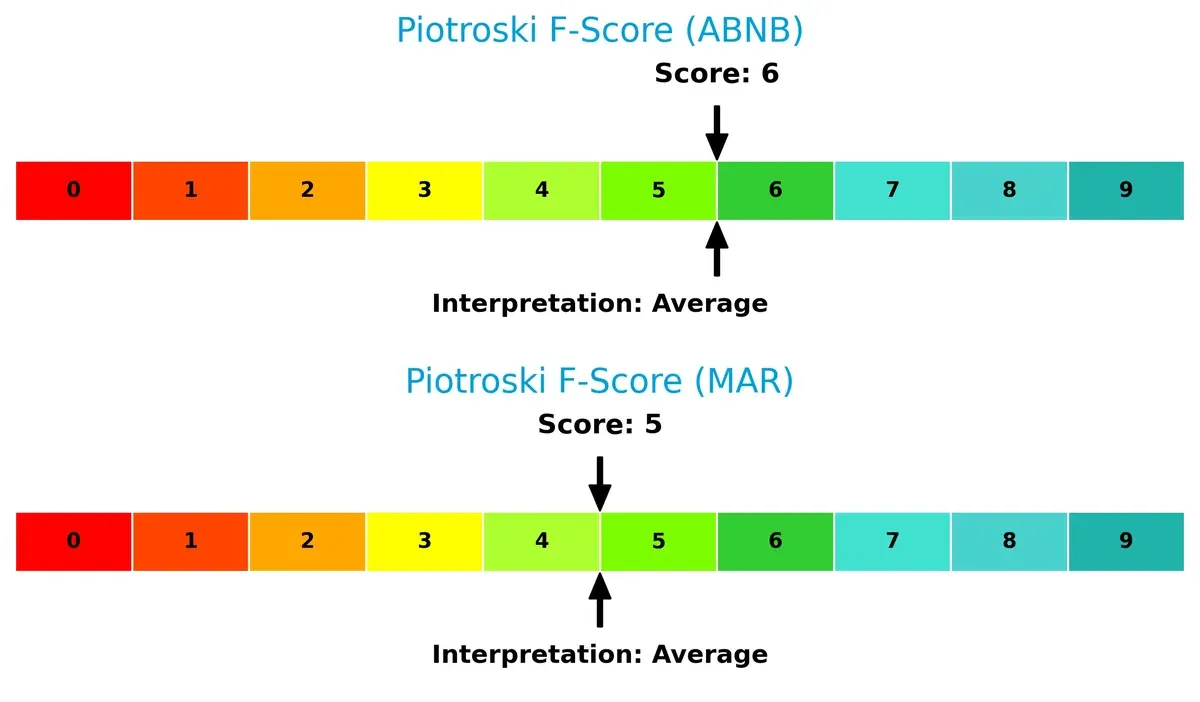
Financial Health: Quality of Operations
Airbnb’s Piotroski F-Score of 6 slightly outperforms Marriott’s 5, suggesting marginally better operational quality and financial health. Neither company shows red flags, but both sit at an average level, warranting cautious optimism:
How are the two companies positioned?
This section dissects Airbnb and Marriott’s operational DNA by comparing their revenue distribution and internal dynamics. The goal is to confront their economic moats to identify which model offers the most resilient, sustainable advantage today.
Revenue Segmentation: The Strategic Mix
This visual comparison dissects how Airbnb and Marriott diversify their income streams and where their primary sector bets lie:
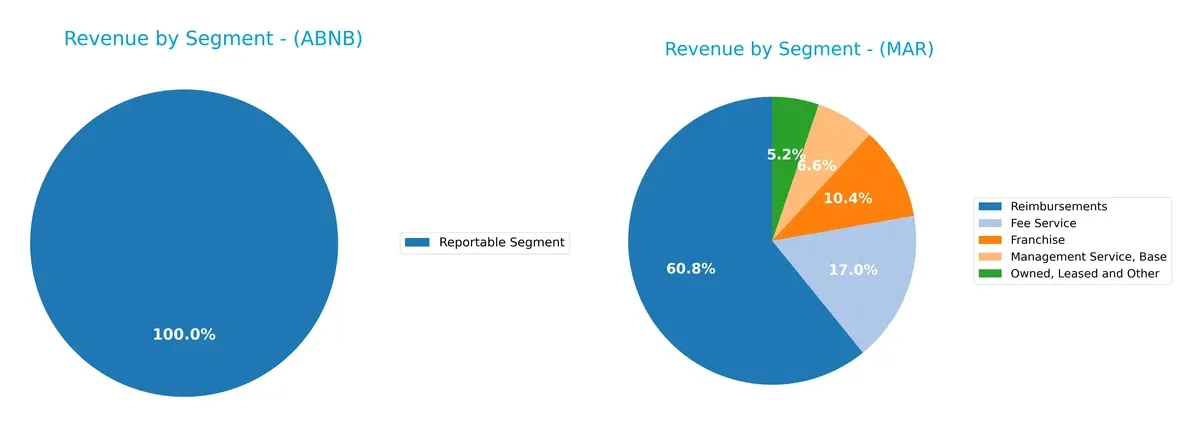
Airbnb anchors its revenue in one dominant “Reportable Segment” at $12.2B in 2025, showing concentrated reliance on its core business. Marriott, by contrast, exhibits a diversified mix with $19.5B from Reimbursements, $5.4B Fee Service, $3.3B Franchise, plus other segments totaling over $24B. Marriott’s spread reduces concentration risk and reflects a robust ecosystem with multiple income pillars, while Airbnb’s focus suggests vulnerability but also sharp specialization.
Strengths and Weaknesses Comparison
This table compares the Strengths and Weaknesses of Airbnb and Marriott based on diversification, profitability, financials, innovation, global presence, and market share:
Airbnb Strengths
- High net margin (20.51%) and ROE (30.63%) indicate strong profitability
- Favorable ROIC (19.29%) vs WACC (8.91%) shows efficient capital use
- Low debt-to-assets (9%) and strong interest coverage support financial stability
- Significant global revenue distribution across North America, EMEA, Asia Pacific, and Latin America
Marriott Strengths
- Diverse revenue streams including owned, fee, franchise, and management services support business resilience
- Favorable ROIC (15.16%) and interest coverage (5.18) despite leverage
- Strong fixed asset turnover (9.05) evidences efficient asset utilization
- Large US and international presence with multi-billion revenues in multiple regions
Airbnb Weaknesses
- Unfavorable PE (33.13) and PB (10.15) ratios may indicate overvaluation risk
- Zero dividend yield limits income appeal
- Fixed asset turnover is zero due to asset-light model, limiting tangible asset leverage
- Moderate current ratio (1.38) suggests liquidity is adequate but not robust
Marriott Weaknesses
- Negative ROE (-68.97%) signals poor profitability and potential losses
- Low current (0.38) and quick ratios (0.38) reveal liquidity concerns
- High debt-to-assets (62%) increases financial risk
- Unfavorable PE (32.03) and dividend yield (0.86%) reduce valuation appeal
Overall, Airbnb shows stronger profitability and financial health with a lean asset-light model and global reach. Marriott exhibits revenue diversification and asset efficiency but faces profitability and liquidity challenges. These contrasting profiles highlight differing strategic focuses and risk exposures.
The Moat Duel: Analyzing Competitive Defensibility
A structural moat shields long-term profits from relentless competitive pressures. Only a durable advantage secures lasting market dominance:
Airbnb, Inc.: Network Effects and Asset-Light Model
Airbnb’s core moat stems from powerful network effects and a cost-efficient platform model. It posts an impressive 20.5% net margin and expanding ROIC, signaling scalable profitability. In 2026, new market expansions and experiences could deepen this moat but rising competition poses a threat.
Marriott International, Inc.: Brand Power and Global Footprint
Marriott’s moat arises from its iconic brands and extensive global footprint. It sustains steady margins around 10% with growing ROIC, showing efficient capital use despite a capital-heavy asset base. The company’s expansion into luxury segments and loyalty programs could further fortify its advantage.
Digital Platform Versus Legacy Brand Moats
Airbnb’s network-driven, asset-light moat is wider and scales faster than Marriott’s traditional brand and property moat. I see Airbnb better positioned to defend and grow market share amid evolving travel trends. Marriott’s moat remains durable but faces higher fixed costs and slower innovation pace.
Which stock offers better returns?
The past year shows stark divergence in price trends between Airbnb and Marriott, with Marriott gaining momentum and Airbnb underperforming despite recent stabilization.
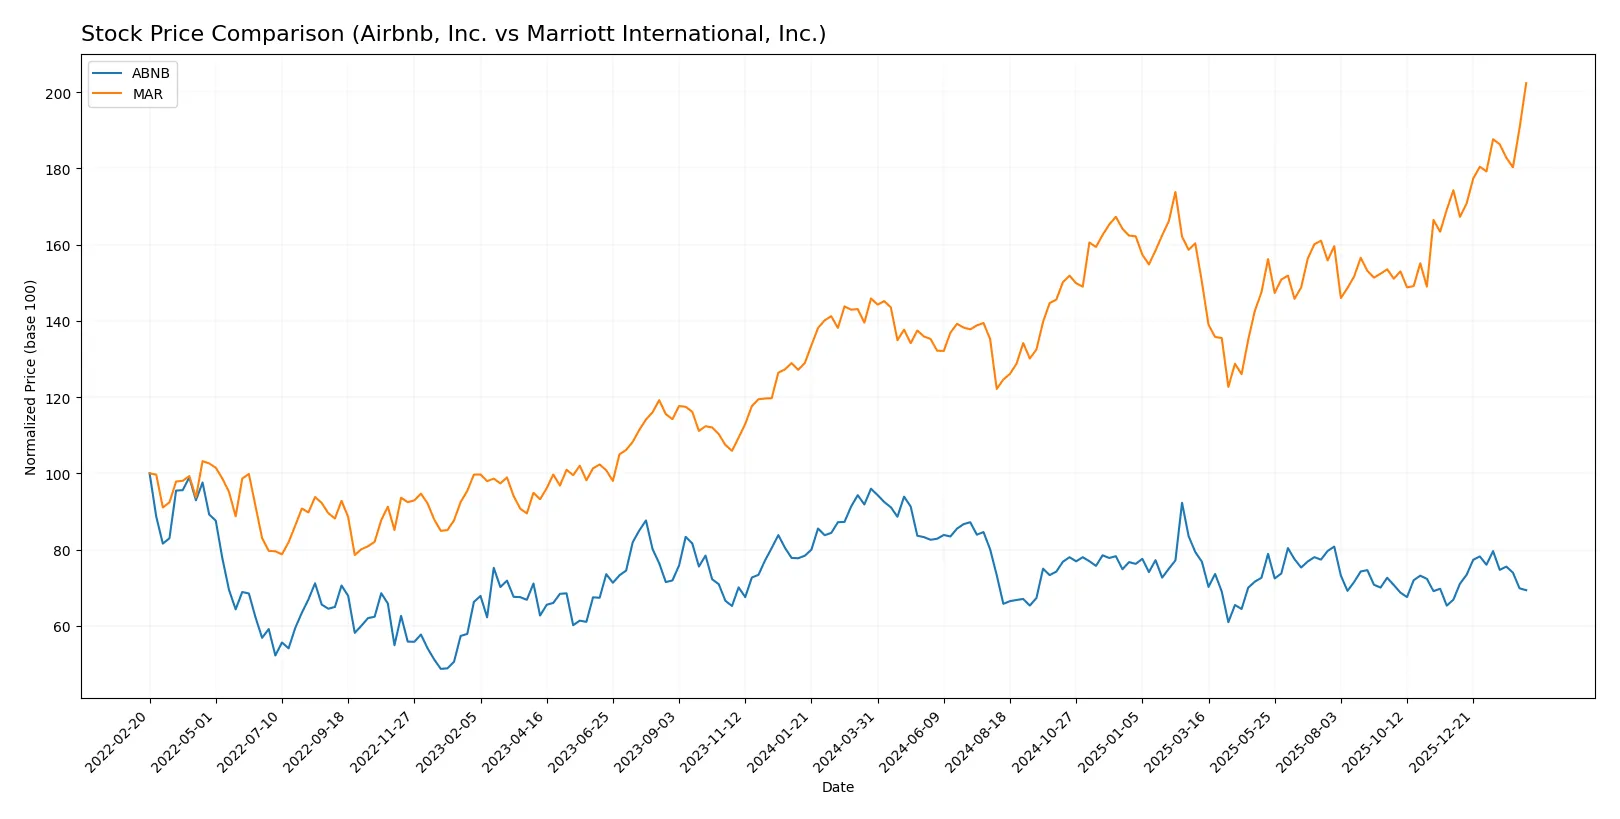
Trend Comparison
Airbnb, Inc. experienced a bearish trend over the past 12 months, with a price decline of 27.71%. The trend accelerated downward, hitting a high of 167.86 and a low of 106.66, showing significant volatility.
Marriott International, Inc. exhibited a bullish trend with a 38.69% price increase over the same period. The stock trend accelerated upward, reaching a high of 353.89 and a low of 213.67, but with higher volatility than Airbnb.
Comparing both, Marriott clearly delivered the highest market performance, outperforming Airbnb by a wide margin in price appreciation and trend strength.
Target Prices
Analysts project solid upside potential for Airbnb and Marriott based on current consensus targets.
| Company | Target Low | Target High | Consensus |
|---|---|---|---|
| Airbnb, Inc. | 107 | 170 | 141.93 |
| Marriott International, Inc. | 310 | 400 | 356.1 |
Airbnb’s consensus target of $141.93 suggests a 17% gain from today’s $121.35 price. Marriott’s $356.10 target is nearly flat versus the current $353.89, signaling limited near-term upside.

Don’t Let Luck Decide Your Entry Point
Optimize your entry points with our advanced ProRealTime indicators. You’ll get efficient buy signals with precise price targets for maximum performance. Start outperforming now!
How do institutions grade them?
Airbnb, Inc. Grades
The table below summarizes recent institutional grades for Airbnb, Inc.:
| Grading Company | Action | New Grade | Date |
|---|---|---|---|
| Wedbush | Maintain | Neutral | 2026-02-13 |
| Evercore ISI Group | Upgrade | Outperform | 2026-02-13 |
| Barclays | Maintain | Equal Weight | 2026-02-13 |
| Deutsche Bank | Upgrade | Buy | 2026-02-13 |
| TD Cowen | Maintain | Buy | 2026-02-13 |
| Wells Fargo | Maintain | Equal Weight | 2026-02-13 |
| BMO Capital | Maintain | Market Perform | 2026-02-13 |
| Benchmark | Maintain | Buy | 2026-02-13 |
| Wedbush | Maintain | Neutral | 2026-02-06 |
| Citizens | Upgrade | Market Outperform | 2026-02-04 |
Marriott International, Inc. Grades
The table below summarizes recent institutional grades for Marriott International, Inc.:
| Grading Company | Action | New Grade | Date |
|---|---|---|---|
| Goldman Sachs | Maintain | Buy | 2026-02-11 |
| JP Morgan | Maintain | Neutral | 2026-02-11 |
| Jefferies | Maintain | Buy | 2026-02-11 |
| Macquarie | Maintain | Neutral | 2026-02-11 |
| Barclays | Maintain | Equal Weight | 2026-02-11 |
| Wells Fargo | Maintain | Overweight | 2026-02-11 |
| Evercore ISI Group | Maintain | Outperform | 2026-02-11 |
| Truist Securities | Maintain | Hold | 2026-02-11 |
| JP Morgan | Maintain | Neutral | 2026-02-03 |
| Evercore ISI Group | Maintain | Outperform | 2026-01-22 |
Which company has the best grades?
Both companies receive a mix of buy, hold, and neutral ratings from reputable firms. Airbnb shows more recent upgrades, including multiple buy and outperform actions. Marriott holds steady with consistent buy and outperform grades but fewer upgrades. These differences may influence investor confidence differently.
Risks specific to each company
The following categories identify the critical pressure points and systemic threats facing Airbnb, Inc. and Marriott International, Inc. in the 2026 market environment:
1. Market & Competition
Airbnb, Inc.
- Faces aggressive competition from traditional hotels and emerging platforms in travel services.
Marriott International, Inc.
- Competes with global hotel chains and alternative lodging, challenged by evolving customer preferences.
2. Capital Structure & Debt
Airbnb, Inc.
- Maintains a conservative debt profile with low debt-to-assets at 9%, signaling financial flexibility.
Marriott International, Inc.
- Carries high leverage with 62% debt-to-assets, increasing financial risk amid market volatility.
3. Stock Volatility
Airbnb, Inc.
- Exhibits moderate beta at 1.15, reflecting sensitivity to market swings but balanced growth potential.
Marriott International, Inc.
- Slightly less volatile with beta at 1.10, yet market fluctuations still impact its lodging-focused business.
4. Regulatory & Legal
Airbnb, Inc.
- Faces regulatory scrutiny over short-term rental laws in multiple jurisdictions worldwide.
Marriott International, Inc.
- Subject to hospitality regulations and potential legal challenges in diverse international markets.
5. Supply Chain & Operations
Airbnb, Inc.
- Relies on host participation and platform stability; operational risks tied to technology and user trust.
Marriott International, Inc.
- Operates extensive physical assets and franchises, vulnerable to operational disruptions and capital intensity.
6. ESG & Climate Transition
Airbnb, Inc.
- Pressured to enhance sustainability metrics and responsible tourism practices amid rising ESG demands.
Marriott International, Inc.
- Faces challenges integrating ESG across vast property portfolio, with increasing focus on carbon footprint reduction.
7. Geopolitical Exposure
Airbnb, Inc.
- Exposure to geopolitical risks through global host network and travel restrictions.
Marriott International, Inc.
- Broad international footprint subjects it to currency, political instability, and travel policy risks.
Which company shows a better risk-adjusted profile?
Airbnb’s most impactful risk is regulatory and legal uncertainty in key markets, threatening its scalable marketplace model. Marriott’s capital structure is the largest risk, with heavy debt weighing on financial flexibility. Airbnb’s lower leverage and higher Altman Z-score demonstrate a more resilient financial footing. Despite Airbnb’s valuation risks, its risk-adjusted profile is superior given its safer balance sheet and moderate volatility. Marriott’s substantial debt and operational complexity make it more vulnerable to macroeconomic shocks.
Final Verdict: Which stock to choose?
Airbnb’s superpower lies in its ability to create value through a rapidly growing and scalable platform. Its expanding ROIC well above WACC signals a durable competitive edge. A point of vigilance remains its relatively high valuation multiples, which could pressure returns. It fits well in aggressive growth portfolios seeking innovation-driven upside.
Marriott’s strategic moat is its deep industry legacy and asset-light franchise model, providing steady cash flow and resilience. Compared to Airbnb, it offers better stability but faces challenges from leverage and margin pressure. Marriott suits GARP investors who prefer steady growth with a layer of income reliability.
If you prioritize dynamic growth and market disruption, Airbnb outshines Marriott due to its robust capital efficiency and innovation momentum. However, if you seek better stability and incremental income in a familiar sector, Marriott offers a safer profile despite its operational leverage. Each stock fits distinct investor archetypes, warranting careful alignment with risk tolerance.
Disclaimer: Investment carries a risk of loss of initial capital. The past performance is not a reliable indicator of future results. Be sure to understand risks before making an investment decision.
Go Further
I encourage you to read the complete analyses of Airbnb, Inc. and Marriott International, Inc. to enhance your investment decisions: