Home > Comparison > Consumer Cyclical > ABNB vs EXPE
The strategic rivalry between Airbnb, Inc. and Expedia Group, Inc. shapes the future of the travel services sector. Airbnb operates a dynamic peer-to-peer marketplace focused on unique stays, while Expedia leads as a comprehensive online travel service provider with a broad brand portfolio. This head-to-head contrasts platform innovation against diversified service offering. This analysis aims to identify which business model presents superior risk-adjusted returns for a balanced and diversified portfolio.

Table of contents
Companies Overview
Airbnb and Expedia command significant influence in the global travel services industry.
Airbnb, Inc.: Platform Pioneer in Alternative Stays
Airbnb dominates as a marketplace platform enabling hosts to rent private rooms, primary homes, or vacation homes. Its core revenue stems from connecting hosts and guests worldwide via an online and mobile interface. In 2026, Airbnb’s strategic focus sharpens on expanding unique experiences and scaling its community-driven lodging model.
Expedia Group, Inc.: Comprehensive Online Travel Powerhouse
Expedia stands as a diversified online travel company offering lodging, flights, car rentals, and cruises through multiple brands. It generates revenue from retail, B2B, and metasearch segments across a broad portfolio including Hotels.com and Vrbo. Its 2026 strategy prioritizes integrating services and enhancing corporate travel solutions to capture both leisure and business markets.
Strategic Collision: Similarities & Divergences
Both companies leverage digital platforms but diverge in philosophy: Airbnb emphasizes a peer-to-peer ecosystem, while Expedia relies on a broad, multi-brand infrastructure. Their key battleground is the alternative accommodations market, where Airbnb leads but Expedia’s Vrbo challenges fiercely. Investors face distinct profiles—Airbnb’s growth-centric model contrasts with Expedia’s diversified, cash-generative portfolio.
Income Statement Comparison
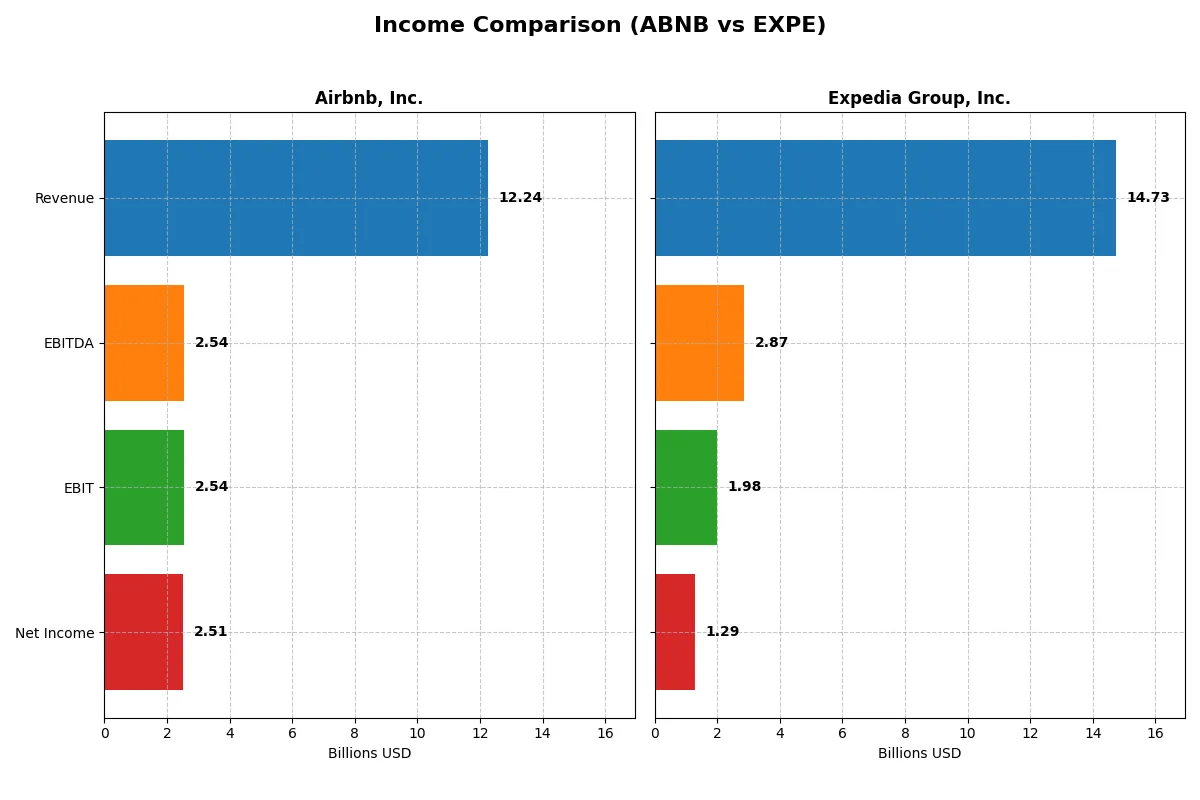
This data dissects the core profitability and scalability of both corporate engines to reveal who dominates the bottom line:
| Metric | Airbnb, Inc. (ABNB) | Expedia Group, Inc. (EXPE) |
|---|---|---|
| Revenue | 12.2B | 14.7B |
| Cost of Revenue | 2.1B | 2.3B |
| Operating Expenses | 7.6B | 10.4B |
| Gross Profit | 10.2B | 12.4B |
| EBITDA | 2.5B | 2.9B |
| EBIT | 2.5B | 2.0B |
| Interest Expense | 0 | 299M |
| Net Income | 2.5B | 1.3B |
| EPS | 4.1 | 10.3 |
| Fiscal Year | 2025 | 2025 |
Income Statement Analysis: The Bottom-Line Duel
The following income statement comparison reveals which company runs a more efficient and profitable business engine under current market conditions.
Airbnb, Inc. Analysis
Airbnb’s revenue grew steadily to $12.2B in 2025, up 10.3% from 2024, while net income declined slightly to $2.51B. It sustains robust margins with a gross margin near 83% and a net margin above 20%. Despite a minor dip in EBIT and net margin growth last year, its overall margin health and double-digit revenue expansion demonstrate operational strength.
Expedia Group, Inc. Analysis
Expedia’s revenue increased 7.6% to $14.7B in 2025, with net income rising to $1.29B. It achieves a strong gross margin of 84% but trails Airbnb with a lower net margin of 8.8%. However, Expedia posted solid EBIT growth of 10.6% last year and improved EPS by 9.6%, signaling improving profitability and operational leverage.
Margin Efficiency vs. Growth Momentum
Airbnb leads in net margin and overall profitability, reflecting superior cost control and efficiency. Expedia commands larger top-line scale and faster EBIT and EPS growth last year, indicating rising momentum. For investors, Airbnb’s profile suits those prioritizing margin excellence, while Expedia appeals to growth-focused portfolios seeking accelerating earnings.
Financial Ratios Comparison
These vital ratios act as a diagnostic tool to expose the underlying fiscal health, valuation premiums, and capital efficiency of the companies analyzed:
| Ratios | Airbnb, Inc. (ABNB) | Expedia Group, Inc. (EXPE) |
|---|---|---|
| ROE | 30.6% | 100.8% |
| ROIC | 19.3% | 17.0% |
| P/E | 33.1 | 27.4 |
| P/B | 10.1 | 27.7 |
| Current Ratio | 1.38 | 0.73 |
| Quick Ratio | 1.38 | 0.73 |
| D/E | 0.24 | 5.19 |
| Debt-to-Assets | 9.0% | 27.3% |
| Interest Coverage | 0 | 6.6 |
| Asset Turnover | 0.55 | 0.60 |
| Fixed Asset Turnover | 0 | 5.37 |
| Payout Ratio | 0 | 15.5% |
| Dividend Yield | 0 | 0.56% |
| Fiscal Year | 2025 | 2025 |
Efficiency & Valuation Duel: The Vital Signs
Financial ratios act as a company’s DNA, revealing hidden risks and operational excellence that raw numbers alone cannot convey.
Airbnb, Inc.
Airbnb posts a strong 30.6% ROE and a 20.5% net margin, showcasing solid profitability. Its P/E ratio of 33.1 signals a stretched valuation compared to market averages. The company reinvests heavily in R&D, indicating a growth-focused strategy instead of paying dividends. This approach supports long-term value creation despite valuation concerns.
Expedia Group, Inc.
Expedia delivers an extraordinary 100.8% ROE but a modest 8.8% net margin, reflecting high leverage and operational challenges. Its P/E of 27.5 is also high, though less stretched than Airbnb’s. The firm pays a small dividend yield of 0.56%, balancing shareholder returns with reinvestment efforts. However, its weak current ratio raises liquidity concerns.
Premium Valuation vs. Operational Safety
Airbnb exhibits a better balance of profitability and reinvestment but at a premium valuation with moderate liquidity. Expedia’s superior ROE contrasts with weaker margins and financial health. Investors favoring growth may prefer Airbnb’s profile; those prioritizing yield and operational leverage might lean toward Expedia.
Which one offers the Superior Shareholder Reward?
Airbnb (ABNB) pays no dividends but generates strong free cash flow of $7.6/share in 2025, reinvesting heavily in growth with zero payout. Expedia (EXPE) yields 0.56%, with a modest payout ratio of 15%, supported by $24.8/share free cash flow and active buybacks. Airbnb’s capital-light model and consistent free cash flow growth suggest a more sustainable, long-term value creation. Expedia’s dividend and buybacks provide income but its high debt leverage and weaker cash coverage raise risks. I judge Airbnb offers superior total shareholder reward potential in 2026.
Comparative Score Analysis: The Strategic Profile
The radar chart reveals the fundamental DNA and trade-offs of Airbnb, Inc. and Expedia Group, Inc., highlighting their financial strengths and vulnerabilities:
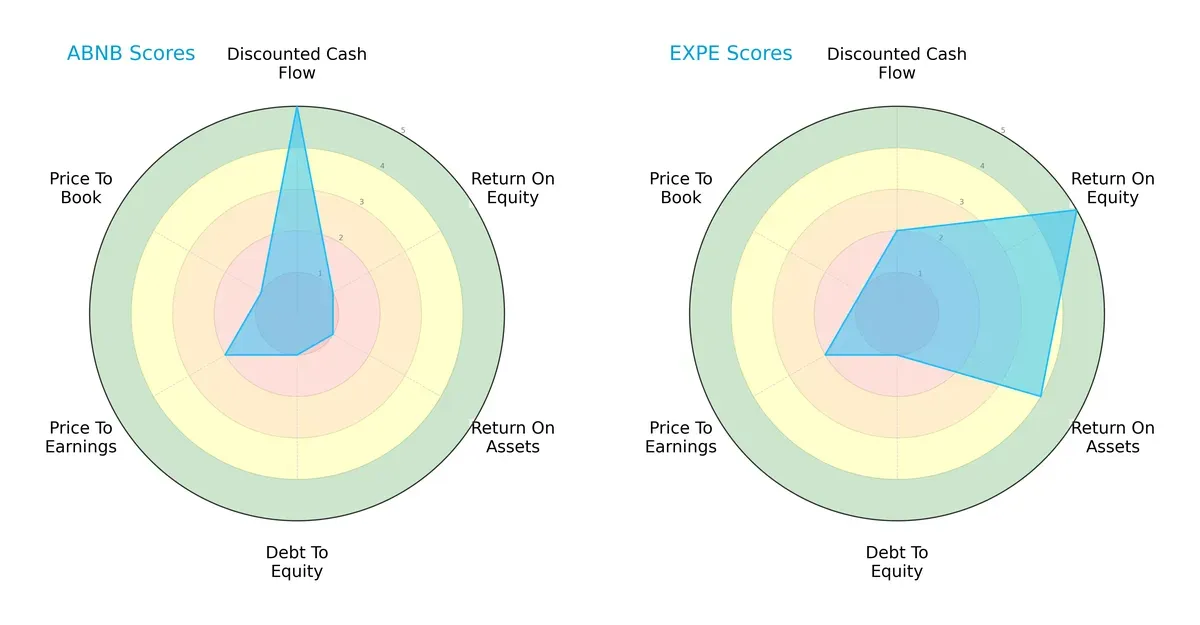
Airbnb excels in discounted cash flow with a very favorable score of 5 but lags in profitability metrics like ROE and ROA (both at 1). Expedia shows strong profitability with ROE at 5 and ROA at 4 but has a weaker DCF score of 2. Both firms carry high debt risk (score 1) and unfavorable valuation metrics. Expedia presents a more balanced profile driven by profitability, while Airbnb relies heavily on future cash flow expectations.
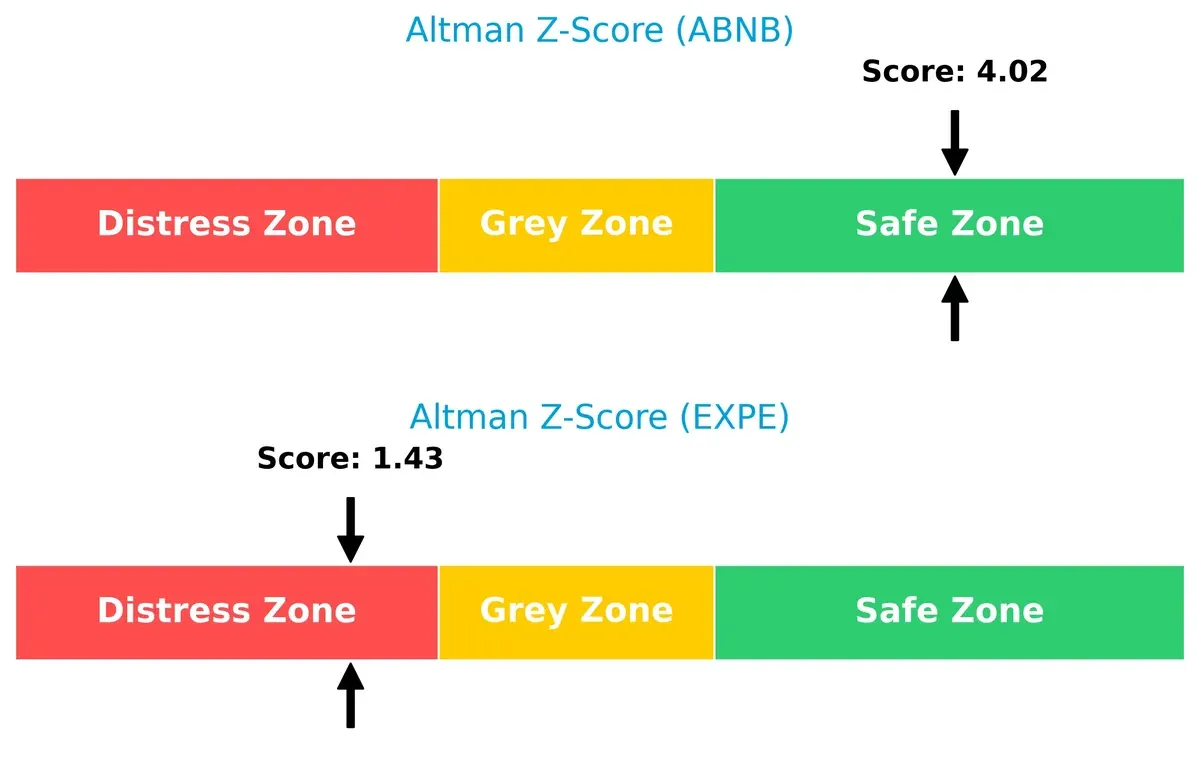
Bankruptcy Risk: Solvency Showdown
Expedia’s Altman Z-Score of 1.43 signals distress risk, whereas Airbnb’s 4.02 places it comfortably in the safe zone. This gap implies Airbnb is better positioned to withstand economic downturns:
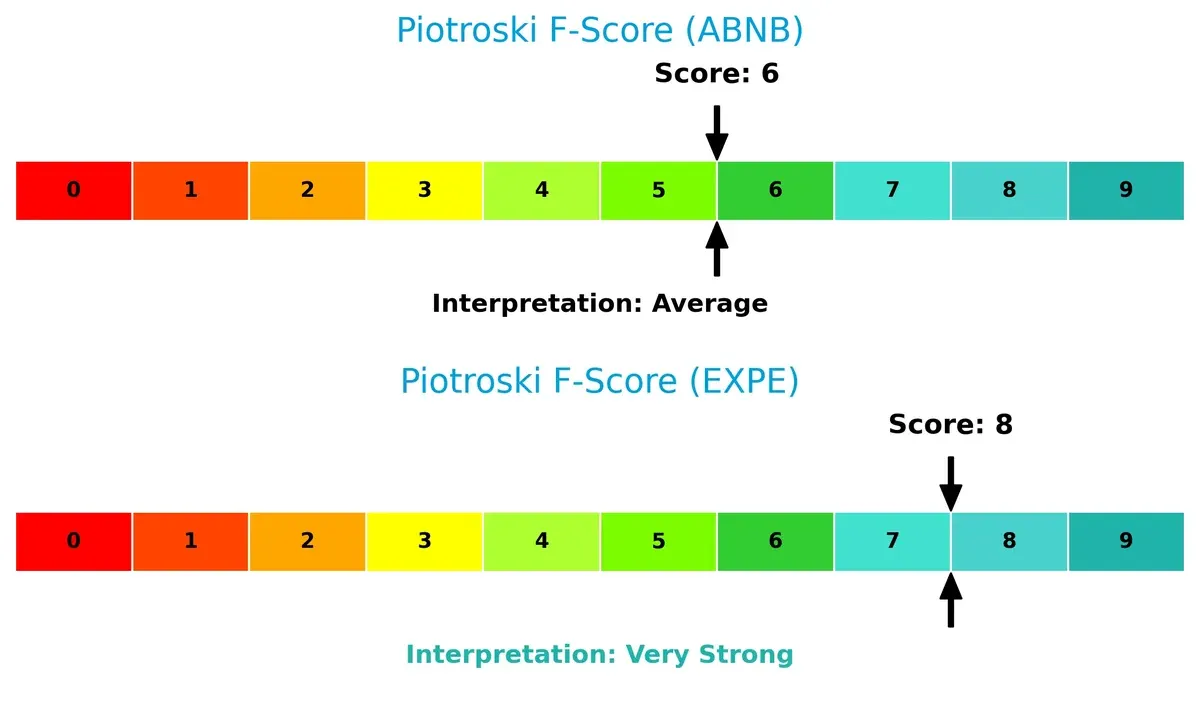
Financial Health: Quality of Operations
Expedia’s Piotroski F-Score of 8 indicates robust financial health, outperforming Airbnb’s average score of 6. Airbnb’s lower score suggests some caution on internal operational metrics:
How are the two companies positioned?
This section dissects Airbnb and Expedia’s operational DNA by comparing their revenue distribution and internal dynamics. The goal is to confront their economic moats and identify which model offers the most resilient competitive advantage today.
Revenue Segmentation: The Strategic Mix
This visual comparison dissects how Airbnb, Inc. and Expedia Group, Inc. diversify income streams and highlights their primary sector bets:
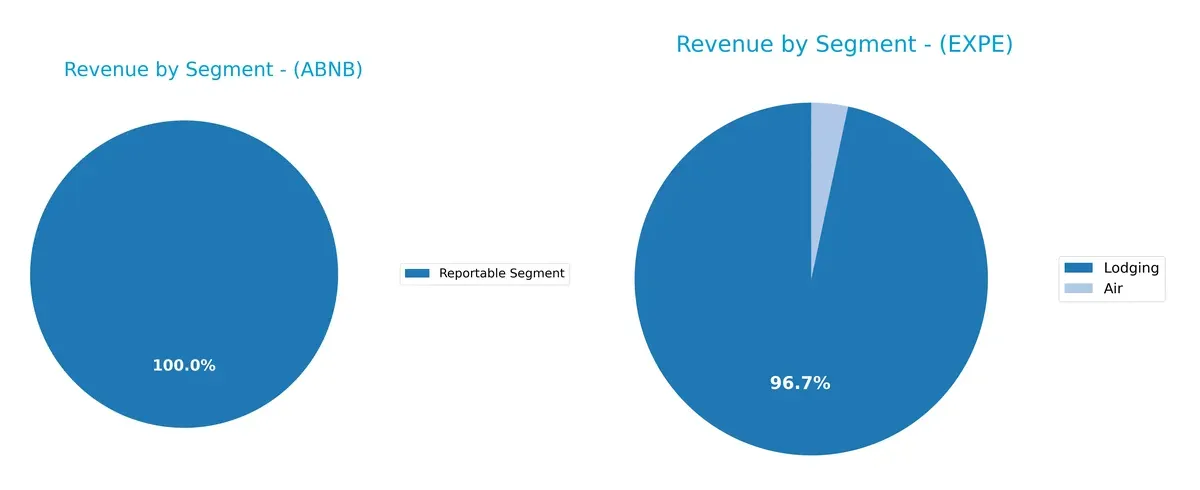
Airbnb anchors its $12.2B revenue in a single reportable segment, signaling a focused business model with potential concentration risk. Expedia generates $11.8B from lodging, supplemented by $407M in air travel, showing more diversification. Expedia’s multi-segment approach mitigates risk and leverages infrastructure dominance, while Airbnb’s reliance on one segment suggests ecosystem lock-in but less buffer against market shifts.
Strengths and Weaknesses Comparison
This table compares the strengths and weaknesses of Airbnb and Expedia based on diversification, profitability, financials, innovation, global presence, and market share:
Airbnb Strengths
- Strong global presence across North America, EMEA, Asia Pacific, and Latin America
- Favorable net margin of 20.51% and ROE of 30.63%
- Low debt-to-assets ratio at 9.0% indicating conservative leverage
- Favorable interest coverage with infinite value
- Diversified revenue stream from a large reportable segment ($12.2B in 2025)
Expedia Strengths
- Very high ROE at 100.78% reflecting efficient capital use
- Favorable ROIC at 17.05% above WACC
- Strong fixed asset turnover at 5.37 showing asset efficiency
- Favorable interest coverage at 6.62 times
- Large U.S. market share with $8.7B revenue in 2025
Airbnb Weaknesses
- Unfavorable valuation multiples: PE at 33.13 and PB at 10.15
- Fixed asset turnover at 0 signals limited asset utilization
- Zero dividend yield
- Neutral current ratio of 1.38 may limit short-term liquidity flexibility
Expedia Weaknesses
- Unfavorable leverage with debt-to-equity at 5.19
- Low current and quick ratios at 0.73 indicating liquidity risk
- Unfavorable PE and PB multiples at 27.45 and 27.66 respectively
- Dividend yield low at 0.56%
- Net margin neutral at 8.78%, lower than Airbnb
Both companies exhibit strengths in capital efficiency and market presence but differ in financial health and valuation. Airbnb’s diversified geography and profitability contrast with Expedia’s heavy U.S. market focus and higher leverage. These factors shape their strategic priorities and risk profiles.
The Moat Duel: Analyzing Competitive Defensibility
A structural moat protects long-term profits from competitive erosion by maintaining economic profits despite market pressures:
Airbnb, Inc.: Network Effects Powerhouse
Airbnb’s moat stems from powerful network effects, linking millions of hosts and guests worldwide. This drives high ROIC (10.4% above WACC) and margin stability. Expansion into experiences and new markets in 2026 could deepen its defensibility.
Expedia Group, Inc.: Brand Portfolio and Scale Advantage
Expedia relies on a broad brand portfolio and scale, creating a cost advantage and diversified revenue streams. Its ROIC also outpaces WACC by 8.3%, with rapid ROIC growth signaling efficient capital use. Further geographic expansion may strengthen its position.
Verdict: Network Effects vs. Brand Scale
Airbnb’s network effects create a deeper moat than Expedia’s brand-driven scale. I see Airbnb better equipped to defend market share amid rising competition due to stronger customer lock-in and platform dynamics.
Which stock offers better returns?
The past year shows Airbnb, Inc. declining sharply, while Expedia Group, Inc. posts strong gains despite recent pullbacks in both stocks.
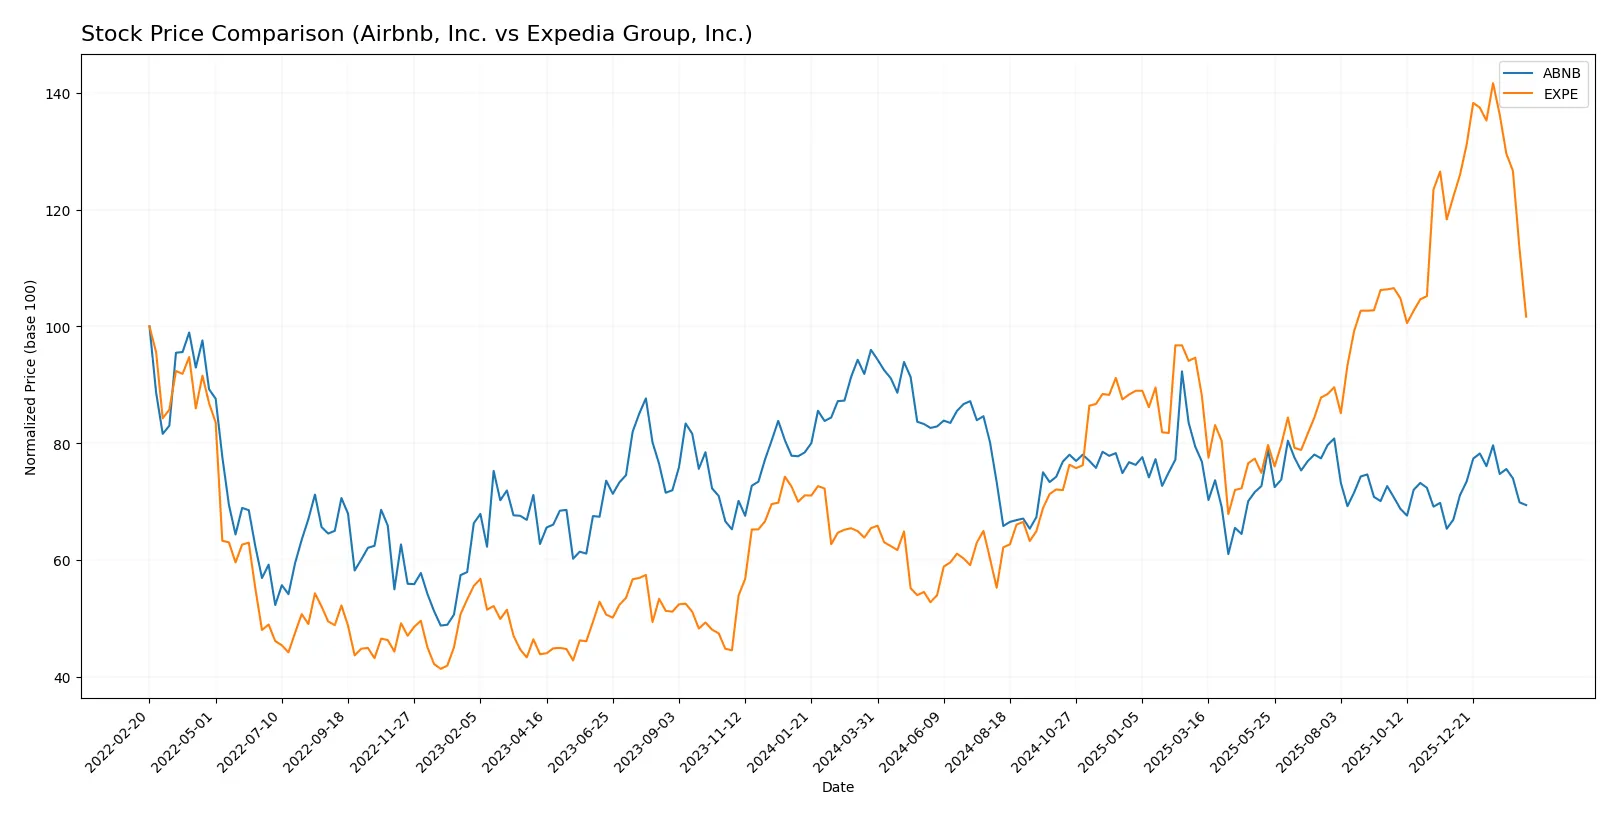
Trend Comparison
Airbnb’s stock fell 27.71% over the last 12 months, marking a bearish trend with accelerating price declines and a high volatility of 12.58%. Its recent three-month trend shows a modest 3.73% rebound.
Expedia’s stock gained 55.42% in the past year, indicating a bullish trend with decelerating momentum and significant volatility at 47.22%. However, recent months reveal a sharp 16.83% downturn.
Expedia outperformed Airbnb over 12 months despite recent weakness, delivering the highest market return among the two companies in this period.
Target Prices
Analysts set a bullish consensus on Airbnb and Expedia, reflecting confidence in travel services growth.
| Company | Target Low | Target High | Consensus |
|---|---|---|---|
| Airbnb, Inc. | 107 | 170 | 141.93 |
| Expedia Group, Inc. | 244 | 330 | 277.43 |
The target consensus for Airbnb is roughly 17% above its current 121.35 price, signaling upside potential. Expedia’s consensus target exceeds its 212.67 price by about 30%, indicating strong analyst optimism.

Don’t Let Luck Decide Your Entry Point
Optimize your entry points with our advanced ProRealTime indicators. You’ll get efficient buy signals with precise price targets for maximum performance. Start outperforming now!
How do institutions grade them?
The following tables summarize recent institutional grades for Airbnb, Inc. and Expedia Group, Inc.:
Airbnb, Inc. Grades
The latest analyst actions and grades for Airbnb, Inc. from major firms:
| Grading Company | Action | New Grade | Date |
|---|---|---|---|
| Wedbush | maintain | Neutral | 2026-02-13 |
| Evercore ISI Group | upgrade | Outperform | 2026-02-13 |
| Barclays | maintain | Equal Weight | 2026-02-13 |
| Deutsche Bank | upgrade | Buy | 2026-02-13 |
| TD Cowen | maintain | Buy | 2026-02-13 |
| Wells Fargo | maintain | Equal Weight | 2026-02-13 |
| BMO Capital | maintain | Market Perform | 2026-02-13 |
| Benchmark | maintain | Buy | 2026-02-13 |
| Wedbush | maintain | Neutral | 2026-02-06 |
| Citizens | upgrade | Market Outperform | 2026-02-04 |
Expedia Group, Inc. Grades
The recent institutional grades and recommendations for Expedia Group, Inc.:
| Grading Company | Action | New Grade | Date |
|---|---|---|---|
| Piper Sandler | maintain | Neutral | 2026-02-13 |
| DA Davidson | maintain | Neutral | 2026-02-13 |
| Wells Fargo | maintain | Equal Weight | 2026-02-13 |
| BTIG | maintain | Buy | 2026-02-13 |
| Benchmark | maintain | Buy | 2026-02-13 |
| Barclays | maintain | Equal Weight | 2026-02-13 |
| TD Cowen | maintain | Hold | 2026-02-13 |
| Truist Securities | maintain | Hold | 2026-02-10 |
| Wedbush | maintain | Neutral | 2026-02-06 |
| UBS | maintain | Neutral | 2026-02-03 |
Which company has the best grades?
Airbnb, Inc. has received more upgrades and higher ratings, including multiple Buy and Outperform grades. Expedia Group, Inc. shows more Neutral and Hold recommendations. This suggests Airbnb currently holds a more favorable institutional view, potentially influencing investor confidence.
Risks specific to each company
The following categories identify the critical pressure points and systemic threats facing both firms in the 2026 market environment:
1. Market & Competition
Airbnb, Inc.
- Strong brand in alternative accommodations but faces intense competition from traditional hotels and other platforms.
Expedia Group, Inc.
- Diverse portfolio with multiple travel brands but highly competitive space with pressure on margins.
2. Capital Structure & Debt
Airbnb, Inc.
- Low debt-to-equity ratio (0.24) signals conservative leverage and financial flexibility.
Expedia Group, Inc.
- High debt-to-equity ratio (5.19) raises financial risk despite adequate interest coverage.
3. Stock Volatility
Airbnb, Inc.
- Beta of 1.15 indicates moderate volatility, in line with consumer cyclical sector norms.
Expedia Group, Inc.
- Higher beta of 1.38 signals greater sensitivity to market swings and economic cycles.
4. Regulatory & Legal
Airbnb, Inc.
- Faces regulatory scrutiny in multiple jurisdictions over short-term rental laws.
Expedia Group, Inc.
- Exposure to evolving travel regulations globally but diversified segments mitigate risks.
5. Supply Chain & Operations
Airbnb, Inc.
- Platform depends on hosts’ compliance and quality, with limited direct control over assets.
Expedia Group, Inc.
- Operates complex supply chains with risks in corporate travel and third-party service providers.
6. ESG & Climate Transition
Airbnb, Inc.
- Growing pressure to demonstrate sustainable tourism and reduce environmental footprint.
Expedia Group, Inc.
- Larger operational footprint requires robust ESG strategies; progress is mixed but ongoing.
7. Geopolitical Exposure
Airbnb, Inc.
- Global presence exposes it to geopolitical tensions affecting travel demand.
Expedia Group, Inc.
- More extensive international operations increase vulnerability to geopolitical shocks.
Which company shows a better risk-adjusted profile?
Airbnb’s most impactful risk is regulatory pressure on short-term rentals, which could constrain growth. Expedia’s largest risk is its high leverage, increasing vulnerability in economic downturns. Airbnb’s strong balance sheet and moderate volatility offer a better risk-adjusted profile. Expedia’s distress-level Altman Z-Score and elevated beta warrant caution.
Final Verdict: Which stock to choose?
Airbnb’s superpower lies in its efficient capital allocation and ability to create lasting economic value, demonstrated by a very favorable moat and strong ROIC growth. Its point of vigilance remains the relatively high valuation multiples, which could pressure returns in a market correction. It suits an Aggressive Growth portfolio willing to pay for sustainable innovation.
Expedia’s strategic moat stems from its asset-light model and solid recurring revenue streams, offering a more stable earnings profile than Airbnb. However, financial leverage and liquidity ratios suggest caution, especially in turbulent markets. It fits a GARP (Growth at a Reasonable Price) portfolio seeking balanced growth and income with moderate risk.
If you prioritize long-term value creation and can tolerate valuation risks, Airbnb outshines with robust profitability and capital efficiency. However, if you seek better financial stability and a more conservative growth path, Expedia offers superior safety despite its leverage concerns. Both present compelling but distinct analytical scenarios depending on your risk appetite and investment horizon.
Disclaimer: Investment carries a risk of loss of initial capital. The past performance is not a reliable indicator of future results. Be sure to understand risks before making an investment decision.
Go Further
I encourage you to read the complete analyses of Airbnb, Inc. and Expedia Group, Inc. to enhance your investment decisions: